

Korea Tripled in a Year. The Chart Just Broke.
The KOSPI went vertical on two chip stocks, then a circuit-breaker crash snapped its trendline. Here’s why I think it bleeds lower into year-end

For some market just did close. For others it’s about to open (especially those in Korea!). Grab a tea (do you know about the Marrakesh tea ?) this time not a coffee, because this one’s worth slowing down for.
Because the Korean stock market just did something that almost never ends quietly. It went vertical, it broke its own trendline, and it printed the kind of weekly chart that traders circle in red years later. I’ve spent the week pulling the data apart - the FRED currency and oil series, the KRX valuation prints, the concentration math, the flow numbers - and the picture that comes out is not a healthy pullback in a young bull market. It looks like distribution. My base case is that the KOSPI grinds lower into the end of 2026, not higher.
Let me show you why, piece by piece, with the receipts.
What actually happened
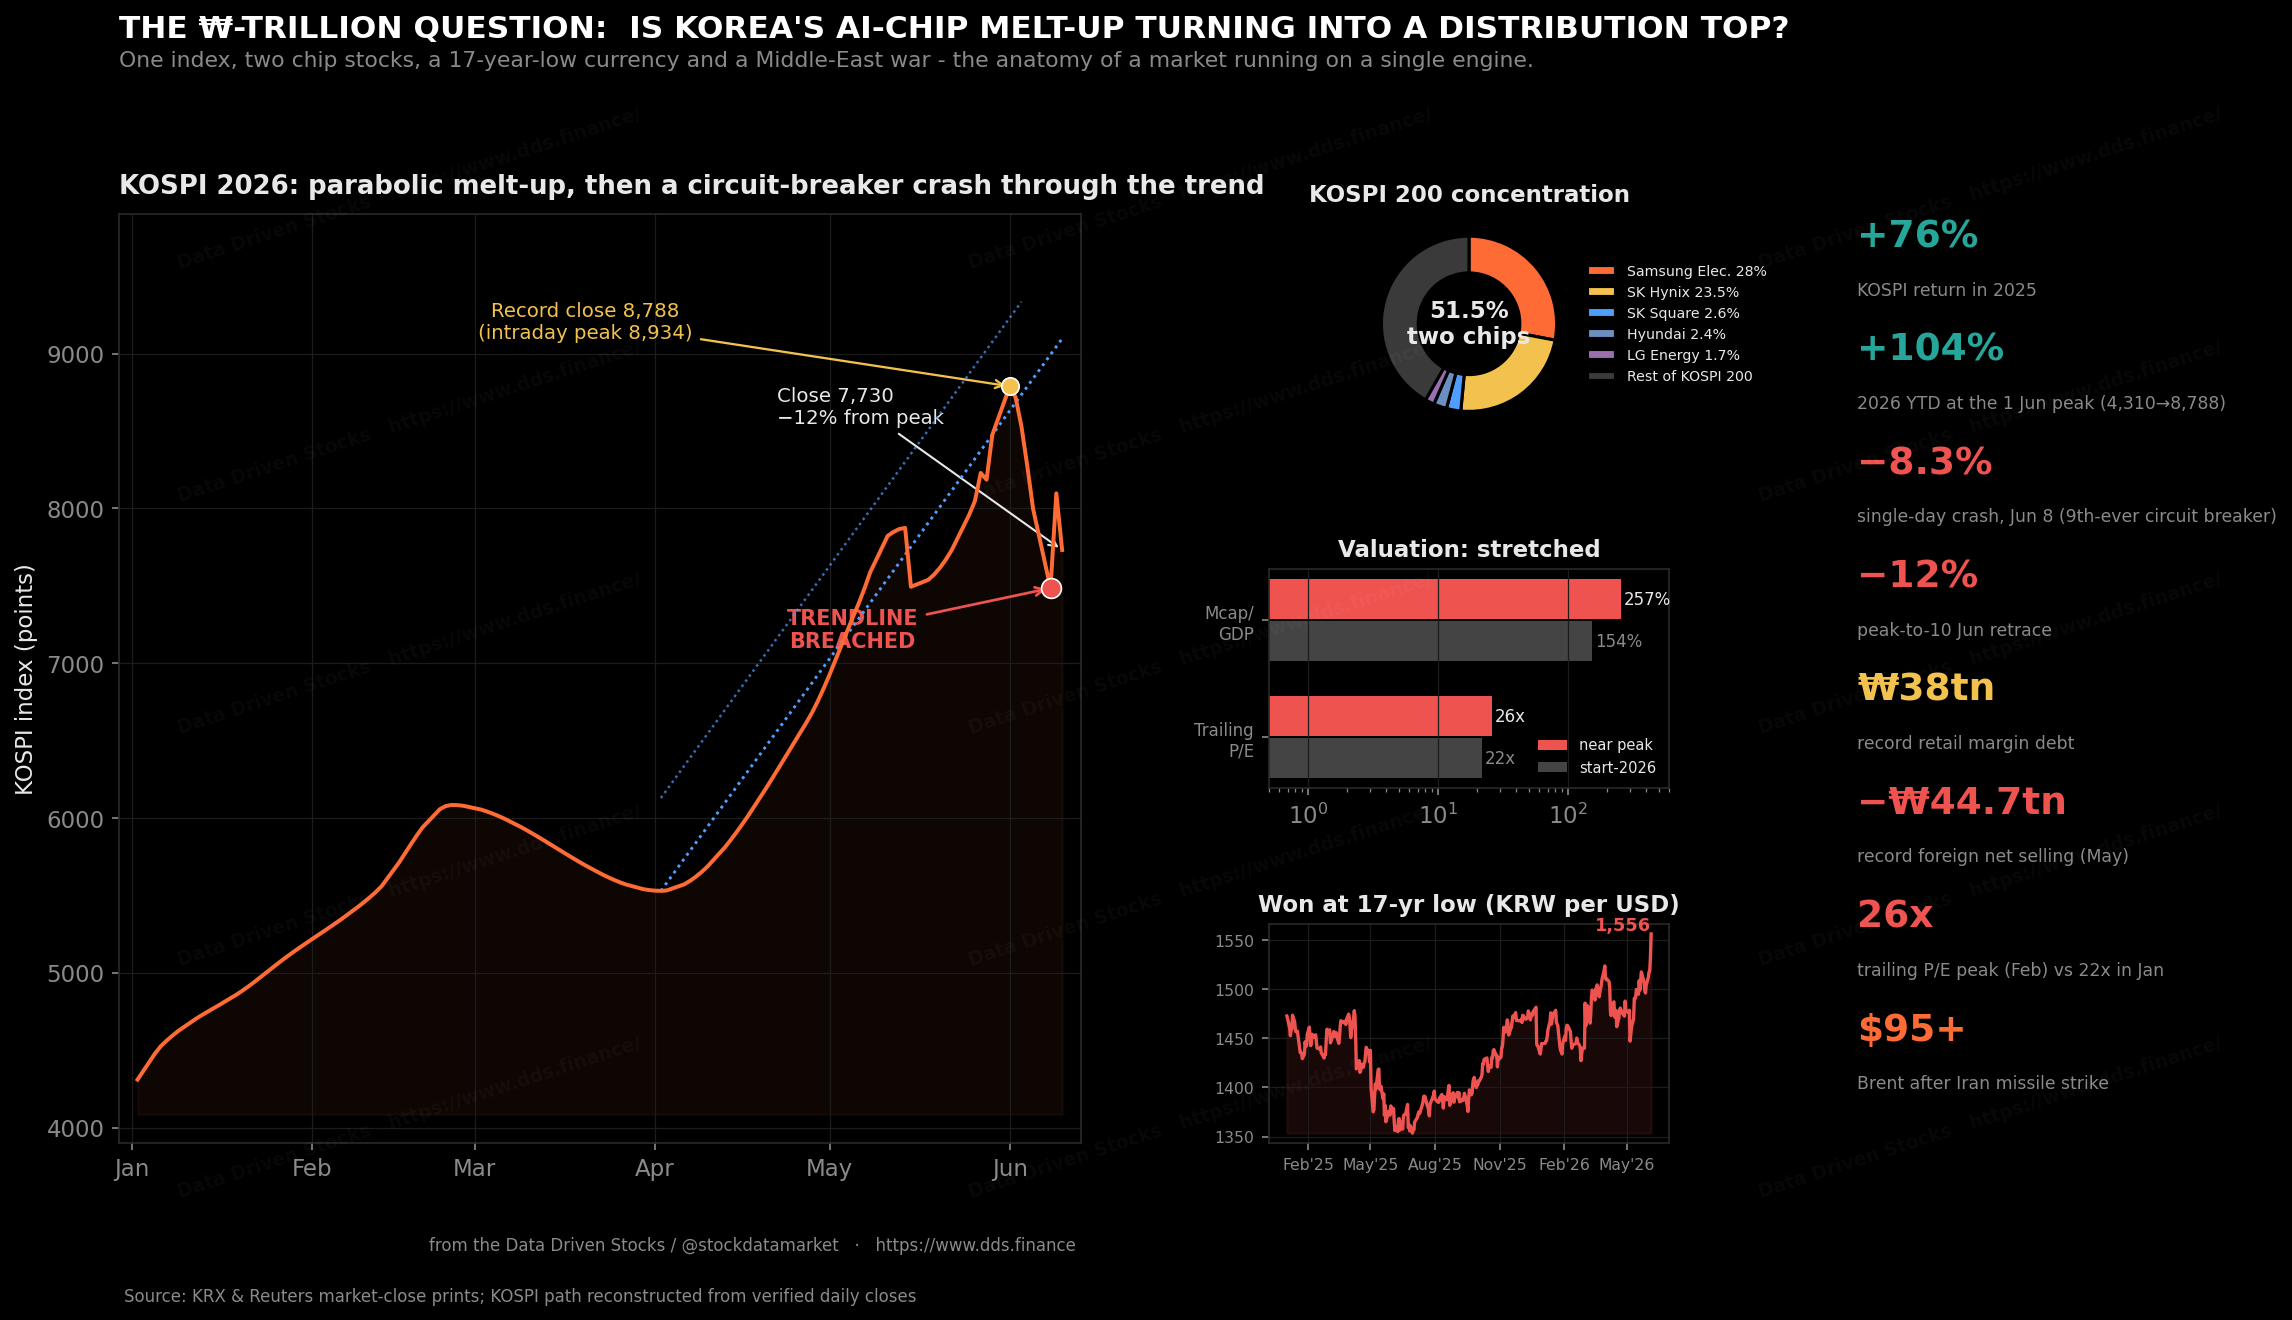
Start with the scoreboard, because the moves were extraordinary even by 2026 standards. The KOSPI set an all-time closing high of 8,788.38 on June 1, with an intraday peak of 8,933.62 - a level that capped a roughly 76% gain in 2025 and another 104% in 2026 to that June peak (from its first-session close of 4,309.63). Then the floor gave way. Broadcom’s June 3 guidance spooked the entire AI-chip complex, the Philadelphia Semiconductor Index fell more than 10% in a session, and Korea - the most chip-levered major index on the planet - took the full blow. The KOSPI dropped 5.54% on June 5, then crashed 8.29% on June 8 to close at 7,484.41, tripping a Level 1 circuit breaker just three minutes and forty-two seconds after the open. That was only the ninth market-wide circuit breaker in the index’s history.
It bounced - hard - on June 9, then gave a chunk back again on June 10, closing at 7,730.82, down 4.52% on the day and about 12% below that early-June record. The volatility index for Korean equities, the VKOSPI, hit a record high. This is not how indices behave on the way up. This is how they behave when ownership is changing hands in a hurry.
The technical picture is where it gets unambiguous.
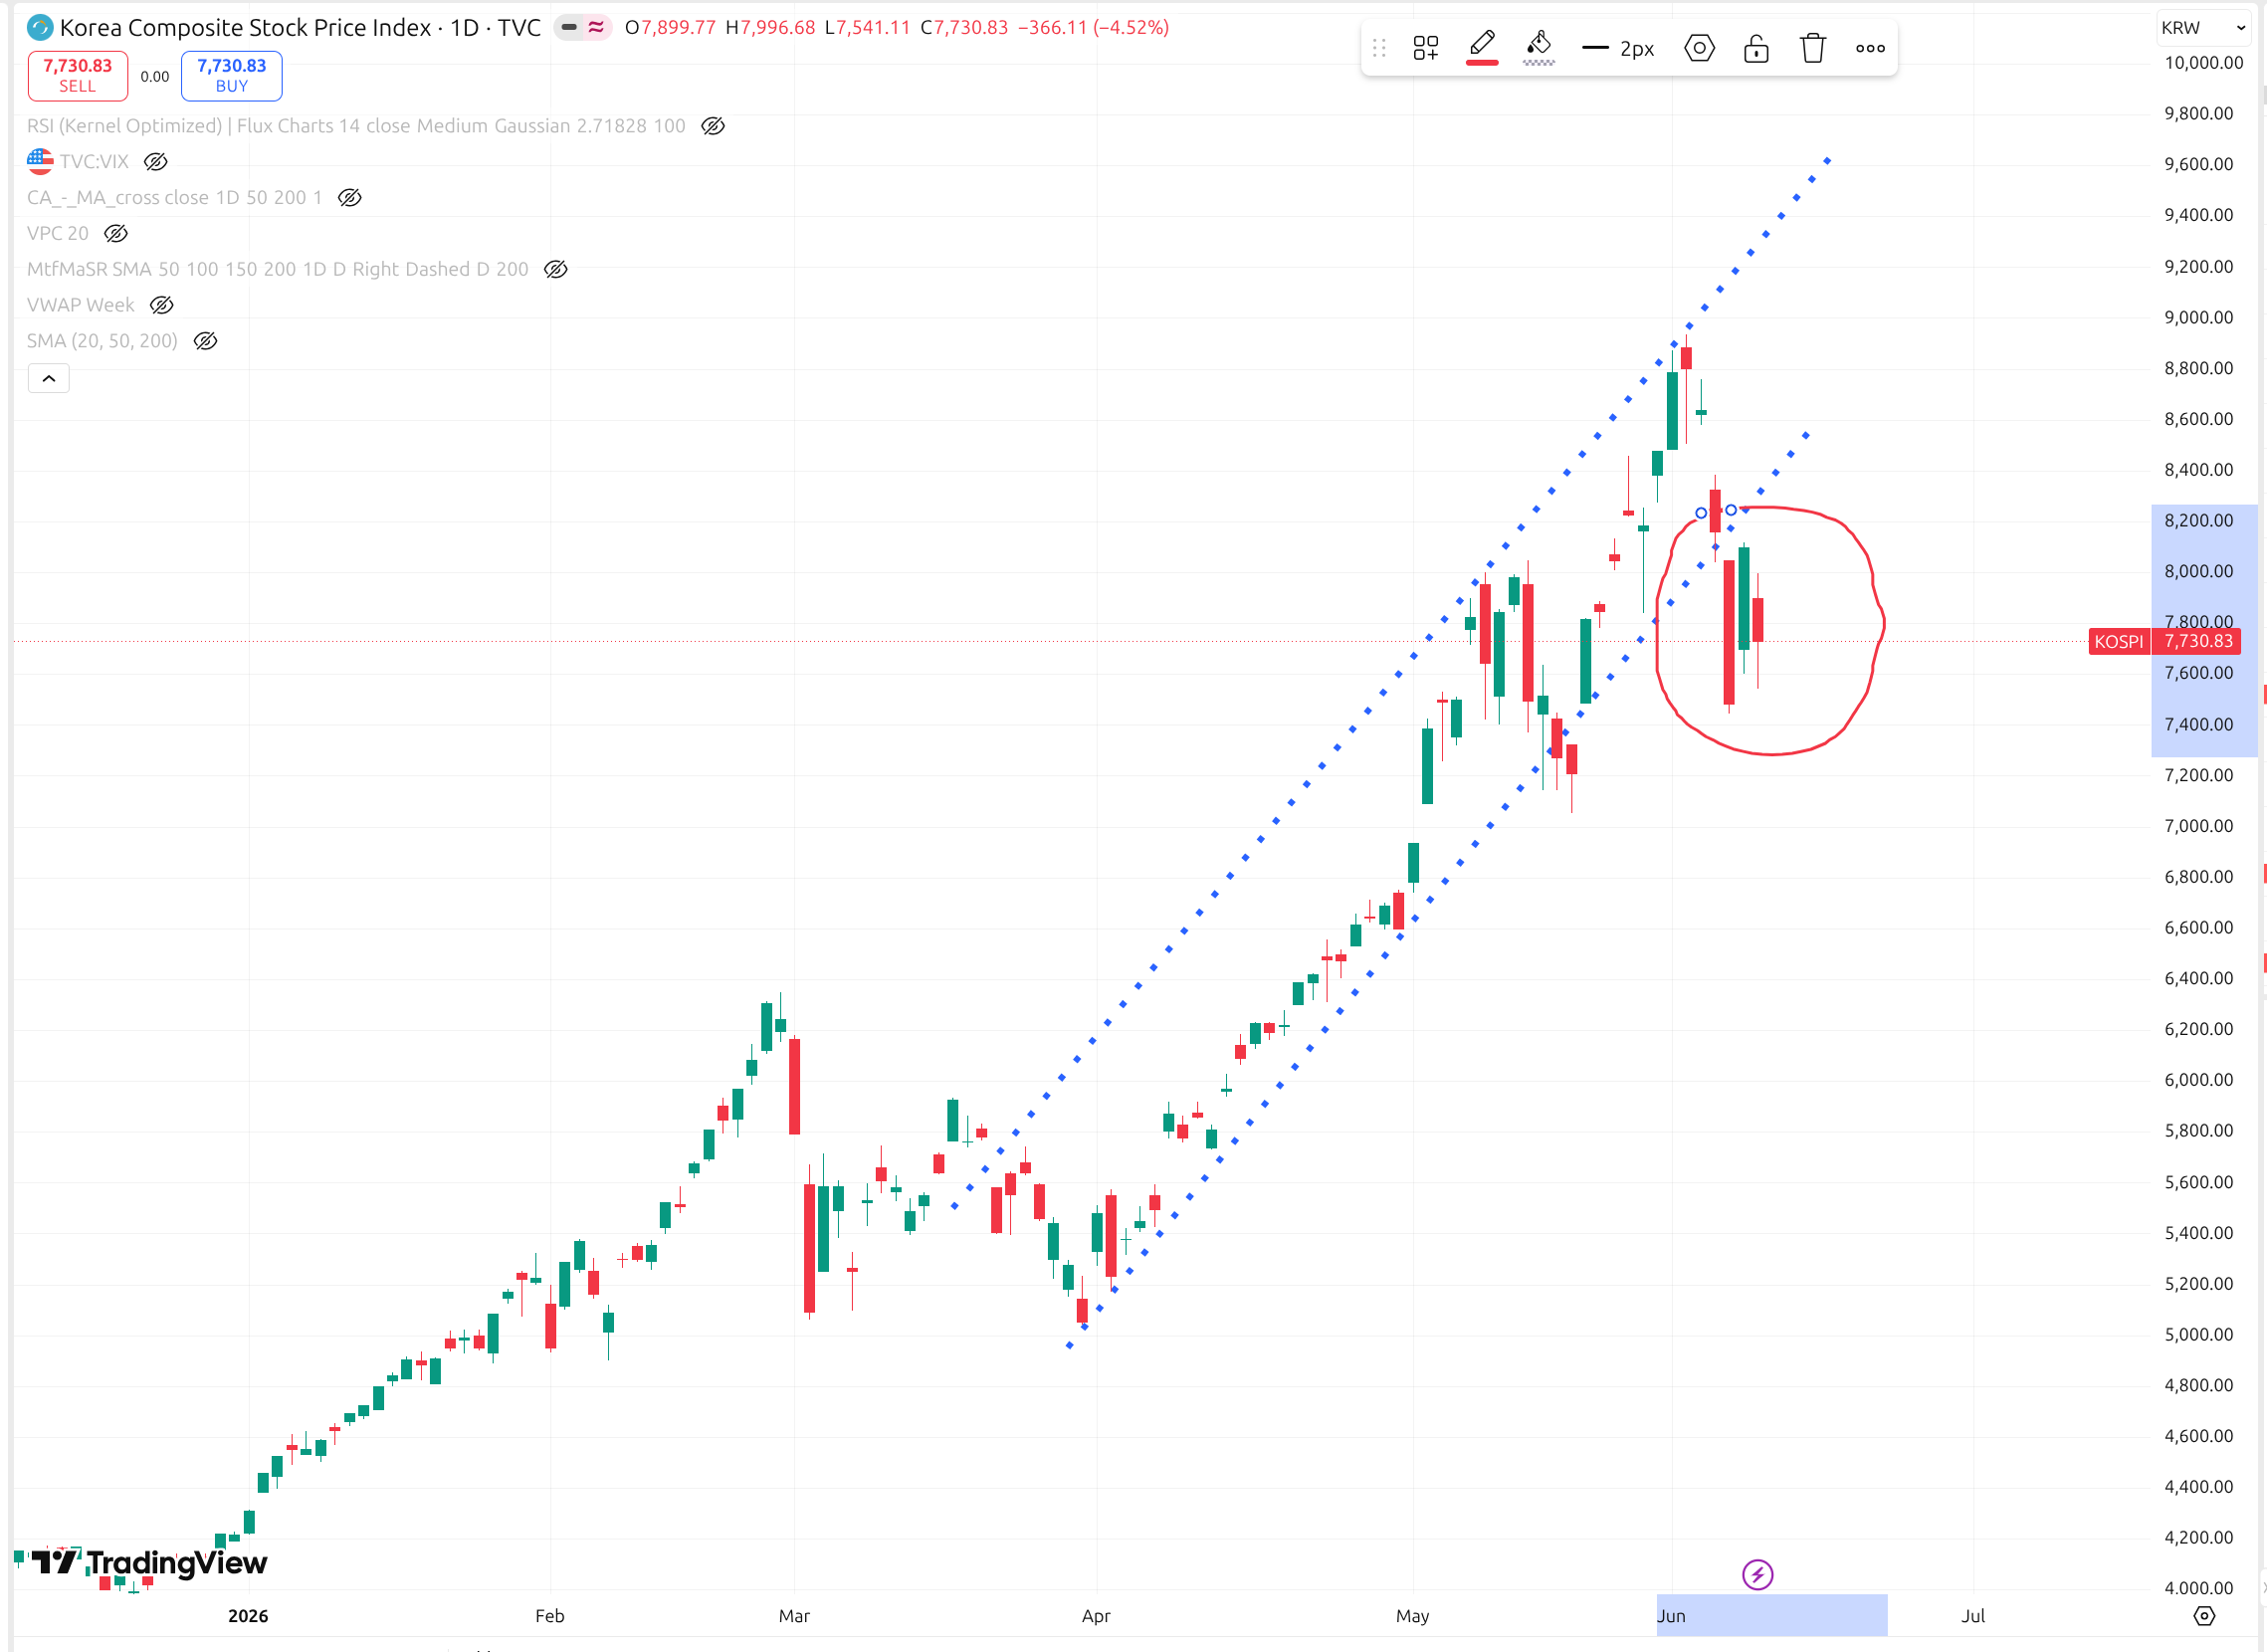
That broken trendline matters more than any single day’s percentage. For two months the KOSPI obeyed a clean rising channel - higher highs, higher lows, every dip bought. The June break severed it. When a parabolic advance loses the line that defined it, the path of least resistance flips from “buy the dip” to “sell the rip,” and the burden of proof shifts onto the bulls to reclaim the structure. As of the close on June 10, they hadn’t.
The monthly chart is screaming
Zoom out from the daily noise to the monthly, and the warning gets louder. I took the OECD’s monthly Korean share-price index - real, published data - and ran a standard 14-period RSI on it, extending the last two months with the KOSPI closes through the crash.
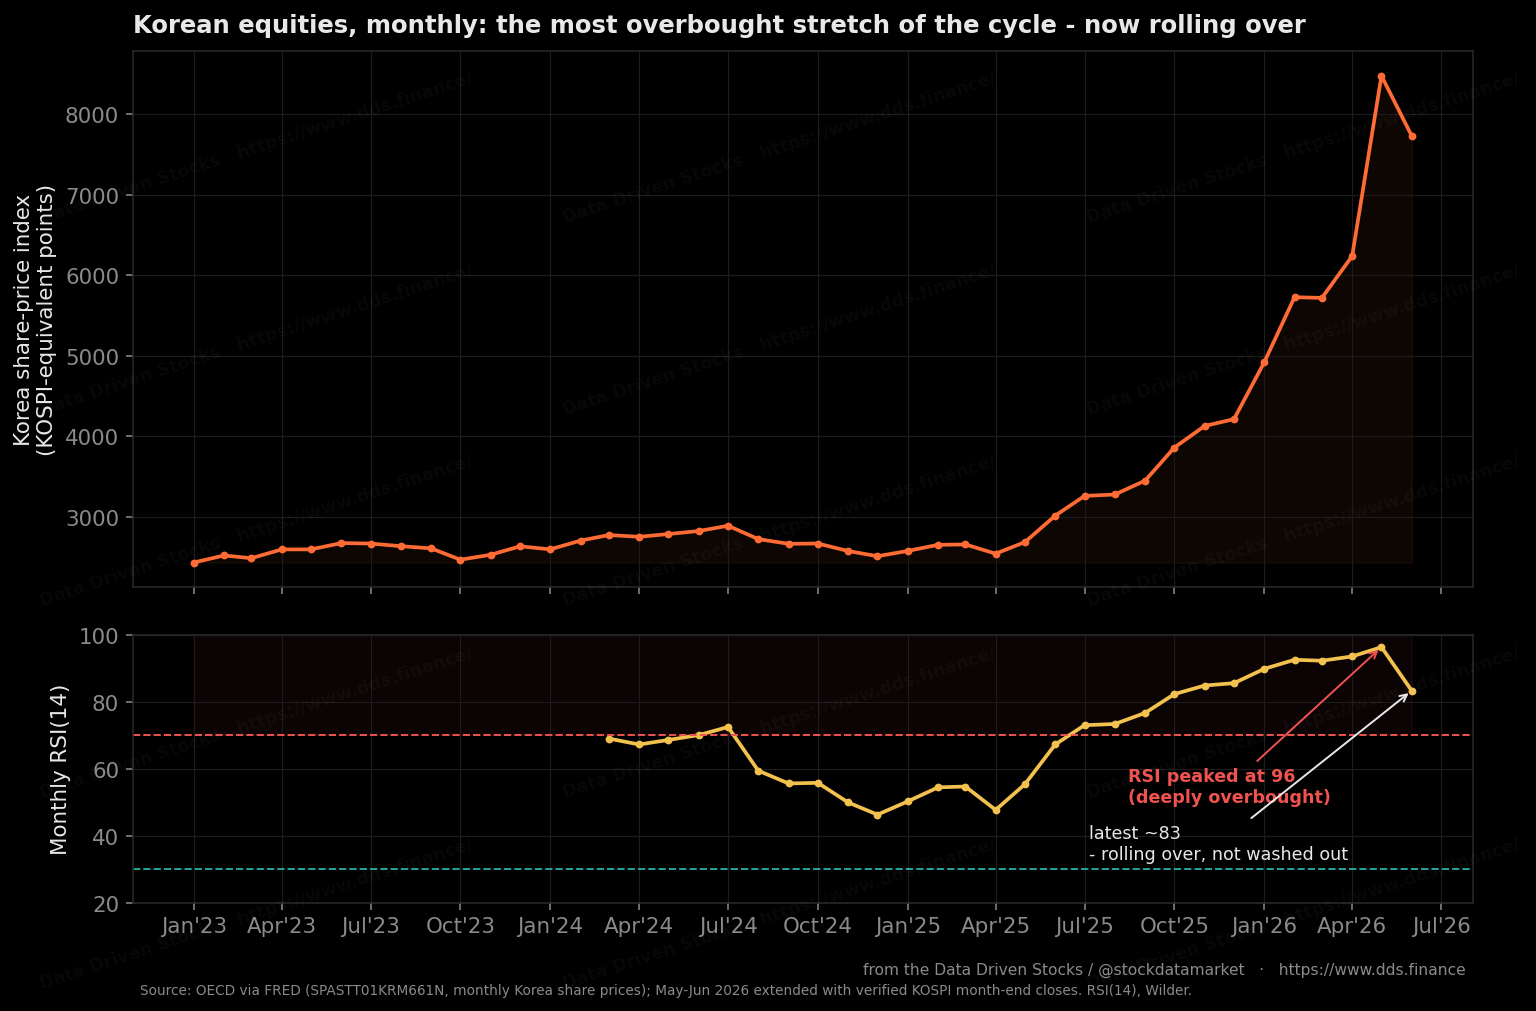
Two things jump out. First, the monthly RSI ran into the mid-90s at the top. Readings like that don’t happen in durable, grinding bull markets - they happen in blow-offs, the final euphoric leg where price detaches from any reasonable trend. Second, and this is the part that keeps me bearish, the RSI is still up in the low-80s even after the crash. The market has come off the boil, but it has not capitulated. There’s no oversold spring coiled here, no 30-handle RSI begging for a snapback. There’s just a very stretched indicator beginning a long descent. Overbought conditions on this timeframe take months to unwind, not days.
One index, two stocks
Here’s the structural fact that explains the violence of the move - and why I think the downside is mechanical, not just emotional. The KOSPI is not really a diversified market. It’s a leveraged bet on two companies.
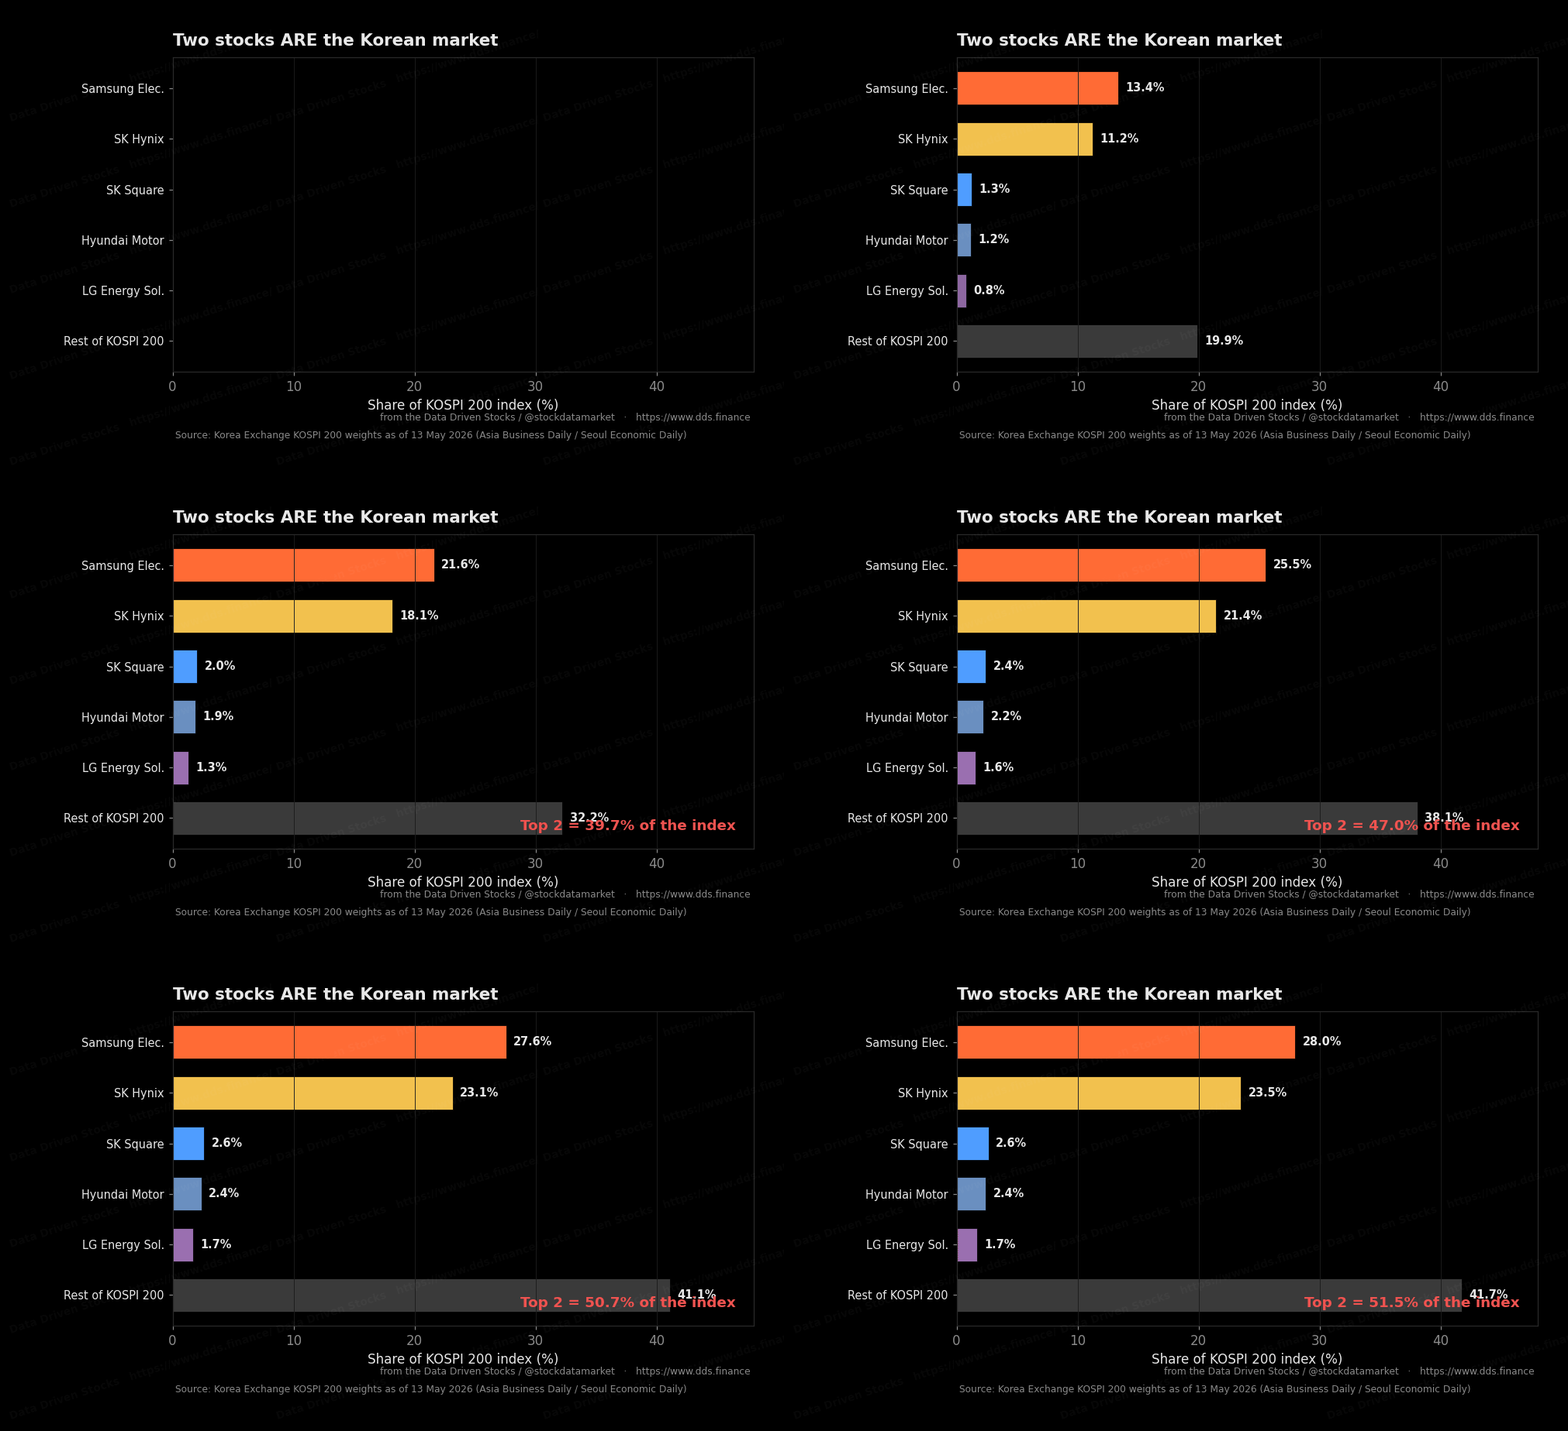
When two names are half your index, the index stops being a barometer of a $1.8-trillion economy and becomes a single, enormous trade on the global memory cycle. The math is brutal on a bad day: a sharp drop in both Samsung and SK Hynix mechanically drags the KOSPI several percentage points before any of the other 800-plus stocks even trade. On June 8, Samsung fell about 10% and SK Hynix about 7%. That’s most of an 8% crash explained by two tickers. You cannot diversify your way out of this inside Korea - if you own the index, you own the chip cycle, full stop.
That concentration cuts both ways, which is exactly the problem. It powered the melt-up, and it will power the unwind.
And here’s the tell that this was never a broad bull market: for most of the run, the typical Korean stock was already falling. Over the roughly one-month surge into late May - the leg that took the KOSPI up about 24% to its records - more than 82% of all listed Korean stocks actually went down. The headline index levitated anyway, because a single chip index did almost all the lifting.
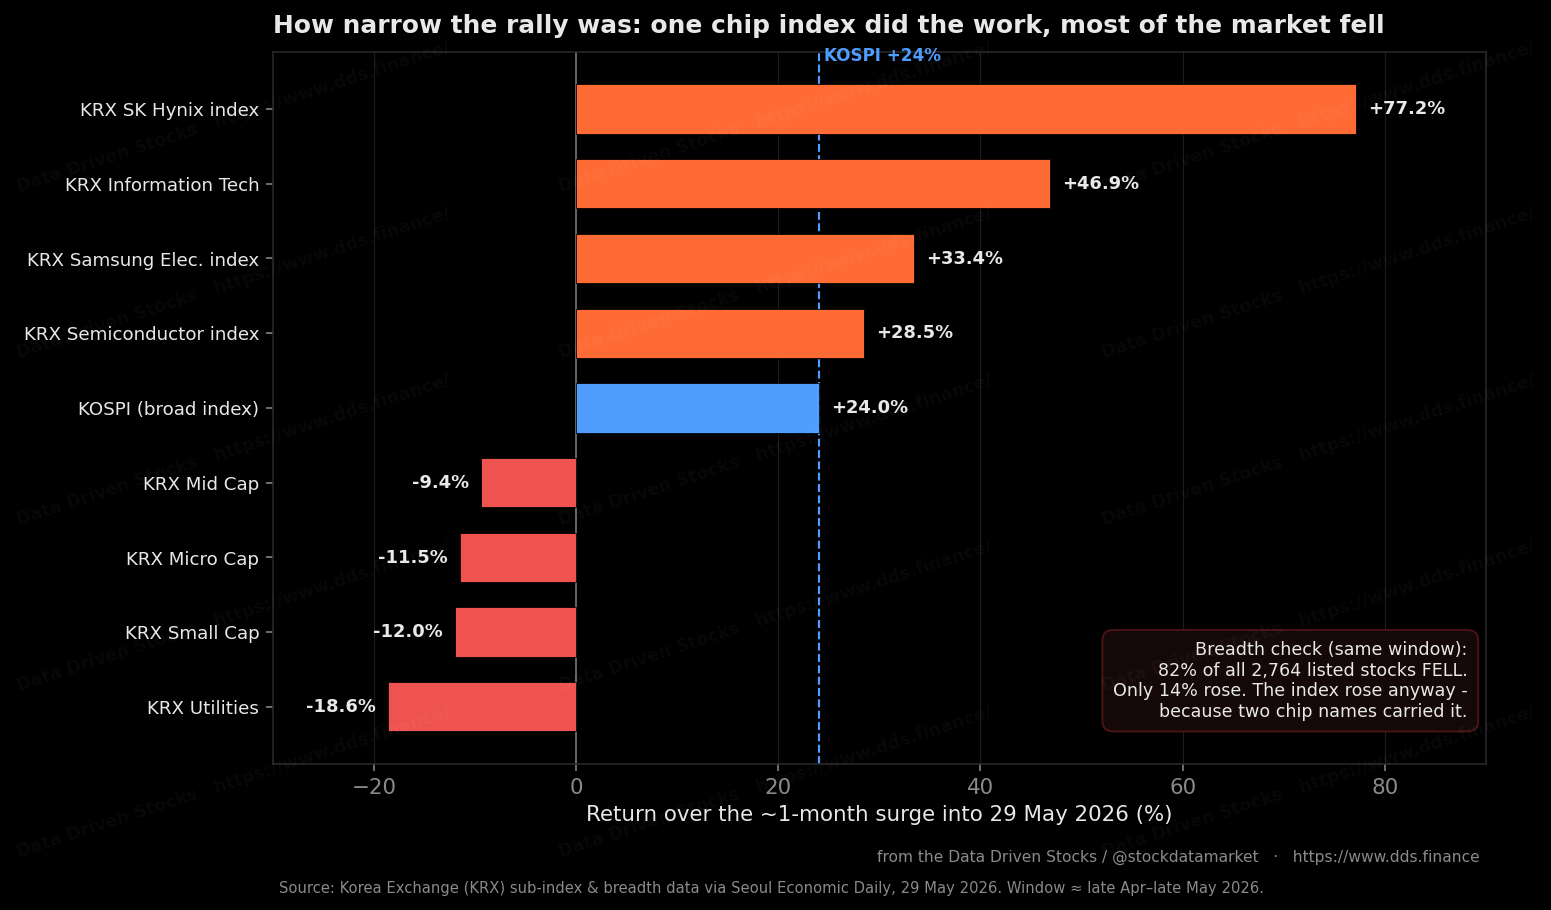
This is the same lesson as the US “one-engine” tape, only more extreme. A market this narrow is brittle by construction: when the one thing carrying it stumbles, there is no second engine of broad participation to cushion the fall. The breadth already rolled over weeks before the index did - the classic warning that a top is forming under the surface while the headline number still makes new highs.
Valuation left “cheap” behind
For years the bull case on Korea rested on one word: cheap. The “Korea discount” was real, the market traded below book at times, and the Value-Up governance push gave investors a reason to believe the gap would close. A lot of that gap has now closed - and then some.
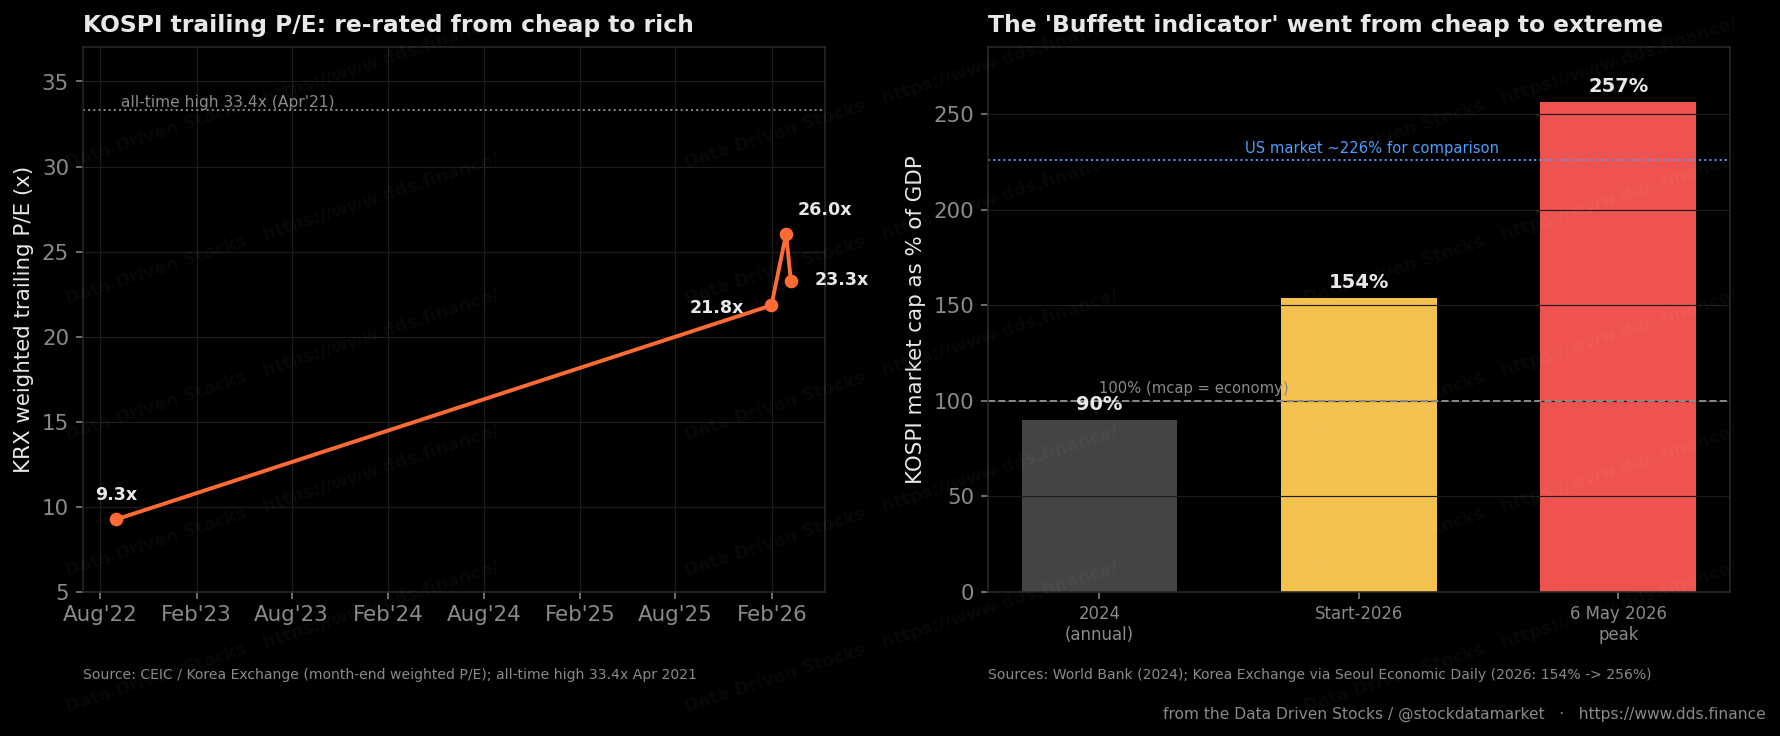
I want to be fair to the bulls here, because the valuation story genuinely has two sides. On trailing numbers, Korea no longer screens cheap at all - a trailing P/E that re-rated to the mid-20s and a market that swelled to roughly 2.5x the size of the entire economy at its peak are not bargain-bin metrics. But on forward earnings, the optimists still have a case: brokers had the index closer to 10x forward earnings earlier in the year, on the argument that the AI-memory earnings cycle would grow into the price. That can be true. The catch is that forward multiples are only as good as the forward earnings, and the whole June sell-off was the market suddenly doubting exactly those forward chip numbers after Broadcom’s guide. When the earnings assumption is the thing in question, “cheap on forward” offers a lot less protection than it sounds.
The honest read: Korea moved from deeply discounted to fully valued in about six months. A fully valued, hyper-concentrated market has very little cushion when its core narrative gets challenged.
Distribution, not accumulation
This is the heart of the bearish thesis, and it’s a flow story. The big, patient money has been leaving in waves while the leveraged, impatient money keeps buying. Foreign investors net sold a record ₩35.7 trillion of KOSPI stock in March, briefly returned to buy about ₩5 trillion in April when the dip looked bought, then sold a fresh record ₩44.7 trillion in May - eclipsing the March record in a single month. Domestic retail absorbed it, increasingly on borrowed money, and the retail margin balance climbed to a record ₩38.0 trillion at the end of May. That combination - institutions distributing into retail leverage - is the textbook signature of a late-cycle top, not an early-cycle base.
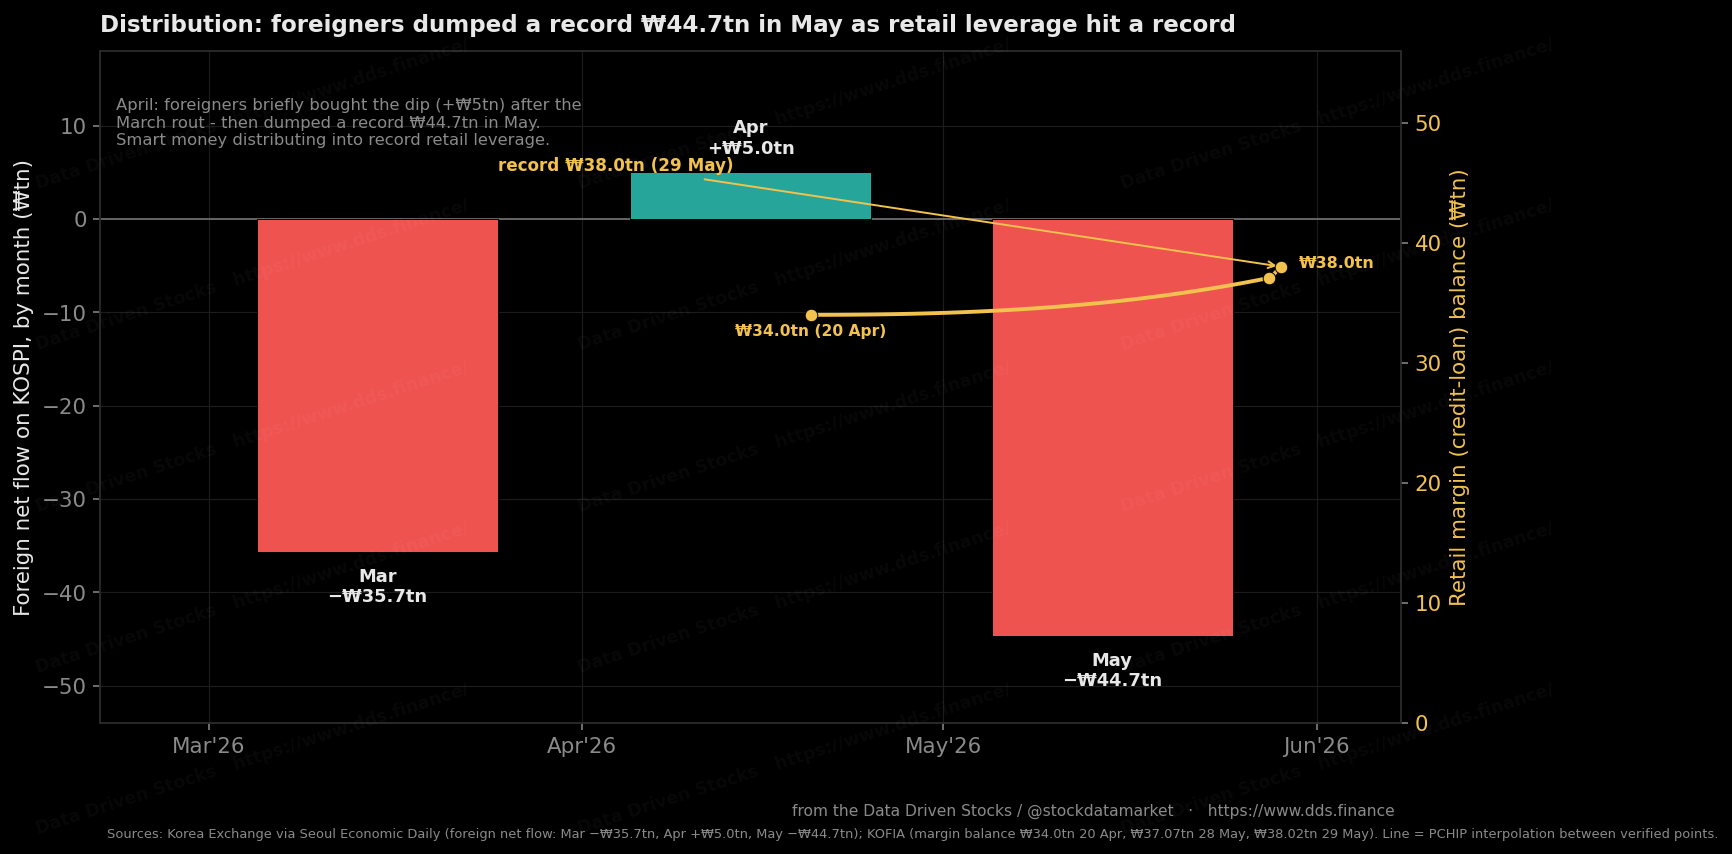
And leverage is reflexive. When a leveraged long gets a margin call, they don’t get to sell what they’d like to sell. They sell what they can - the most liquid names. In Korea, that’s Samsung and SK Hynix, the exact two stocks holding up the index. So a dip in the chips triggers margin calls, the margin calls force selling of the chips, and the chips drag the index, which triggers more margin calls. Layer in the 2x single-stock leveraged ETFs and automated program trading that tripped the sidecar and circuit breaker, and you have a market engineered to fall faster than it rose.
The two exogenous tails: Iran and helium
The domestic structure is the powder. The geopolitics is the spark - and right now there are two sparks lit at once.
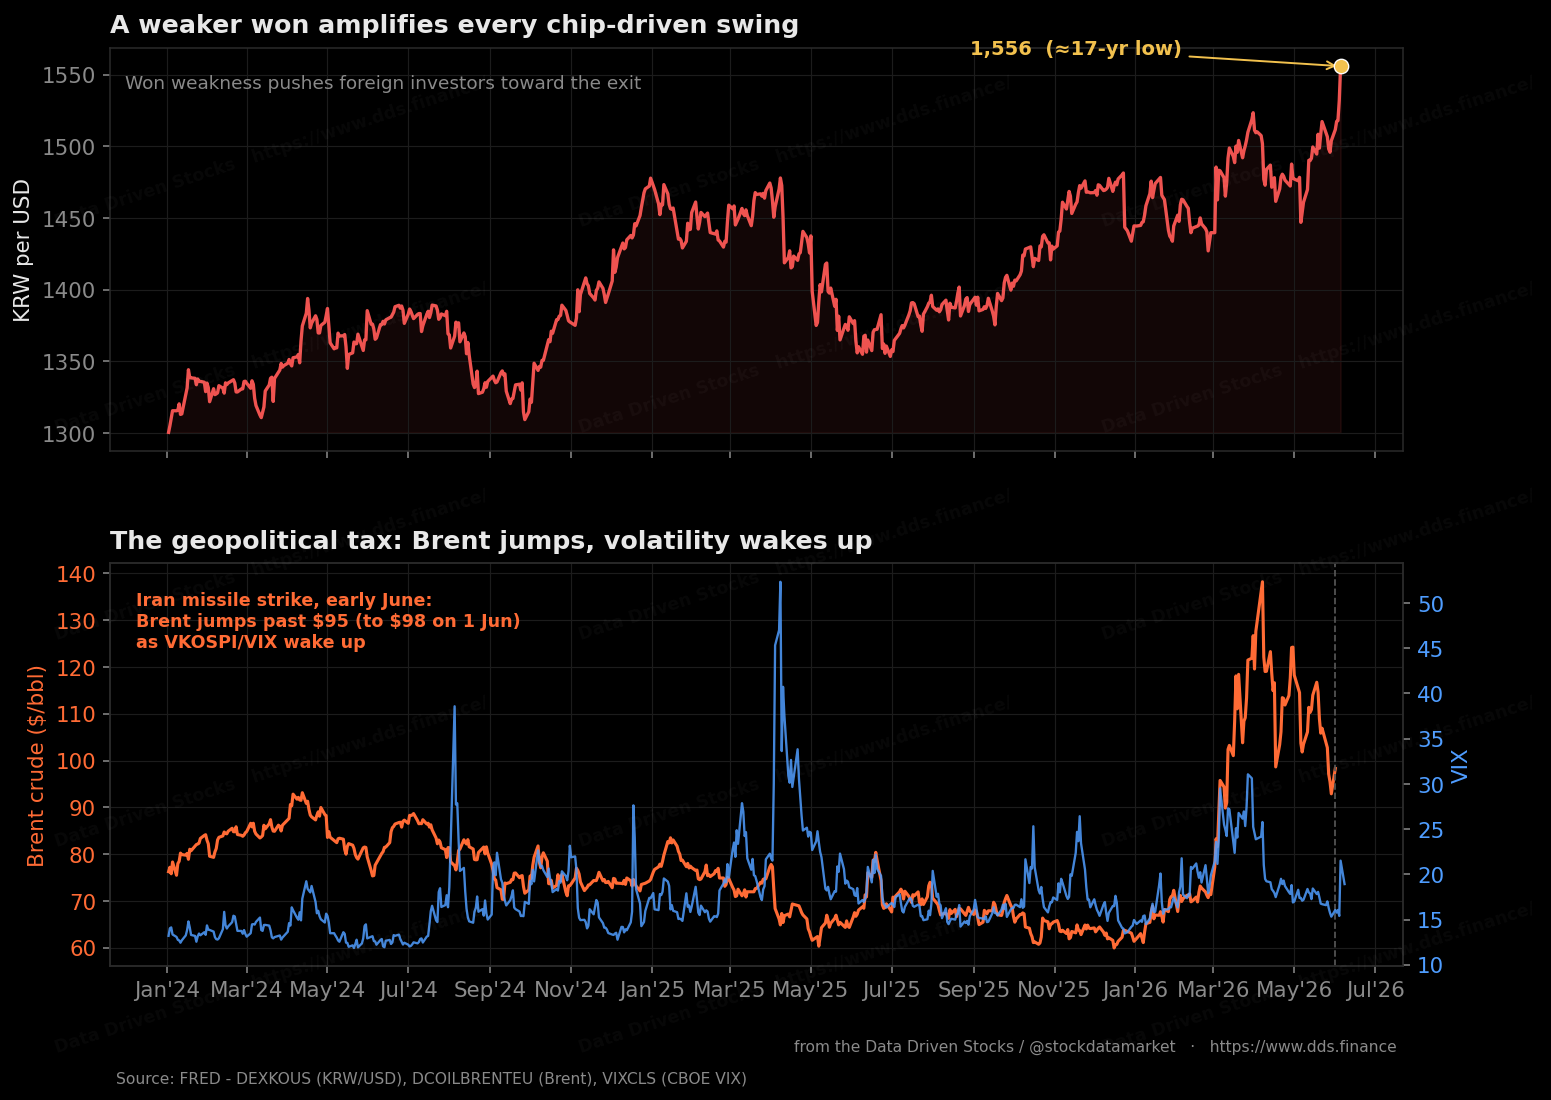
The first is the Iran-Israel conflict. On the night before the June 8 crash, Iran launched its first direct missile strike on Israel since the April ceasefire, and Brent crude jumped above $95. For an economy that imports essentially all of its energy, a sustained oil shock is a direct hit to the trade balance and to corporate margins - and it lands on the won at the worst possible moment.
The second spark is quieter and, in some ways, scarier, because it points straight at the two stocks that are the index. I wrote about it earlier this year in The Invisible Gas That Could Kill the AI Chip Boom:

roughly a third of the world’s helium supply ships through the Strait of Hormuz, and advanced chip fabrication physically cannot proceed without helium for wafer cooling during lithography and etching. There’s no substitute and you can’t stockpile much of it. A Hormuz disruption isn’t just an oil story for Korea - it’s a chip-production story, aimed at exactly Samsung and SK Hynix. The same strait threatens both the energy bill and the thing the whole index is built on.
The US engine Korea is bolted to
You can’t analyze Korea in isolation, because the KOSPI is, in practice, a high-beta clone of the US semiconductor trade. And the US tape is running on one engine. As I argued in The S&P 500 Is at 7,400 and Running on One Engine,

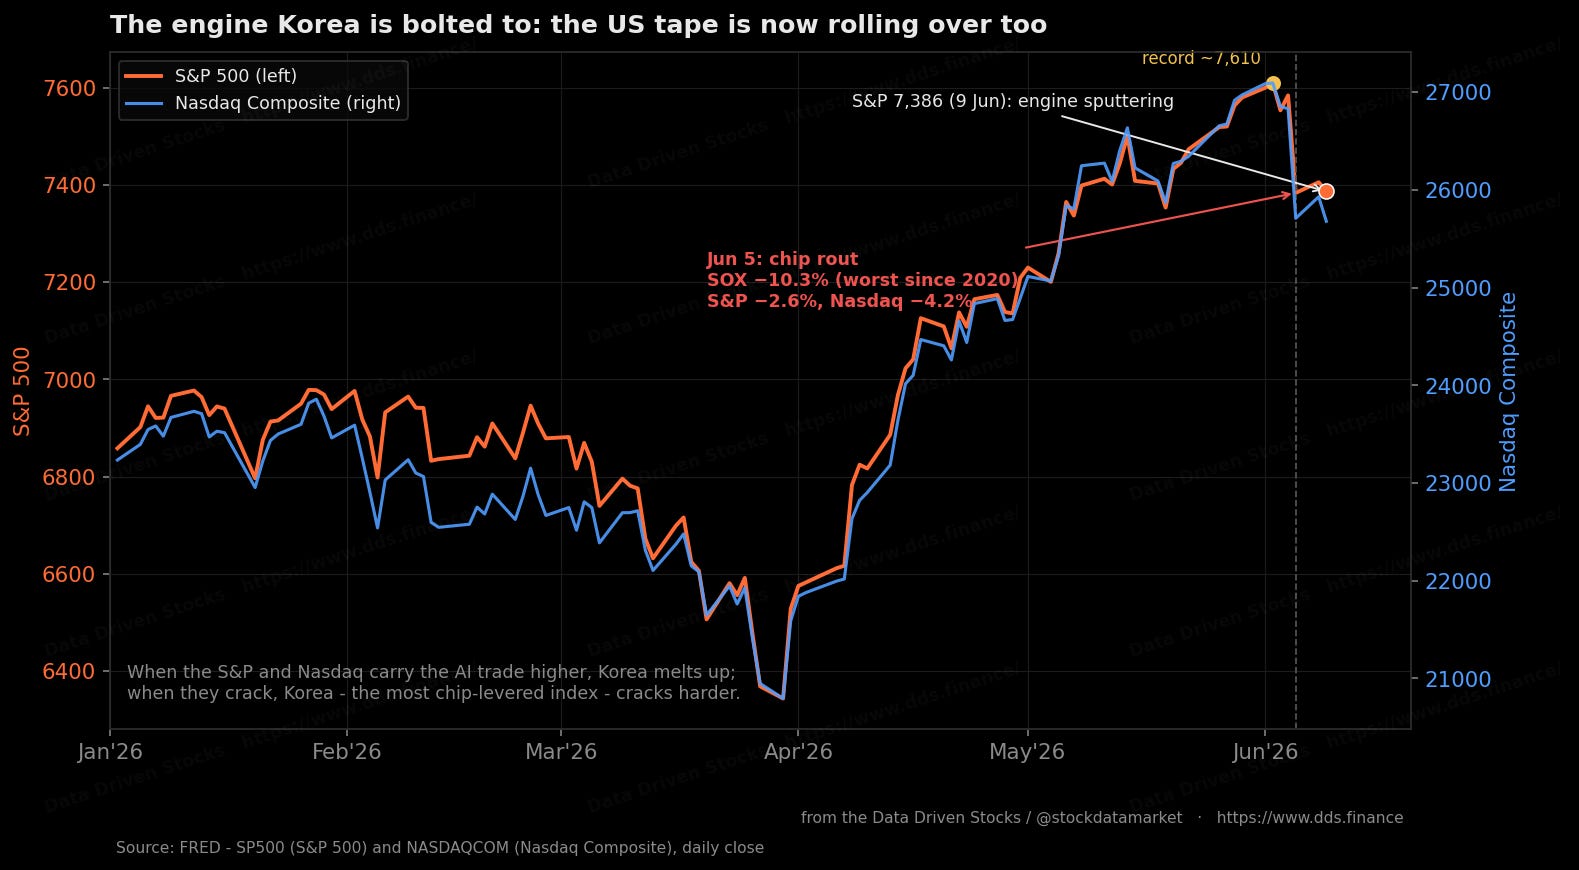
the American market spent most of this year at or near records while AI and chips did nearly all the lifting, with the midterm calendar saying “buy the dip,” Tehran saying “hedge it,” and the Fed saying “wait.” Korea is the leveraged expression of that same one-engine market. When the engine sputters in New York - a Broadcom guide, the Philadelphia Semiconductor Index down 10.3% on June 5 in its worst session since 2020 - it doesn’t cause a cold in Seoul, it causes pneumonia, because Korea has more of its index riding on that single trade than anyone.
And here’s the part that’s changed in just the last few sessions: the engine itself is now sputtering. The S&P 500 snapped a nine-week winning streak with a 2.6% drop on June 5, bounced feebly, then faded again to close at 7,386 on June 9 as President Trump teased fresh strikes on Iran. The Nasdaq is rolling over with it. This is the crucial shift - for most of 2026 the US tape was the thing holding Korea up. Now the prop is wobbling.
The Fed piece matters too. A hotter-than-expected May payrolls print revived the prospect of a hawkish Fed - market-implied odds of a December rate hike jumped from roughly a quarter to over 40% in a matter of weeks - and high-multiple growth, which the Korean chip melt-up has become, is the most rate-sensitive asset class there is. A hot US CPI print does more damage to a richly-valued Korean index than to almost anything else.
The macro backdrop won’t rescue it
Could strong domestic fundamentals cushion the fall? Only partly. The Bank of Korea has held its policy rate at 2.5% since May 2025 and even nudged up its 2026 growth forecast to around 2%, leaning on the strength of the chip sector. Exports - led by semiconductors, shipbuilding and defense - have been genuinely robust. But notice the common thread: the macro strength is the chip strength. The same narrow engine driving the index is driving the economy’s good news. That’s not diversification, that’s correlation. If the global memory cycle is what’s being repriced, then the macro tailwind and the market tailwind weaken together, not separately. And the BOK now has to weigh a 17-year-low won and record household leverage against any urge to cut - which limits how much monetary help is coming if equities keep sliding.
Where this goes: my base case to year-end
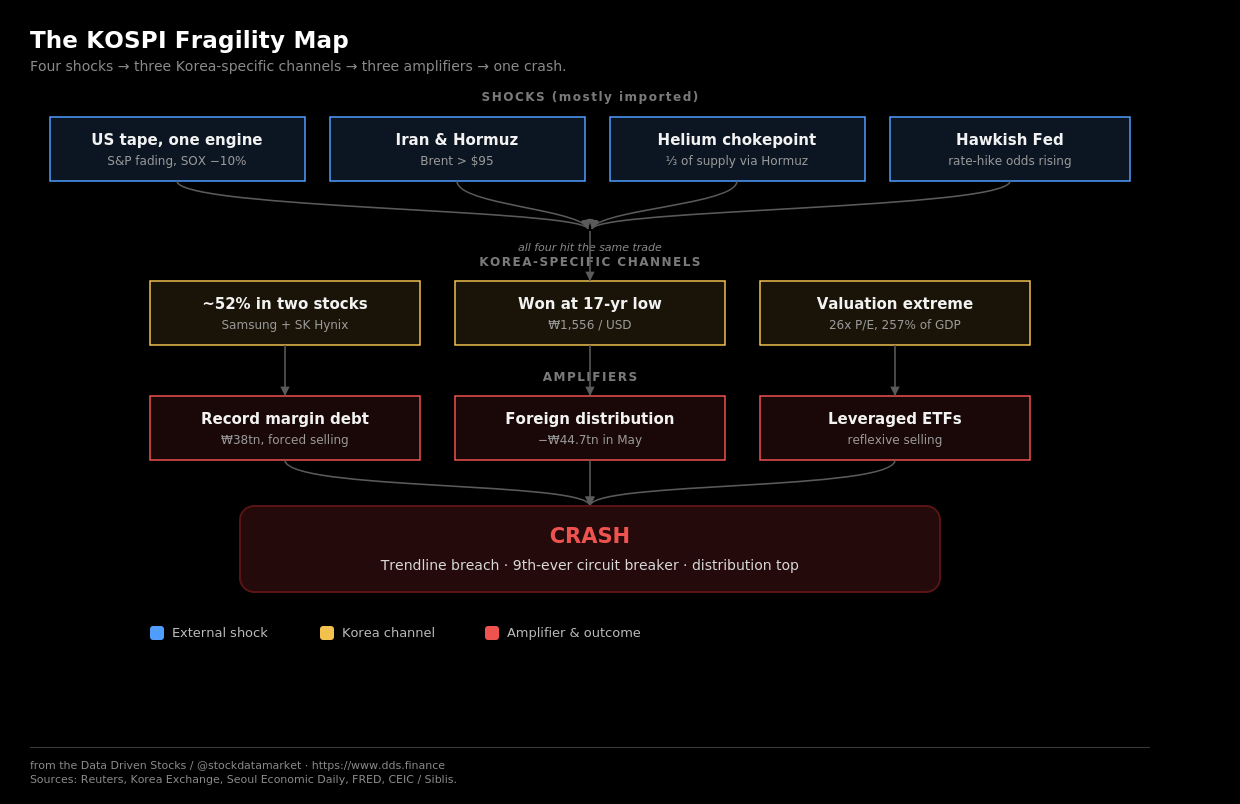
Putting it together - broken trendline, monthly RSI rolling over from a blow-off, half the index in two stocks, a stretched multiple, foreign distribution into record retail leverage, an oil shock, a helium tail risk, and a one-engine US tape - I land on a bearish base case for the rest of 2026.
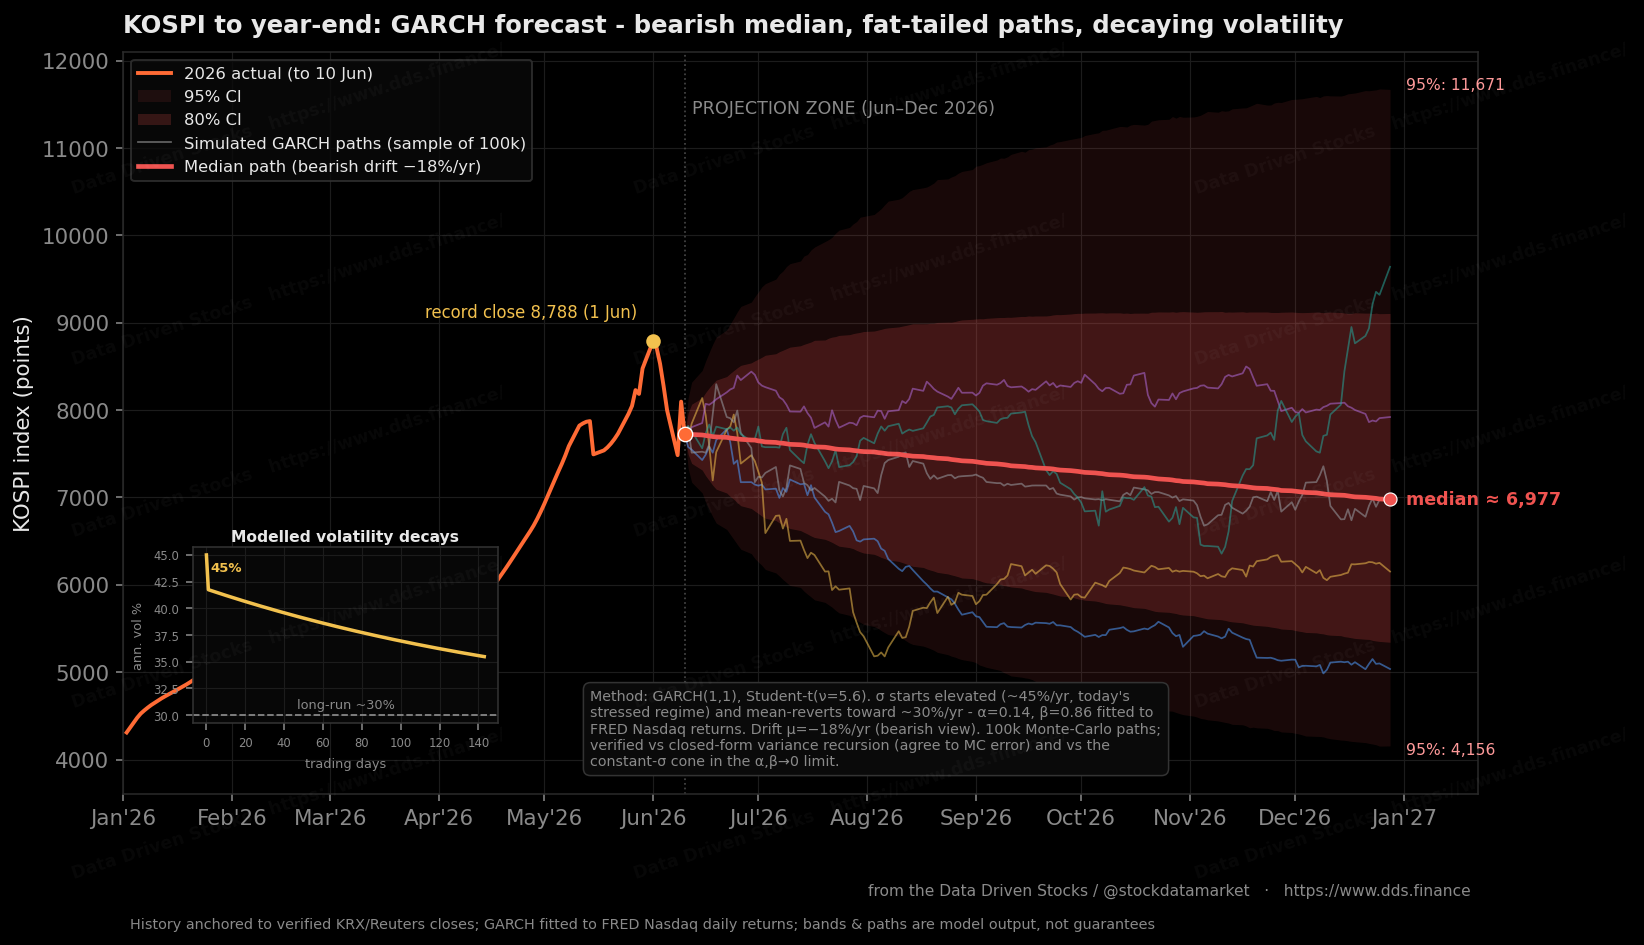
My central path is not a 1929-style collapse. It’s something more grinding and, frankly, more typical of a popped parabola: a series of failed rallies that lower the index toward the high-6,000s by December, as that overbought RSI works off its excess, margin balances shrink, and foreign sellers keep a lid on every bounce. The model’s median lands near 6,977 - roughly a fifth below the early-June peak. Painful, but well within the range of what overextended markets do after they break trend. And notice what the individual paths actually do: they don’t glide politely to the median. They lurch - sharp drops, violent snap-back rallies, the occasional path that runs straight back to the highs. That jaggedness is the GARCH model honestly reproducing how a stressed, high-volatility market really trades, rather than pretending the future arrives in a smooth line.
The honest part of any forecast is the width of the cone, and here it’s wide on purpose. The 95% confidence interval for year-end spans something like 4,160 to 11,670. That’s not me hedging - that’s the genuine statistical uncertainty of six months in an equity index that just printed an 8% day, with volatility only gradually cooling from a record. The fat lower tail is where the deep-correction risk lives: a disorderly de-leveraging toward the low-4,000s, roughly 40-50% off the peak, becomes a live outcome if the two geopolitical sparks catch - a real Hormuz disruption that hits both oil and helium, or a won that breaks decisively past its lows and turns foreign selling into a stampede. I don’t think that’s the most likely outcome, but with this much leverage and this much concentration, it sits inside the distribution, not outside it.
And yes, the upper tail is real too. If chip earnings re-accelerate, if Samsung clears its HBM qualification milestones, if Hormuz calms and the Fed blinks dovish, the same concentration that’s dragging the index can melt it back up past 9,000 - the 95% band reaches above 11,000 for a reason. Concentration cuts both ways. I just don’t think that’s where the center of the distribution sits right now. When a market this stretched loses its trendline while the smart money is selling and the borrowed money is buying, the drift points down, not up.
The bottom line
Korea had one of the great runs in modern market history (wow, monthly RSI of 94, dot-com bubble would be jealous !). Nothing here erases that. But great runs and durable foundations are not the same thing, and the KOSPI today is a fully valued, hyper-concentrated, heavily leveraged index that just broke its uptrend in the middle of a Middle-East war, with its core narrative - the chip cycle - under active question. The monthly chart says overbought-and-rolling. The flows say distribution. The structure says any wobble gets amplified.
So when you finish your coffee or your leftovers and the screens flicker on, watch the simple things: does the won steady, do Samsung and SK Hynix hold above their lows, does foreign selling slow. If those three turn, I’m wrong and Korea deleverages cleanly. If they break again, the base case takes over. Into December, I’m leaning lower.
Nothing here is investment advice. It’s data, context, and one analyst’s read of the probabilities. Do your own work, size your own risk, and never bet the rent on a single trade - especially one this crowded.
Sources
Korea Times - KOSPI plunges 8% to close at 7,484.41; circuit breaker and sidecar timeline. https://www.koreatimes.co.kr/amp/economy/others/20260608/kospi-plunges-8-on-concerns-over-end-of-chip-earnings-cycle-interest-rate-hike
Investing.com - KOSPI 52-week intraday range 2,877.07 to 8,933.62; live price 7,730.82, opened 7,899.77 on June 10. https://www.investing.com/indices/kospi
TradingEconomics - KOSPI -8.29% to 7,484 on June 8 (Samsung -10.18%, SK Hynix -7.25%); +8.18% to 8,097 on June 9; June 10 decline (Samsung -6.06%, SK Hynix -7.54%). https://tradingeconomics.com/south-korea/stock-market
Businesskorea - KOSPI falls below 7,500; won opens at 1,555.2; circuit-breaker mechanics. https://www.businesskorea.co.kr/news/articleView.html?idxno=270799
TradingKey - KOSPI closes at 7,730.82, down 4.52% on June 10; VKOSPI record; SOX -10.26%; Broadcom trigger. https://www.tradingkey.com/analysis/stocks/more/261951350-kospi-crash-circuit-breaker-samsung-sk-hynix-broadcom-guidance-fed-hikes-retail-leverage-krw-outflow-tradingkey
BBN Times - June 8 crash to 7,484.41, ninth-ever circuit breaker; USD/KRW near 1,547.80; ~50% index concentration. https://www.bbntimes.com/global-economy/south-korea-s-stock-market-today-kospi-crashes-8-29-to-7-484-triggers-circuit-breaker-as-chip-rout-fed-fears-and-iran-missiles-converge
HTX Insights - Samsung and SK Hynix each fell ~10%; two stocks >50% of market cap and ~70% of YTD gains; margin debt over ₩38 trillion. https://www.htx.com/news/south-koreas-kospi-plunges-837-at-opening-triggers-circuit-b-bqP9yVny/
BigGo Finance - record ₩36.47tn margin loans mid-May; Goldman 12-month KOSPI target lifted to 12,000; single-stock 2x leveraged ETFs. https://finance.biggo.com/news/Mp7Vop4BrAZSr0oSKF8Z
Euronews - Iran missile strike; KOSPI -8.3% to 7,484; Samsung -10%, SK Hynix -7.5%; regional market moves. https://www.euronews.com/business/2026/06/08/oil-prices-rise-as-iran-and-israel-trade-strikes-in-defiance-of-trump
OilPrice.com - Brent above $96 after Iran’s first direct strike on Israel since the April ceasefire. https://oilprice.com/Latest-Energy-News/World-News/Oil-Prices-Spike-After-Iran-Launches-Missile-Attack-on-Israel.html
Cryptobriefing - Brent ~$95.43 on June 8; Strait of Hormuz carries ~20% of world oil. https://cryptobriefing.com/oil-prices-surge-iran-missile-ceasefire/
Wikipedia (KOSPI) - all-time closing high 8,788.38 and intraday high on June 1, 2026. https://en.wikipedia.org/wiki/KOSPI
TradingEconomics - Bank of Korea holds policy rate at 2.5%; 2026 GDP forecast revised to ~2%. https://tradingeconomics.com/south-korea/interest-rate/news/528489
FRED, Federal Reserve Bank of St. Louis - DEXKOUS (KRW/USD spot), DCOILBRENTEU (Brent crude), VIXCLS (CBOE VIX). https://fred.stlouisfed.org/
Seoul Economic Daily - Korea’s Buffett indicator (KOSPI mcap ₩6,743tn / GDP ₩2,650tn) hit 256% on 6 May 2026, up from ~154% at the start of the year, exceeding the US (~226%); VKOSPI spiked to 60.07. https://en.sedaily.com/finance/2026/05/06/buffett-indicator-hits-256-percent-as-korea-stock-market
Siblis Research - KOSPI trailing P/E 17.06 and forward P/E 10.43 as of January 1, 2026. https://siblisresearch.com/data/kospi-korea-pe-earnings/
OECD via FRED - Share Prices for Korea, monthly index (SPASTT01KRM661N), used for the monthly RSI. https://fred.stlouisfed.org/series/SPASTT01KRM661N
Asia Business Daily - KOSPI 200 weights as of 13 May 2026: Samsung 28%, SK Hynix 23.5% (=51.5%), SK Square 2.64%, Hyundai 2.42%, LG Energy 1.7%. https://www.asiae.co.kr/en/article/market-overview/2026051410173951991
Seoul Economic Daily - Foreign net buying of ₩4.997tn on KOSPI in April 2026 after the March rout. https://en.sedaily.com/finance/2026/04/13/foreign-investors-return-to-kospi-adding-200-trillion-won
CEIC - KOSPI month-end weighted trailing P/E: 21.84 (Jan 2026), 26.04 (Feb 2026); all-time high 33.35 (Apr 2021). https://www.ceicdata.com/en/korea/korea-exchange-kospi-market-pe-ratio-weighted-month-end/pe-ratio-kospi-mth-end-weighted-total
World Bank - South Korea market capitalisation of listed domestic companies (% of GDP). https://data.worldbank.org/indicator/CM.MKT.LCAP.GD.ZS?locations=KR
CEIC - KRX-reported KOSPI trailing P/E and P/B series. https://www.ceicdata.com/en/indicator/korea/pe-ratio
CNBC - S&P 500 closes at 7,386.65 (−0.26%) on June 9, 2026, as chip rebound fizzles; SMH, Micron, Broadcom moves. https://www.cnbc.com/2026/06/08/stock-market-today-live-updates.html
Cryptobriefing - PHLX Semiconductor Index (SOX) −10.26% on June 5, worst day since March 2020, $1tn+ wiped; Nasdaq −4.18%, S&P −2.64%. https://cryptobriefing.com/phlx-semiconductor-index-plunges-worst-day/
TheStreet - S&P 500 and Nasdaq fall June 9 on renewed Iran-strike fears. https://www.thestreet.com/stock-market-today/stock-market-today-dow-jones-sp-500-nasdaq-updates-june-09-2026
Seoul Economic Daily - Foreign investors net sold a record ₩44.715tn on KOSPI in May 2026, topping the ₩35.7tn March record. https://en.sedaily.com/markets/2026/05/31/foreign-investors-dump-44-trillion-won-in-may-set-records
Seoul Economic Daily - Korea’s retail margin (credit-loan) balance hit a record ₩38.02tn as of 29 May 2026. https://en.sedaily.com/markets/2026/06/01/koreas-margin-loans-hit-record-38-trillion-won-as-kospi
Cryptobriefing - June 9 rebound: KOSPI +8.2% to 8,096.93; foreigners net sold ₩5.56tn on the day as retail bought the dip. https://cryptobriefing.com/kospi-rallies-retail-investors-margin-debt/
Seoul Economic Daily - KOSPI +24% in a month while 82% of 2,764 listed stocks fell; KRX SK Hynix index +77.17%, IT +46.91%, utilities −18.65%. https://en.sedaily.com/news/2026/05/29/kospi-surges-24-percent-but-82-percent-of-listed-stocks
Seoul Economic Daily - Samsung-Hynix combined market cap tops 50% of KOSPI for the first time; record day with 826 stocks falling. https://en.sedaily.com/news/2026/05/27/semiconductors-drive-kospi-record-as-9-of-10-stocks-decline
Data Driven Stocks - The S&P 500 Is at 7,400 and Running on One Engine. https://www.dds.finance/p/the-s-and-p-500-is-at-7400-and-running
Data Driven Stocks - The Invisible Gas That Could Kill the AI Chip Boom: Helium, Hormuz, and the 2026 Semiconductor Crisis. https://www.dds.finance/p/the-invisible-gas-that-could-kill