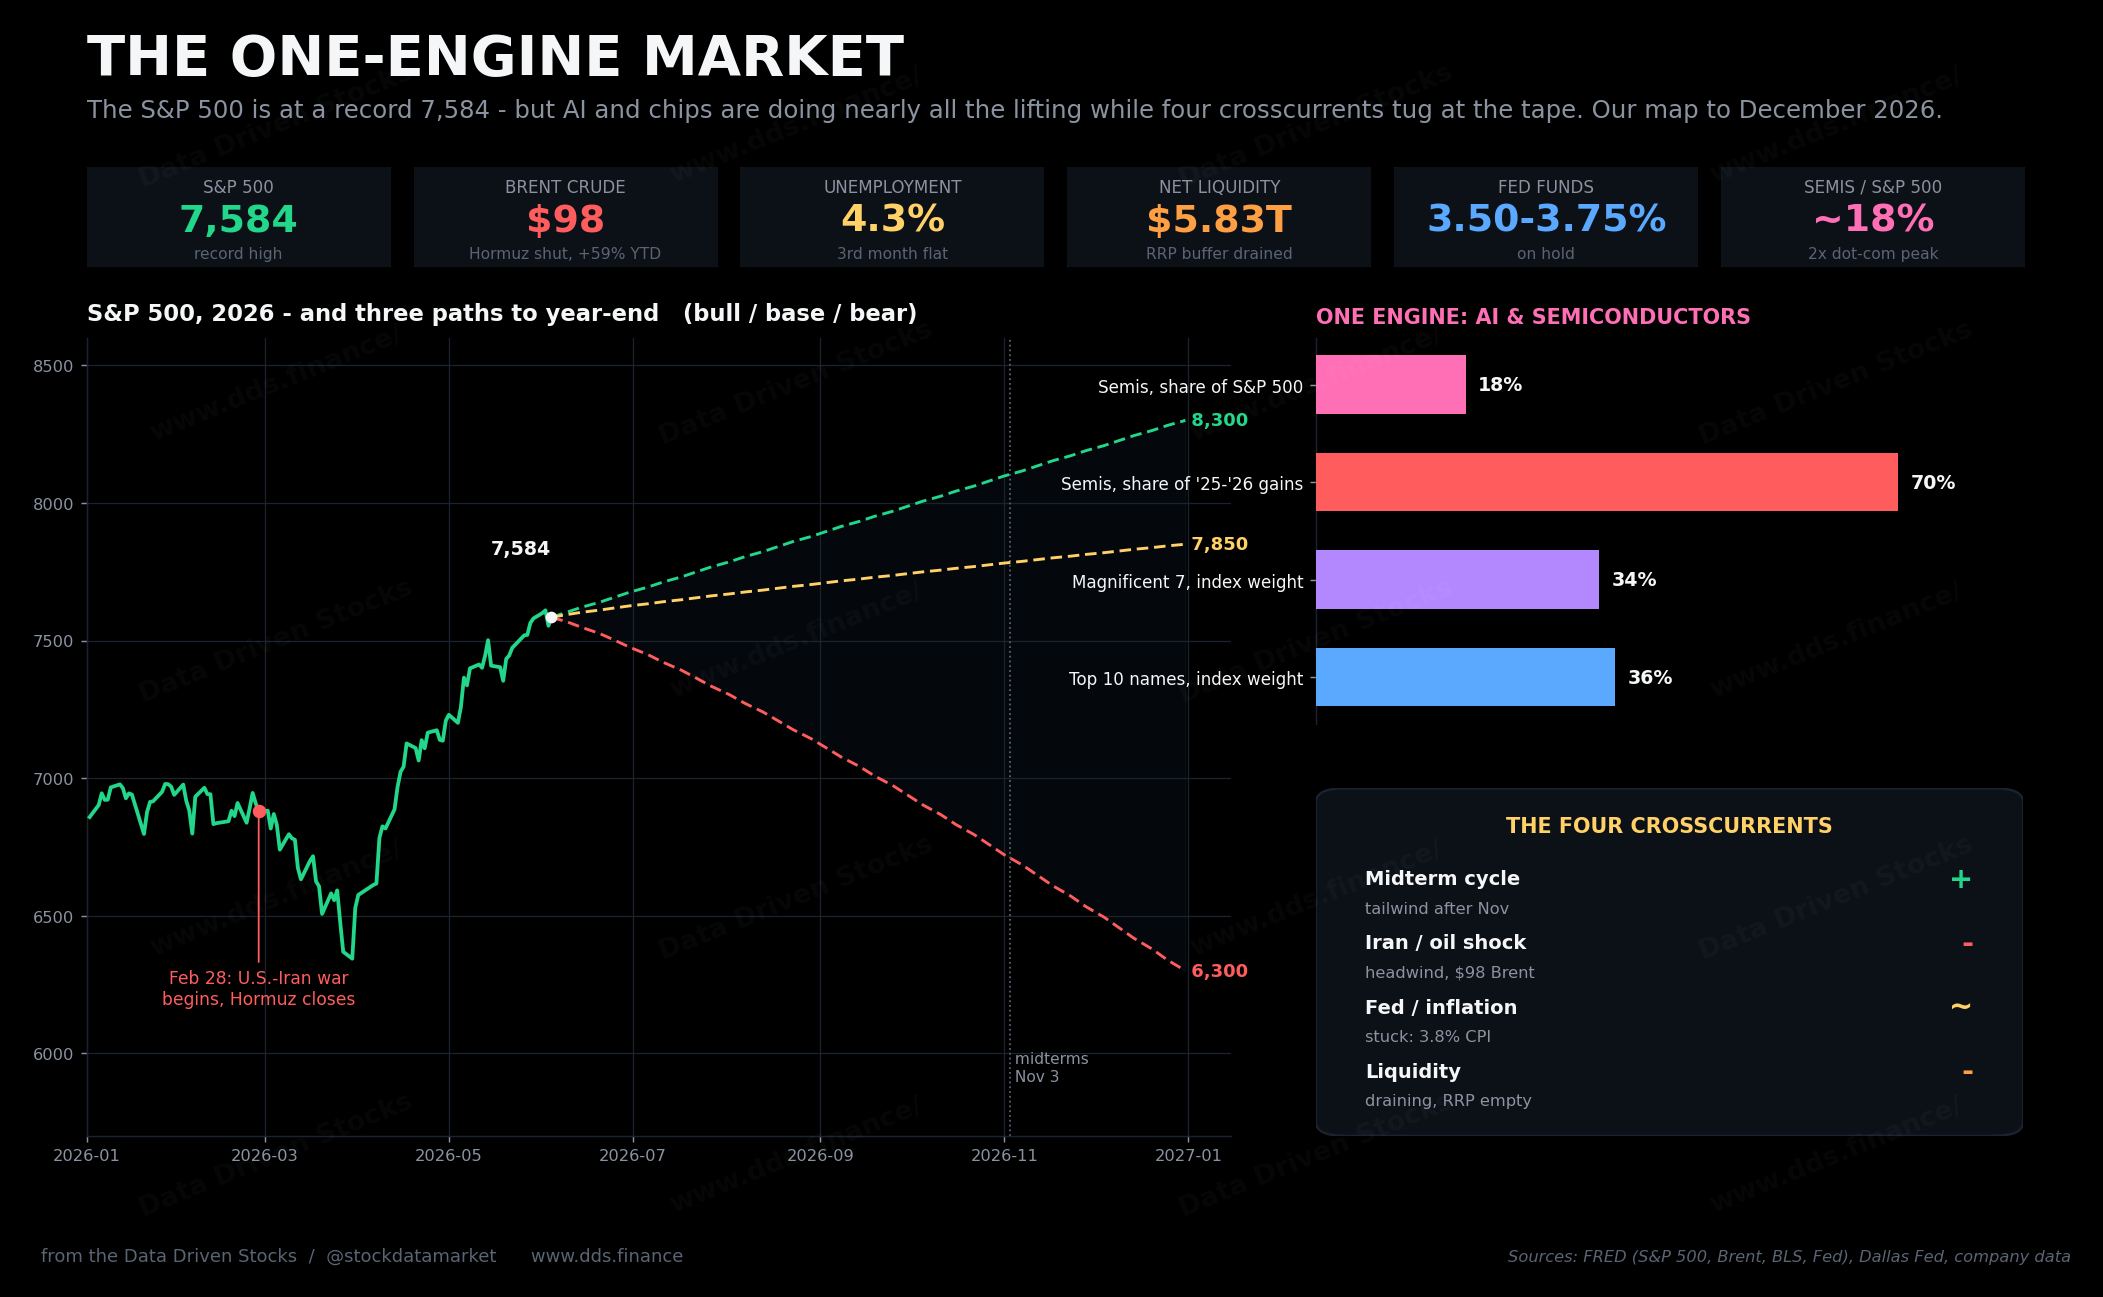
The S&P 500 Is at 7,400 and Running on One Engine. Here’s the Market Map to December 2026.
Midterms say buy the dip. Tehran says hedge it. The Fed says wait. And a single trade - AI and chips - is holding up the whole tape. Here’s how the next seven months actually break (or break apart).

By the time you read this, you’re probably waking up for the opening of the stock markets in Hong Kong, Tokyo, or Seoul. Or perhaps you’ve just come home from work and are once again eating a microwaved meal. But let’s come to the core of this article.
The number to keep in your head is 7,584. That’s where the S&P 500 closed on June 4, a fresh record, then went down in a sharp reversal Friday June 5 to 7384. The core of this article is not “next day prediction”, but how it will in the next 6-7 months.
So let’s rewind five months and the index opened the year just under 6,900, then got hammered down to around 6,350 by late March when the war shock hit - so this is a market that has clawed back roughly 20% off its spring low to print new highs, and only cleared 7,000 for good in mid-April. On the surface it looks like the calmest bull market in years. Underneath, it is anything but. The index is being pulled in four different directions at once, and it is being held up by essentially one thing.
So this is the question we’ve been chewing on all week: with the November midterms five months out, an actual shooting war with Iran keeping the Strait of Hormuz shut, oil back near $100, inflation creeping the wrong way, and the Federal Reserve frozen in place, where does the S&P 500 realistically finish 2026? We pulled the data, ran the history, and mapped it out. The short version is that the base case is still mildly higher - and the way it gets there is far more fragile than 7,584 makes it look.
Let’s take the forces one at a time, because each of them is pulling with a different amount of strength, and the whole point is how they net out.
The friendliest force: the midterm calendar
Start with the one piece of history that’s actually on the bulls’ side. Midterm years are the awkward middle child of the four-year presidential cycle - the weakest and most volatile leg of the four. But the pattern that shows up again and again is not that midterm years are good. It’s that they’re choppy and forgettable going into the November vote, and then strong once it’s behind us.
The numbers are hard to argue with. Going back to 1974, the 12 months after a midterm Election Day have been positive every single time - 13 for 13. The average one-year-after gain lands somewhere between roughly 12% and 19% depending on whose dataset and start date you use, against a near-flat run-up of something like 0% to 3% in the 12 months before the vote. The midterm year itself tends to carry the deepest intra-year drawdown of the cycle, on the order of 16% to 18% peak-to-trough, and the lows have historically clustered in late summer or early fall, right before the ballots. From that midterm-year trough, the market has rebounded by an average of better than 30% over the following year, and it has never been lower a year after a midterm-year low since 1950.

Here’s the honest caveat, and we’d be doing you a disservice to skip it. This is a tendency, not a law. The sample is tiny - we’re talking about a dozen or so observations - and when researchers strip out the macro shocks that happened to land in midterm years (the 1974 oil shock and recession, the 2002 tech crash, the 2022 inflation bust), the statistical “edge” mostly evaporates. The cleanest academic read is that midterms aren’t a magic seasonal switch. They’re a recurring moment when political uncertainty gets resolved, and what really decides the next 12 months is the macro regime around them - growth, inflation, real rates, and earnings. Which is exactly why the rest of this article matters more than the calendar.
One more wrinkle worth flagging: 2026 is the midterm year of a non-consecutive second term, so the tidiest historical comparison doesn’t strictly apply. Treat the seasonal tailwind as real but modest, and conditional on the macro not blowing up.
The jobs report nobody can read cleanly
The macro starts with the labor market, and the May print was a genuine puzzle. The economy added 172,000 nonfarm jobs, which blew past the roughly 85,000 the consensus was looking for. Sounds great. Except the strength was narrow and a little hollow. Private payrolls accounted for 120,000 of it, government for 52,000 - so roughly a third of the headline came from the public sector. The unemployment rate held at 4.3% for a third straight month, and the broader U-6 underemployment rate sat at 8.1%. Wage growth has been cooling, with average hourly earnings drifting up only modestly.

The phrase we keep coming back to is “the low-hire economy.” Job openings are still there, but actual hiring has slowed, which is why the labor market can post a beat on paper while still feeling frozen to anyone actually looking for work. For the market, the read-through is double-edged. It’s not weak enough to scream recession, which is good for earnings. But it’s soft enough that the Fed would normally be itching to cut - and that’s where the trouble starts, because the Fed can’t, and the reason is sitting in the Persian Gulf.
For more about hiring you can read
The plumbing is draining
Before we get to oil, look at what’s happening beneath the index, because it explains why this rally feels different from the ones that came before it.
For most of the past decade, US equities tracked Federal Reserve net liquidity - the cash the Fed’s balance sheet leaves sloshing around the system once you net out the Treasury’s cash pile and the overnight reverse-repo facility. When liquidity rose, stocks rose. The correlation through the quantitative-easing era ran around +0.84. That relationship has snapped. Since 2024 it has inverted to roughly -0.78. Net liquidity has been grinding lower, sitting near $5.83 trillion, and the reverse-repo buffer that used to cushion the system is effectively drained. Yet stocks have gone straight up anyway.

We want to be careful here, because liquidity is a coincident indicator, not a stopwatch. The point isn’t that this divergence times a top - it doesn’t, and broad-money flow is a weak predictor of forward returns on its own. The point is that it describes a late-cycle setup. The market has been climbing on momentum and a single narrative rather than on a rising tide of fresh money, and with the reverse-repo cushion gone there’s less of a shock absorber under the tape if something goes wrong. File that away. It matters most in the bear case.
Tehran holds the wild card
Now the thing that’s actually breaking the macro: the war. As of early June, the United States and Iran are in an active, on-again/off-again conflict that began on February 28 with a wave of strikes that killed Supreme Leader Ali Khamenei and much of Iran’s senior command. Iran’s response included closing the Strait of Hormuz (and possibly Bab-el-Mandeb in the near future), the single most important oil chokepoint on the planet. In normal times roughly 20 million barrels a day move through it - about a fifth of global petroleum consumption. Since late February that flow collapsed, Hormuz crude shipments fell close to 30% in the first quarter, and Brent ripped from the low $70s to a peak near $138 before settling back toward $98.
That $98 is doing a lot of work in this article, so let’s be precise about where it could go. The Dallas Fed modeled the scenarios. A full closure that removes around a fifth of global oil pushes crude up hard and knocks several points off quarterly GDP growth. A two-quarter closure pushes oil higher still, and a three-quarter closure peaks frighteningly high into the autumn. Translate those into Brent and you get a fan that runs from a de-escalation path back toward $71 - Goldman’s call if the strait reopens - up through a contested-strait status quo near $96, and on to a sustained-closure path of $137 and beyond.

There’s a political angle that makes this even more relevant to where stocks finish the year. The president’s party already faces a structural headwind in the midterms, amplified by an approval rating stuck below 40%. The cleanest, lowest-cost way for Tehran to apply pressure during the campaign isn’t a cyberattack - it’s simply keeping oil expensive into the fall, which feeds straight into gasoline prices and the cost of living right as voters head to the polls. US retail gasoline has already been hovering around $4.30 to $4.50 a gallon. The energy channel, not the keyboard, is the real election-year risk, and it’s the same channel that lands directly on inflation.
More about straits:
Furthermore, there are other factors like Helium for semiconductors coming from Qatar through Strait of Hormuz.
The Fed’s box
Which brings us to the most underappreciated constraint on the whole picture. The oil shock has shoved inflation back the wrong way. Headline CPI is running near 3.8% year over year, and the Fed’s preferred PCE gauge is close behind at roughly 3.8% as well. Core measures are cooler - core CPI around 2.7%, core PCE near 3.3% - which tells you the re-acceleration is being driven by energy rather than by broad underlying price pressure. But the Fed sets policy on the headline reality voters feel, and right now that reality is moving away from the 2% target, not toward it.

So here’s the box. The Fed cut through 2025 down to a target range of 3.50% to 3.75%, then stopped. The labor market - softening, low-hire, cooling wages - is begging for more cuts. The inflation data - re-accelerating on oil - is telling the Fed to sit on its hands. When those two signals conflict, the central bank waits, and “higher for longer” is the most expensive backdrop a richly-valued equity market can have, because it caps how far the multiple can stretch. The path of least resistance from here is at most one more cut late in the year, and even that gets harder every time Brent ticks up. Strip away the soft-landing optimism and the Fed’s job in 2026 is to manage a mild case of stagflation: sticky headline inflation sitting on top of a labor market that’s losing momentum.
One engine
Here’s the part that ties the whole thing together, and it’s the part we’d put in bold if we used bold. Everything you just read - the seasonal tailwind, the soft jobs, the draining liquidity, the oil shock, the boxed-in Fed - is happening to a market that has come to depend on a single trade.
The 2025-2026 rally is, at its core, an AI and semiconductor story. Semiconductors now make up roughly 18% of the entire S&P 500. A decade ago that figure was 2%, and 18% is more than double what the sector reached at the dot-com peak. By the count that gets cited most, chips and the broader AI complex have driven something like 70% of the index’s gains over this run. The Magnificent Seven - the mega-cap names anchored in AI - are about a third of the index’s total market value, and they produced roughly 42% of its return in 2025. Nvidia alone carries an index weight near 7.7%, larger than the entire energy or utilities sectors. The top 10 names are around 36% of the index and the top 20 are about half of it.

Stack the valuation extremes on top of that concentration and you understand the sensitivity. The Shiller cyclically-adjusted P/E is up around 42, against a long-run average closer to 16, and the market-cap-to-GDP “Buffett indicator” is near 237% - both echoes of dot-com-era readings. Meanwhile breadth is thin: only about half of S&P 500 stocks are trading above their key technical levels even with the index at all-time highs, and the equal-weight version of the index has been badly lagging the cap-weighted one. That gap is the whole story. When a handful of very large stocks are carrying everything, the index can keep grinding higher even as the median stock goes nowhere.
The reason this matters for a year-end forecast is simple. The same concentration that has been the market’s greatest strength is also its single largest point of failure. As long as chip earnings keep beating and the AI-capex narrative holds, those mega-caps can pull the whole index up regardless of what the median stock does. But if that narrative wobbles - a capex air-pocket, one big guidance miss, an export-control shock, any crack in the conviction that the spending translates into earnings - it hits the 18% of the index doing all the work, and there is no broad market underneath to absorb it. That’s not a tail risk you can diversify around inside the index, because the index is the trade. If the engine stutters, the market doesn’t just slow. It reprices, and it reprices harder than a normal correction because the cushion underneath was never built.
Putting it together
So we have five forces. The midterm calendar leans bullish, especially after the vote. The AI and chip engine is the swing factor that can go either way and dominates everything. And three forces - the oil shock, the boxed-in Fed, and the draining liquidity - lean against the market, with oil being the one most capable of turning a slow drift into a fast break. Here’s how they feed into the index and resolve into outcomes.

The road through the midterms, month by month
Here’s where we want to get more granular, because “up 3.5% by year-end” hides the single most important thing about 2026: the base case is almost certainly not a straight line. If history is any guide, the path is a correction into a late-summer-or-October low that bottoms around the vote, followed by a relief rally into December. The destination is mildly higher. The journey runs through a drawdown first.
Literally the most important chart here.

Walk it forward with us. Right now, in June, the index is sitting near its highs at 7,584 with the calendar working against it. The stretch from May through October is the market’s “worst six months” in any year, and in a midterm year specifically that window has historically run slightly negative rather than its usual mild gain. Layer the live drivers on top of the seasonal headwind and you can see the air start to come out over the summer. Oil near $100 keeps gasoline elevated and inflation sticky, the Fed stays parked, liquidity keeps draining, and the AI trade has to keep clearing a higher and higher bar just to hold the tape flat. None of that is a crash catalyst on its own. It’s a slow grind lower, and our path has the index easing from the mid-7,500s in June toward the low-7,000s by the end of August.
September and October are where the historical pattern gets loud. Midterm-year lows cluster in late summer and early fall, and in 22 of the last 23 cycles the low arrived before the election rather than after it. The mechanism is simple enough: markets hate unresolved uncertainty, and an election is a giant unresolved question that doesn’t clear until the votes are counted. Add a contested war, an oil price that voters feel at the pump, and a Fed that can’t ride to the rescue, and the late-summer drift turns into a genuine pullback. Our base case puts the low around 6,800 in October, a drop of roughly 10% from today. That is deliberately milder than the historical average midterm drawdown of 16% to 20%, and the reason we’re projecting a shallower one is the earnings engine: as long as the chips keep delivering, the mega-caps put a floor under the index that prior midterm cycles didn’t have. Take that floor away and you don’t get our 10% dip, you get the full historical drawdown, which is exactly the bear deviation drawn on the chart.
Then comes the part the bulls are counting on. The week of the vote tends to be the turn. Once the result is known and the uncertainty clears, the relief rally has historically been reliable and fast. From an October low into year-end, the S&P has risen something like 10% on average and has been positive 18 times out of 18 in the post-war record. Our path has the index bottoming around the November 3 vote near 6,800 to 6,900, then ripping back through November and December to finish near 7,850 - a relief rally of roughly 15% off the low. That is a bigger bounce than the 10% historical average, but deeper drops have historically produced bigger rebounds, and a market this leveraged to a single re-acceleration trade tends to snap back hard once the overhang lifts.
So the shape matters as much as the number. If you only remember the 7,850 year-end target, you’ll be unprepared for a 10% drawdown that, in the moment, will feel like the start of something much worse. And if you only remember the drawdown, you’ll miss the relief rally that has historically followed it. The base case is both: get through the correction, and the December bounce is what gets you to a mildly green year. The whole thing hinges, again, on the engine. The dip is a buyable correction only if AI earnings hold through it. If they don’t, the October low isn’t a floor, it’s a trapdoor.
Three roads to New Year’s Eve
Now the projection. We’re framing this as three scenarios with rough probabilities rather than a single point, because anyone giving you one precise number for a market this dependent on a war and a single trade is selling certainty that doesn’t exist. We’re starting from 7,584 and mapping to December 31.
Our base case, and where we’d put the highest odds at around 45%, is a messy stalemate that ends near 7,850, a gain of roughly 3.5% - but, as the roadmap above shows, it gets there the hard way, through a correction into an October low near 6,800 and a relief rally out the other side. In this world the strait stays contested and oil sticks near $95 to $100, headline inflation hovers in the high-3s, and the Fed delivers one late cut at most. The index chops lower into the vote, then the post-midterm seasonal tailwind delivers the bounce, and AI earnings hold up just enough to keep the engine running. That lands right around the Wall Street strategist median, which currently sits near 7,800. The important thing about the base case is that the 3.5% headline gain badly understates how bumpy the ride would be to get there.
The bull case, at around 30%, gets you to roughly 8,300, a gain near 9%, and it’s a clean version of the same setup. Hormuz reopens or oil drifts back toward the $70s, headline inflation falls, the Fed resumes cutting, chip and hyperscaler earnings keep beating, breadth finally broadens out beyond the mega-caps, and the seasonal tailwind does its thing. This is the world the most bullish desks are pricing, the one where targets cluster between 8,000 and 8,250.
The bear case is the one we want you to take seriously, because it’s both the most underpriced and the most internally consistent, and we’d put it at around 25% (though with a high downward variance). This is the reprice. A crack in the AI and chip trade hits the 18% of the index doing all the work, and with breadth this thin there’s nothing to catch it. Pair that with an oil spike toward $130-plus as the strait situation deteriorates, and inflation that pins the Fed in place, and the classic midterm-year drawdown of 16% to 20% arrives all at once rather than gently. That math takes you down toward 6,300. The reason the bear path is so much steeper than the bull path is upside is the entire thesis of this piece: the market is leveraged to a single trade, and when that’s true, the downside is always more violent than the upside is generous.

The bottom line
If you want the whole thing in a paragraph: the S&P 500 at 7,400 is priced for a nearterm correction in what is currently a hard-landing world. The historical midterm tailwind is real but modest and conditional, the jobs market is soft enough to need help the Fed can’t give, liquidity is draining quietly in the background, and an active war is keeping oil high enough to keep inflation - and the Fed - exactly where neither the market nor the incumbent party wants them. Holding all of that up is a single AI-and-chip trade carrying 70% of the gains and trading at dot-com valuations on dot-com breadth.
Our base case is still flat into year-end (after the mid-term dip), because the post-midterm seasonal and the earnings engine probably will still hold. But the distribution is skewed, and it’s skewed down. The thing to watch isn’t the election and it isn’t even the Fed. It’s whether the engine keeps running and AI won’t turn into a dot-com style blow-up the top. As long as the chips deliver, the index can absorb a lot of bad news. Though there is a lot of “buts”, like the problem with the helium. Then the day chips don’t deliver, none of the other four forces will be able to catch it. And the market will enter a bear market.
We’ll be tracking all five of these.
Not a financial advice
Sources
S&P 500, NASDAQ Composite, and net-liquidity components (Fed total assets, Treasury General Account, overnight reverse repo), Federal Reserve Economic Data (FRED), Federal Reserve Bank of St. Louis: https://fred.stlouisfed.org/series/SP500 ; https://fred.stlouisfed.org/series/NASDAQCOM ; https://fred.stlouisfed.org/series/WALCL ; https://fred.stlouisfed.org/series/WTREGEN ; https://fred.stlouisfed.org/series/RRPONTSYD
US employment data (nonfarm payrolls, private and government payrolls, unemployment rate, U-6 underemployment, average hourly earnings), Bureau of Labor Statistics via FRED: https://fred.stlouisfed.org/series/PAYEMS ; https://fred.stlouisfed.org/series/UNRATE ; https://fred.stlouisfed.org/series/U6RATE
Oil and gasoline prices (Brent, WTI, US regular retail gasoline), FRED: https://fred.stlouisfed.org/series/DCOILBRENTEU ; https://fred.stlouisfed.org/series/DCOILWTICO ; https://fred.stlouisfed.org/series/GASREGW
Inflation and Fed policy (CPI, core CPI, PCE, core PCE price indices; federal funds target range), FRED: https://fred.stlouisfed.org/series/CPIAUCSL ; https://fred.stlouisfed.org/series/PCEPI ; https://fred.stlouisfed.org/series/DFEDTARU
Strait of Hormuz oil-flow volumes and chokepoint dependence, US Energy Information Administration: https://www.eia.gov/todayinenergy/detail.php?id=61002
Oil-shock macro scenarios, Federal Reserve Bank of Dallas, “What the closure of the Strait of Hormuz means for the global economy” and working paper WP2609: https://www.dallasfed.org/research/economics/2026/0320 ; https://www.dallasfed.org/~/media/documents/research/papers/2026/wp2609.pdf
IAEA verification status in Iran (stockpile and inspector access), International Atomic Energy Agency: https://www.iaea.org/topics/monitoring-and-verification-in-iran
US-Iran conflict background and the Strait of Hormuz, UK House of Commons Library: https://commonslibrary.parliament.uk/research-briefings/cbp-10521/ ; https://commonslibrary.parliament.uk/research-briefings/cbp-10636/
Midterm market history and the four-year presidential cycle, U.S. Bank and RBC Capital Markets summaries; Capital Group 2026 midterm note: https://www.usbank.com/investing/financial-perspectives/market-news/how-presidential-elections-affect-the-stock-market.html ; https://www.capitalgroup.com/individual/insights/articles/how-elections-move-markets.html
Midterm-year drawdown depth, autumn-low timing, and post-low rebound statistics, Carson Group (Ryan Detrick) and LPL Research: https://www.carsongroup.com/insights/blog/why-stocks-could-do-just-fine-the-rest-of-this-year/
The midterm-effect academic debate, Anderson, Bialkowski and Wagner, and Chan and Marsh: https://repec.canterbury.ac.nz/cbt/econwp/2305.pdf ; https://ideas.repec.org/a/eee/jfinec/v141y2021i1p276-296.html
S&P 500 concentration and the Magnificent Seven (index weights, share of returns), Visual Capitalist, First Trust Advisors, and InvestmentNews: https://www.visualcapitalist.com/magnificent-seven-stock-returns-in-2025/ ; https://www.investmentnews.com/equities/mag-7-for-tomorrow/264753
Semiconductor share of the S&P 500 and breadth, 24/7 Wall St. (NewEdge Wealth) and FXCM: https://247wallst.com/investing/2026/05/18/semiconductor-exposure-in-sp-500-hits-18-thats-more-than-double-the-tech-bubble-peak/
Wall Street year-end 2026 S&P 500 targets, Yahoo Finance, TheStreet, and Reuters compilations: https://finance.yahoo.com/news/wall-streets-2026-forecasts-are-rolling-in--and-some-see-the-sp-500-hitting-8000-110002501.html ; https://finance.yahoo.com/markets/stocks/articles/citi-quietly-resets-p-500-210300000.html
Valuation extremes (Shiller CAPE, Buffett indicator), multpl: https://www.multpl.com/shiller-pe


