

How to Actually Trade the VIX: Futures, Options, and the ETFs That Bleed to Zero
Part 2 of the fear-gauge series. Everyone sees the VIX on CNBC, then tries to “buy VIX” like it’s Apple. Here is what actually happens when you do.

!! PS. Article is long - so it will be cut in your e-mail !!
The VIX is doing what it always does. It sits quiet for weeks, then jumps out of its chair the one morning you were not watching.
In Part 1 we took the gauge apart and looked at what it measures. Short version: the VIX is a single number backed out of S&P 500 option prices, and it tells you how big a move the market expects over the next 30 days. Not the direction. Just the size of the ride. If you missed it, start there, because this piece assumes you already know what the number means: The VIX: When Wall Street Starts Sweating (Part 1).
The VIX: When Wall Street Starts Sweating - Part 1 (The “Fear Gauge,” Decoded for Humans - Upgraded version)

The wildest stock markes moves are either when VIX is super high or is super low. That’s why you should deeply understand what is VIX and how to use it to your advantage. But it may take years to ful…
This is the part almost every explainer skips. Reading the gauge is one skill. Trading it is a completely different one, and it is where most people quietly lose money. So before we get into the how, look at what happens if you get the how wrong.
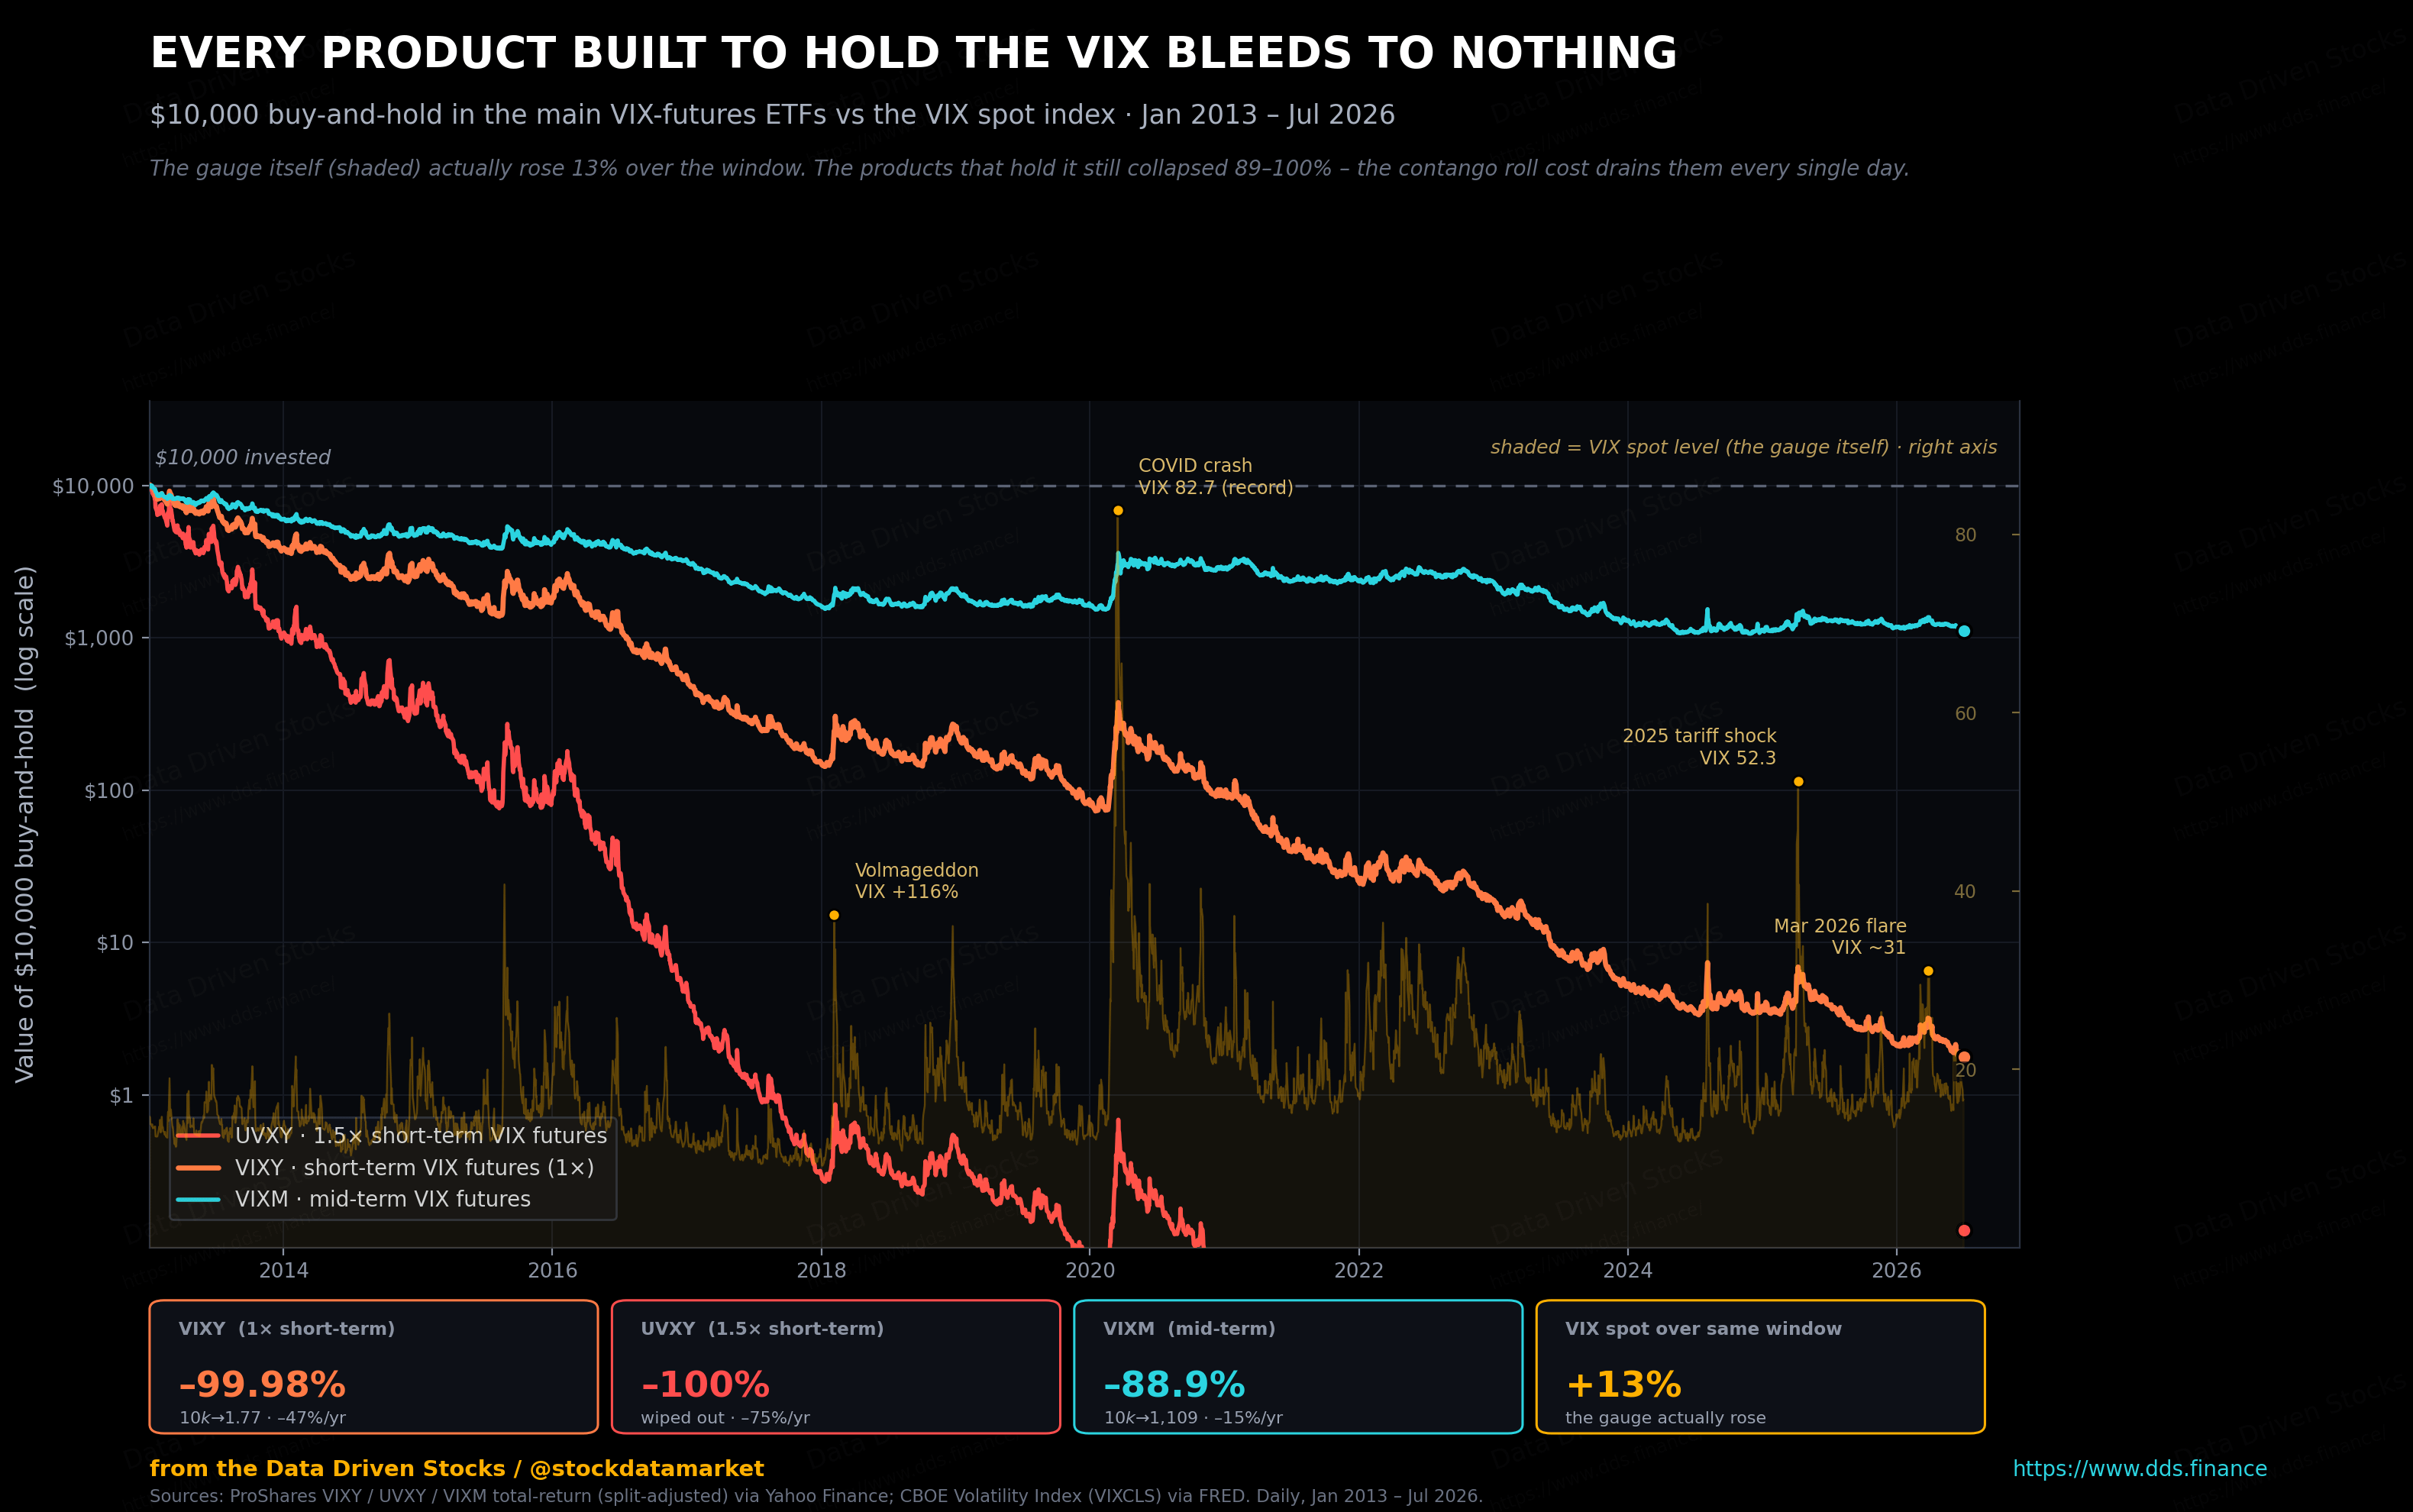
That chart is the whole warning label. Now let us walk through why it happens, one instrument at a time, so you know which of these tools does what before you touch any of them.
1. You can’t buy the speedometer
Here is the first thing that trips people up. The VIX is an index. It is a calculation, refreshed in real time from the prices of options on the S&P 500. There is no share of “VIX” sitting on an exchange, no certificate to take delivery of. Even the companies that run the big volatility funds print it in plain English in their own documents: the VIX is not directly investable.
So when someone says they are “trading the VIX,” they are really trading something else that is wired to it. There are four main wrappers, and each one behaves a little differently.
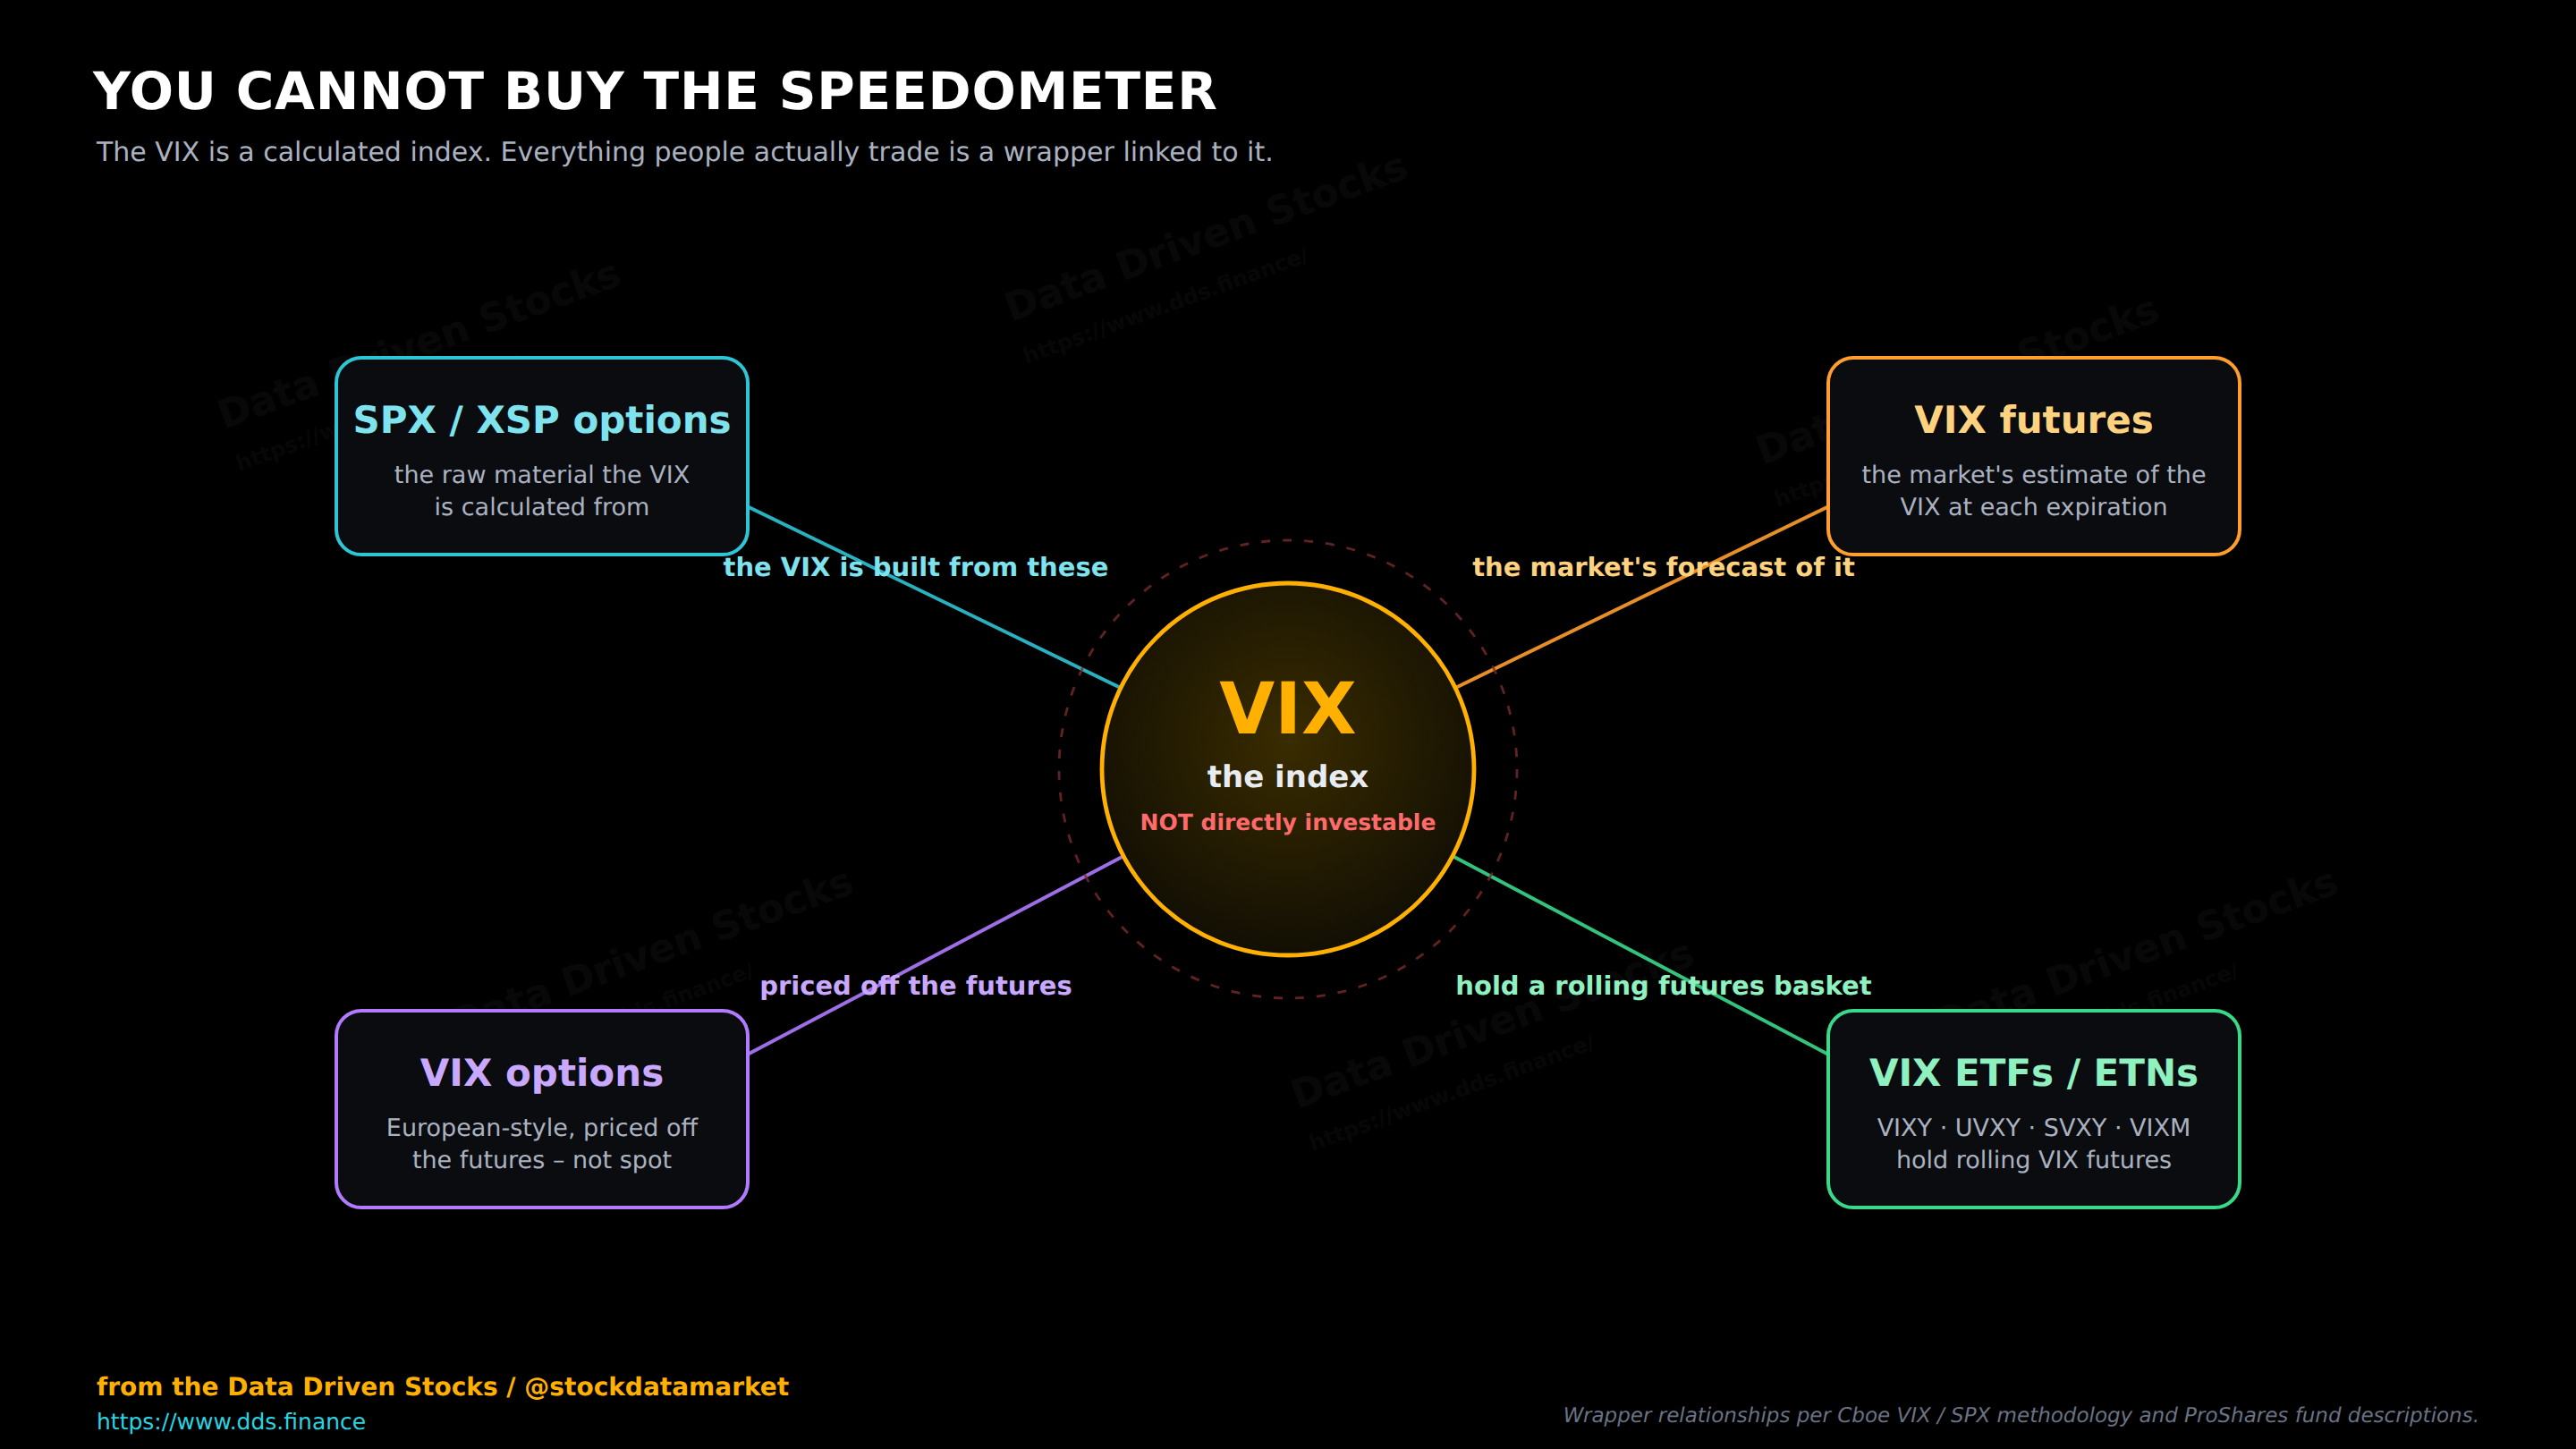
The futures are the market’s best guess of where the VIX will be on a specific future date. The options are options on that guess, not on the number itself. The ETFs and ETNs, the tickers you have seen memed to death like VIXY, UVXY, SVXY and VIXM, hold a rotating pile of those futures. And the SPX options are the raw material the whole gauge is built from, which makes them the closest thing to trading the calculation at the source.
Notice what that means. Every path to “the VIX” runs through the futures. So if you want to understand any of these products, you have to understand the futures first.
2. VIX futures: renting fear by the month
A VIX future is a simple idea with a sneaky twist. It is the market pricing where it thinks the VIX will settle on the contract’s expiration date. The exchange says it about as plainly as an exchange ever says anything: VIX futures reflect the market’s estimate of the VIX on various future dates.
The twist is that futures do not follow spot VIX tick for tick. They converge to it. On expiration day the future and the settlement value meet. Before that, the future is free to sit above or below today’s spot, because it is pricing a different moment in time. Spot VIX is what protection costs right now. The future is what protection might cost then. Those are related, but they are not the same number, and the gap between them is where most VIX confusion is born.
The shape of that gap has a name, and it decides almost everything about how these products perform.
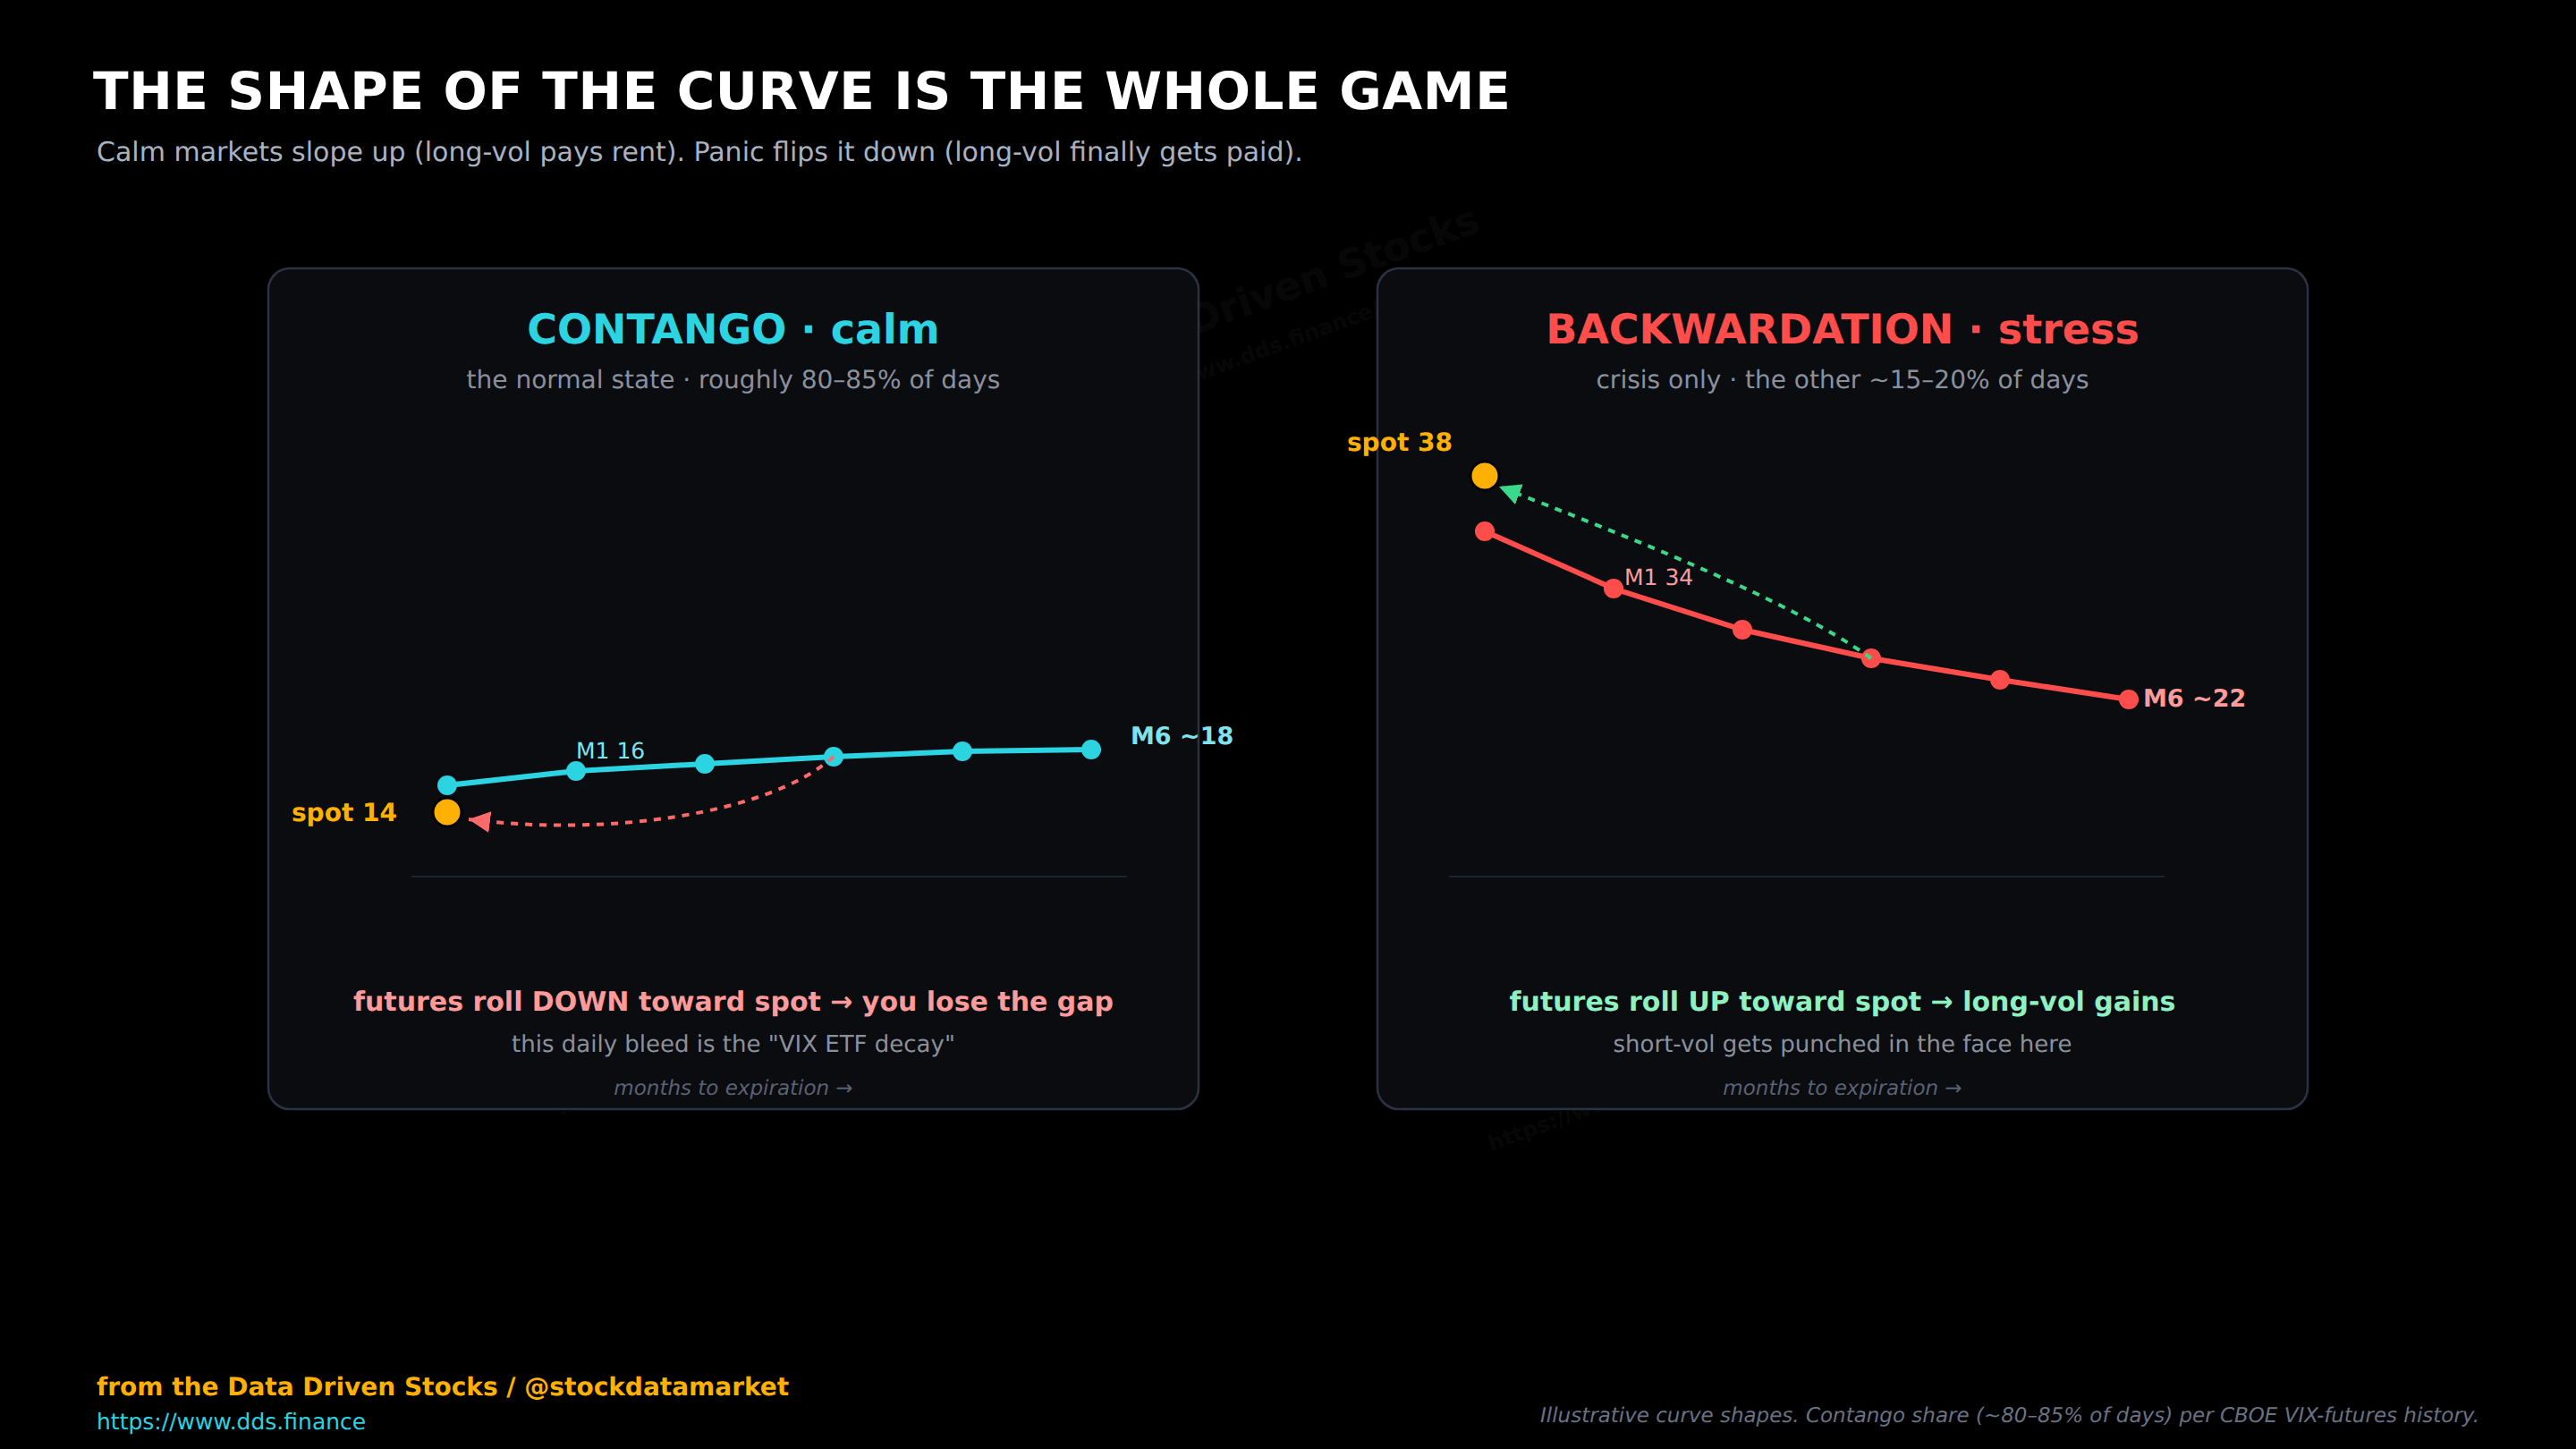
For most of history the curve slopes gently upward. By one clean measure, the VIX has closed below its own three-month version about 92 percent of trading days since 2016. The actual front-month futures curve slopes up a little less often than that, on the order of 80 to 85 percent of days, but the takeaway is the same. Upward-sloping is the default. Panic is the exception.
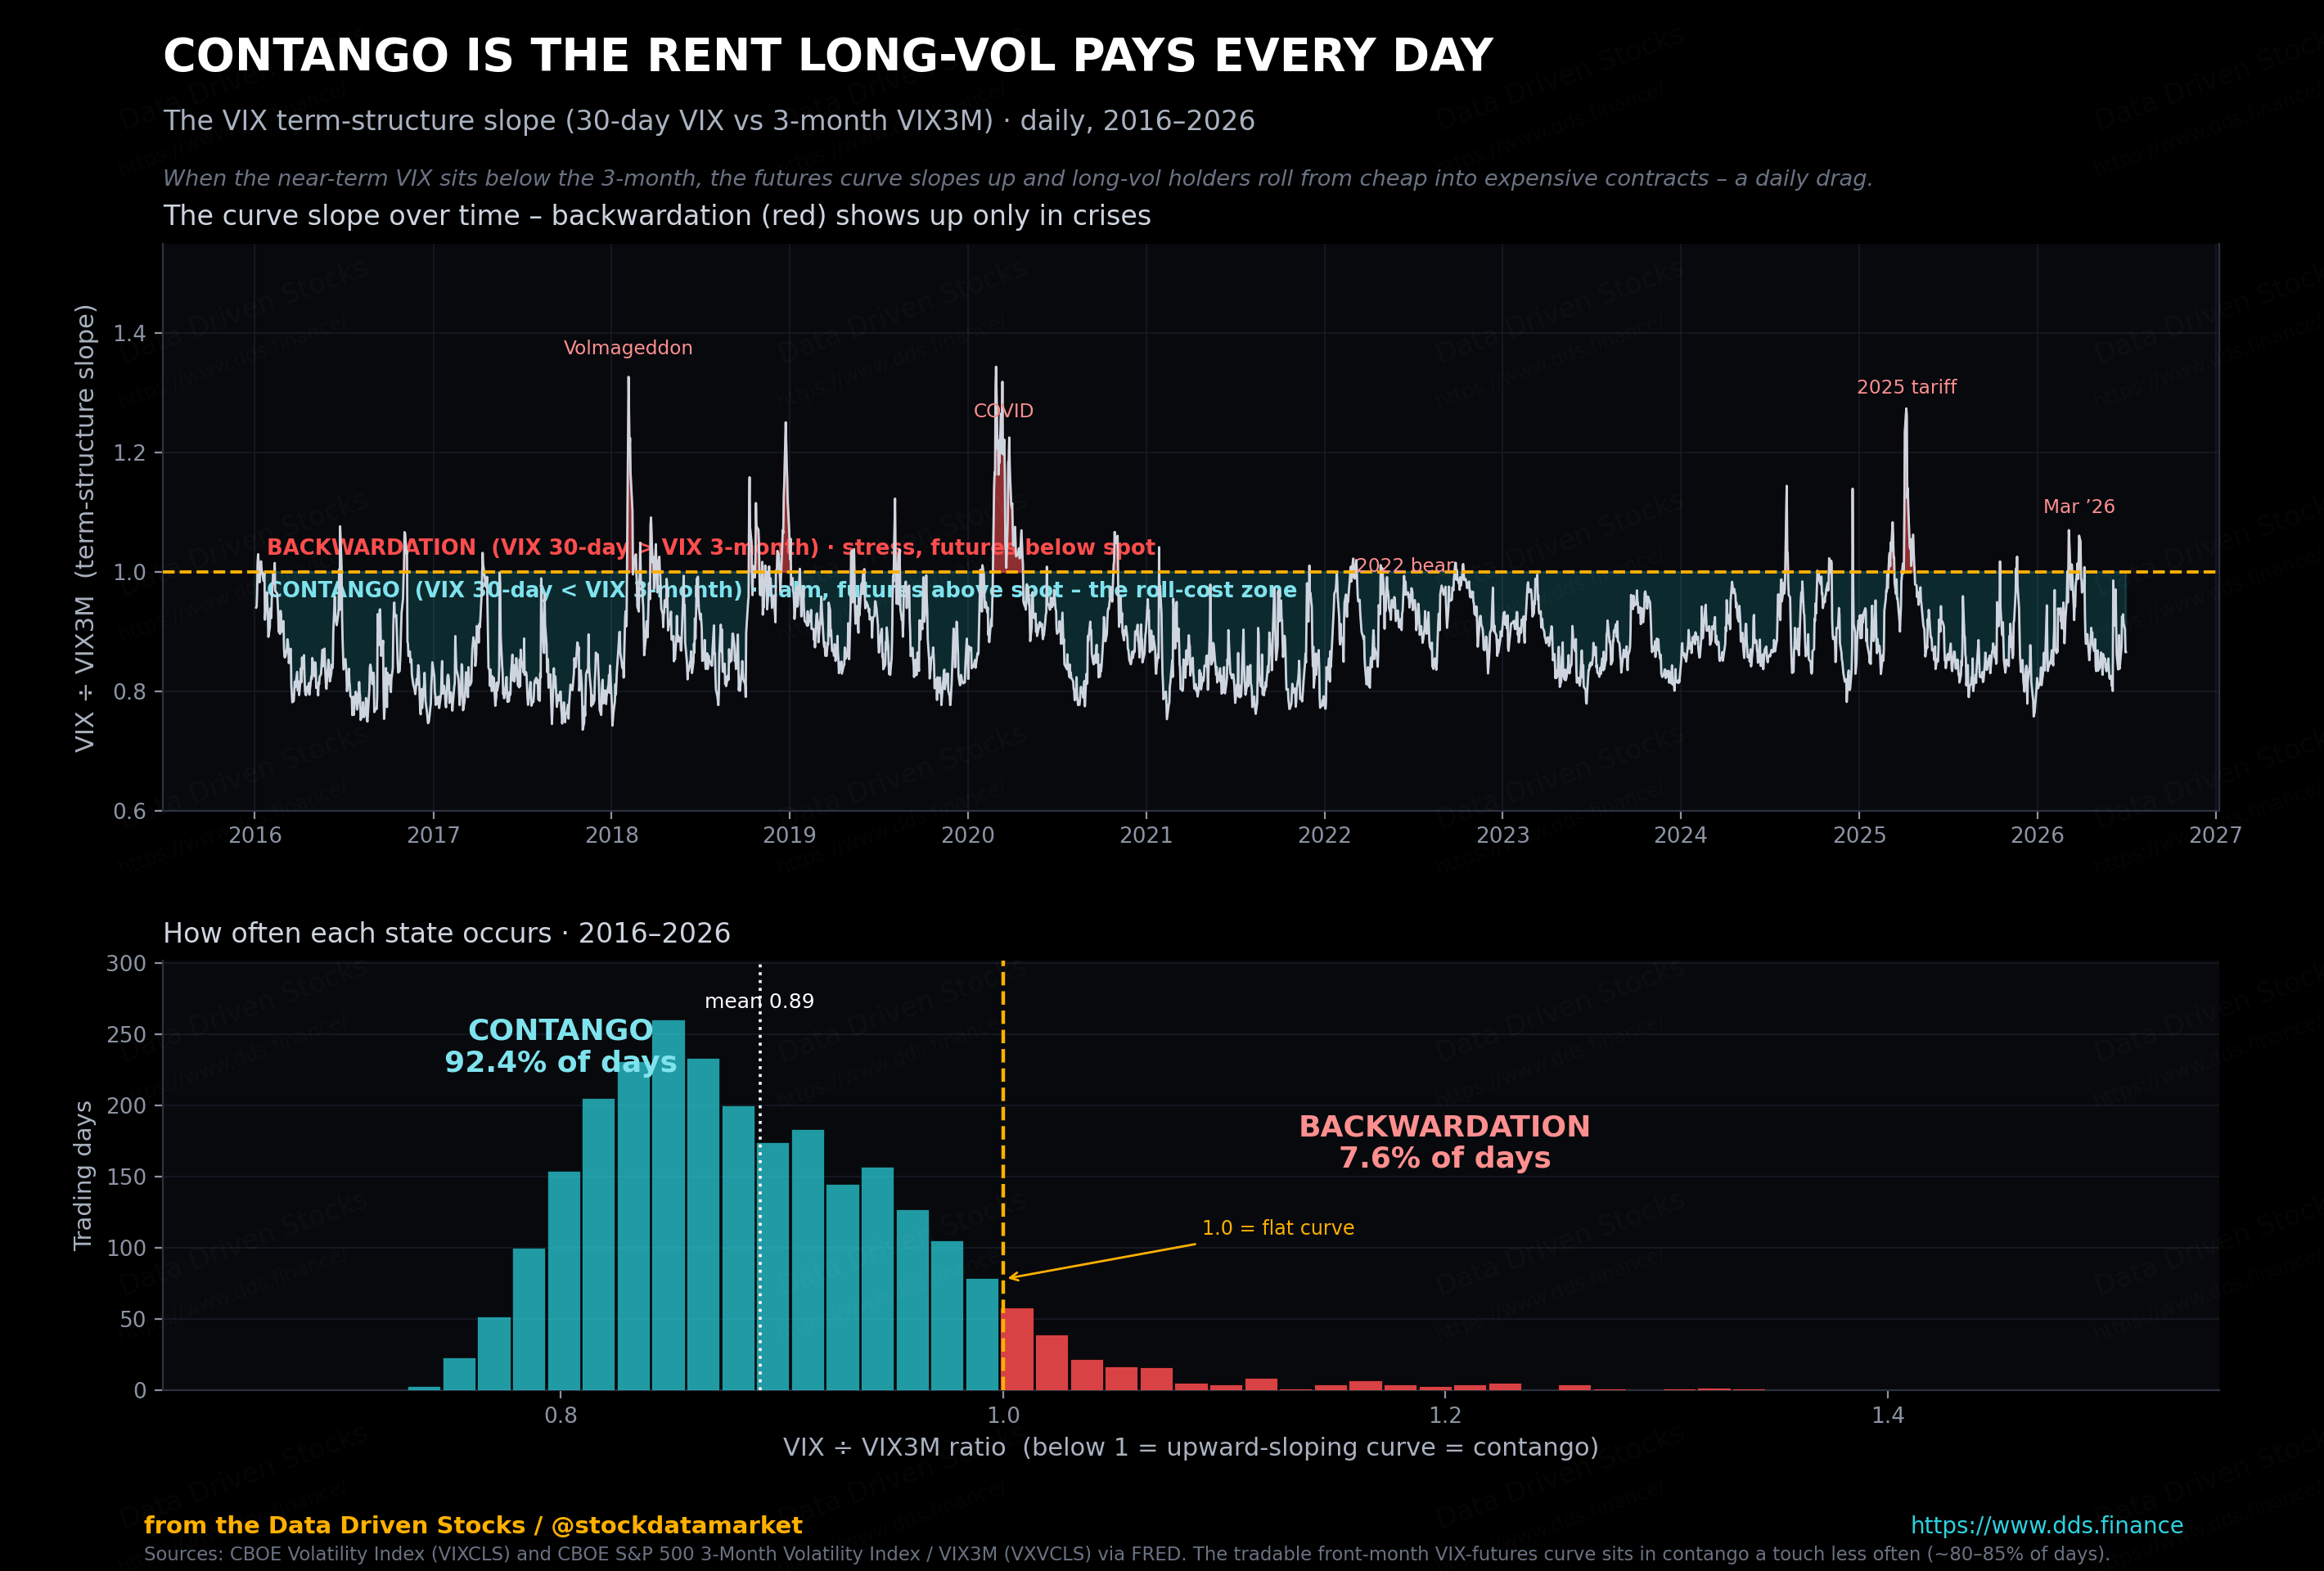
Why does the curve usually slope up? Two reasons, and neither is a mistake. Volatility tends to revert toward its long-run average, so when spot is low the market prices it drifting back up. And option sellers charge a premium for taking on risk, the same way an insurer charges more than the average claim. Both effects push the futures above a quiet spot. That premium is not a glitch. It is the rent you pay to hold volatility, and it never stops running.
Now for the part that catches people who thought they had it figured out. These contracts do not settle like a stock.
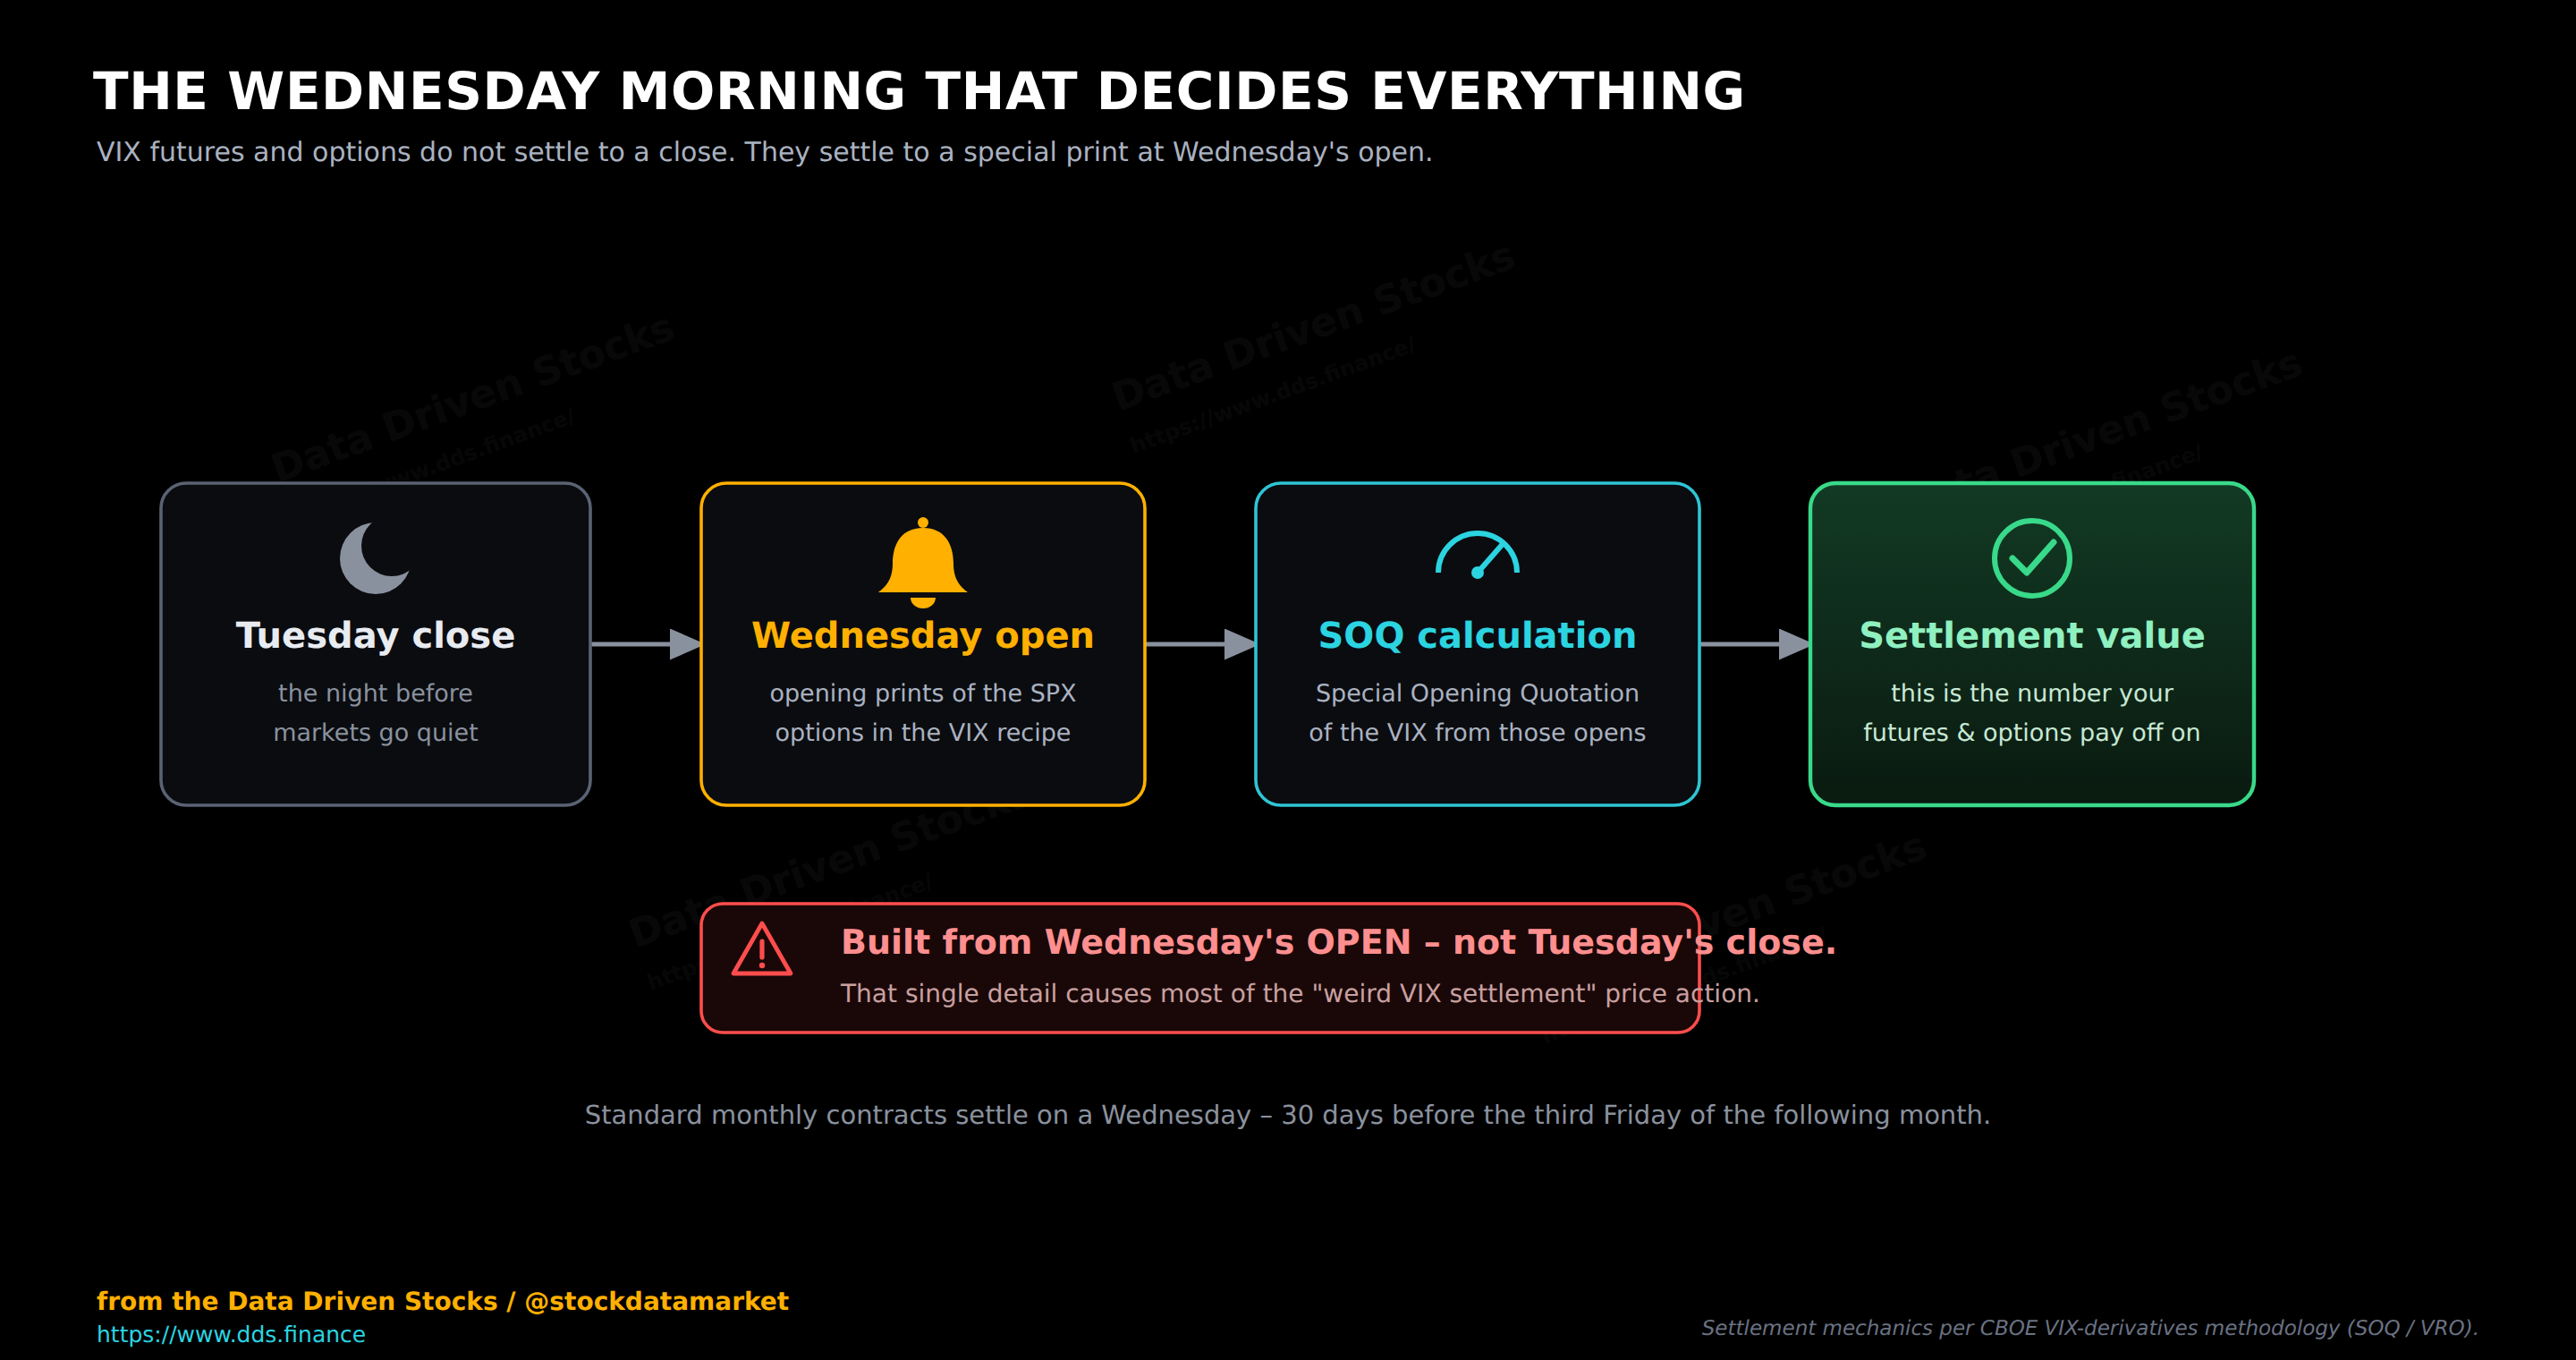
Settlement lands on a Wednesday morning, and it is built from a specific slice of SPX option prints at the open. Not the prior close. That one detail explains a surprising amount of the weird tape people blame on manipulation.
It also leads to the single most useful thing to understand about VIX futures. You can be completely right about spot VIX and still lose on the future. Say spot jumps 10 percent today on some headline. The front-month future might barely move, because the market has decided the scare is temporary and will fade before that Wednesday print. Your read on today was correct. Your position still went nowhere. Once that clicks, most of the confusion around VIX products clicks with it.
3. VIX ETFs: what they actually hold
Let us say the quiet part clearly. Most “VIX ETFs” do not track spot VIX. They track an index of VIX futures. That single fact is why your gut says “VIX up 10 percent means my ETF is up 10 percent,” and your brokerage statement disagrees.
Take the plainest one. ProShares VIX Short-Term Futures ETF, ticker VIXY, is upfront about its benchmark in its own literature. It is not measured against spot VIX. It holds a constant one-month position by owning the first two VIX futures and rolling from the front month into the second month a little each day. So when you buy VIXY, you are buying a rolling blend of front and second-month futures. The fund’s own documents warn that it can be expected to behave very differently from the VIX, both day to day and over time.
The variations turn the same idea up or down. UVXY chases one and a half times the daily move of that short-term index, and the word daily is doing heavy lifting, because compounding pulls it away from a simple 1.5x over any longer stretch. SVXY runs the other direction at negative one half times daily, which makes it short a rolling futures index rather than short the VIX. VIXM sits further out on the curve, holding fourth through seventh-month futures for roughly a five-month average maturity, which makes it calmer and slower to react to a sudden pop.
So how far off can the tracking get? Here is every trading day since 2011, plotted honestly.
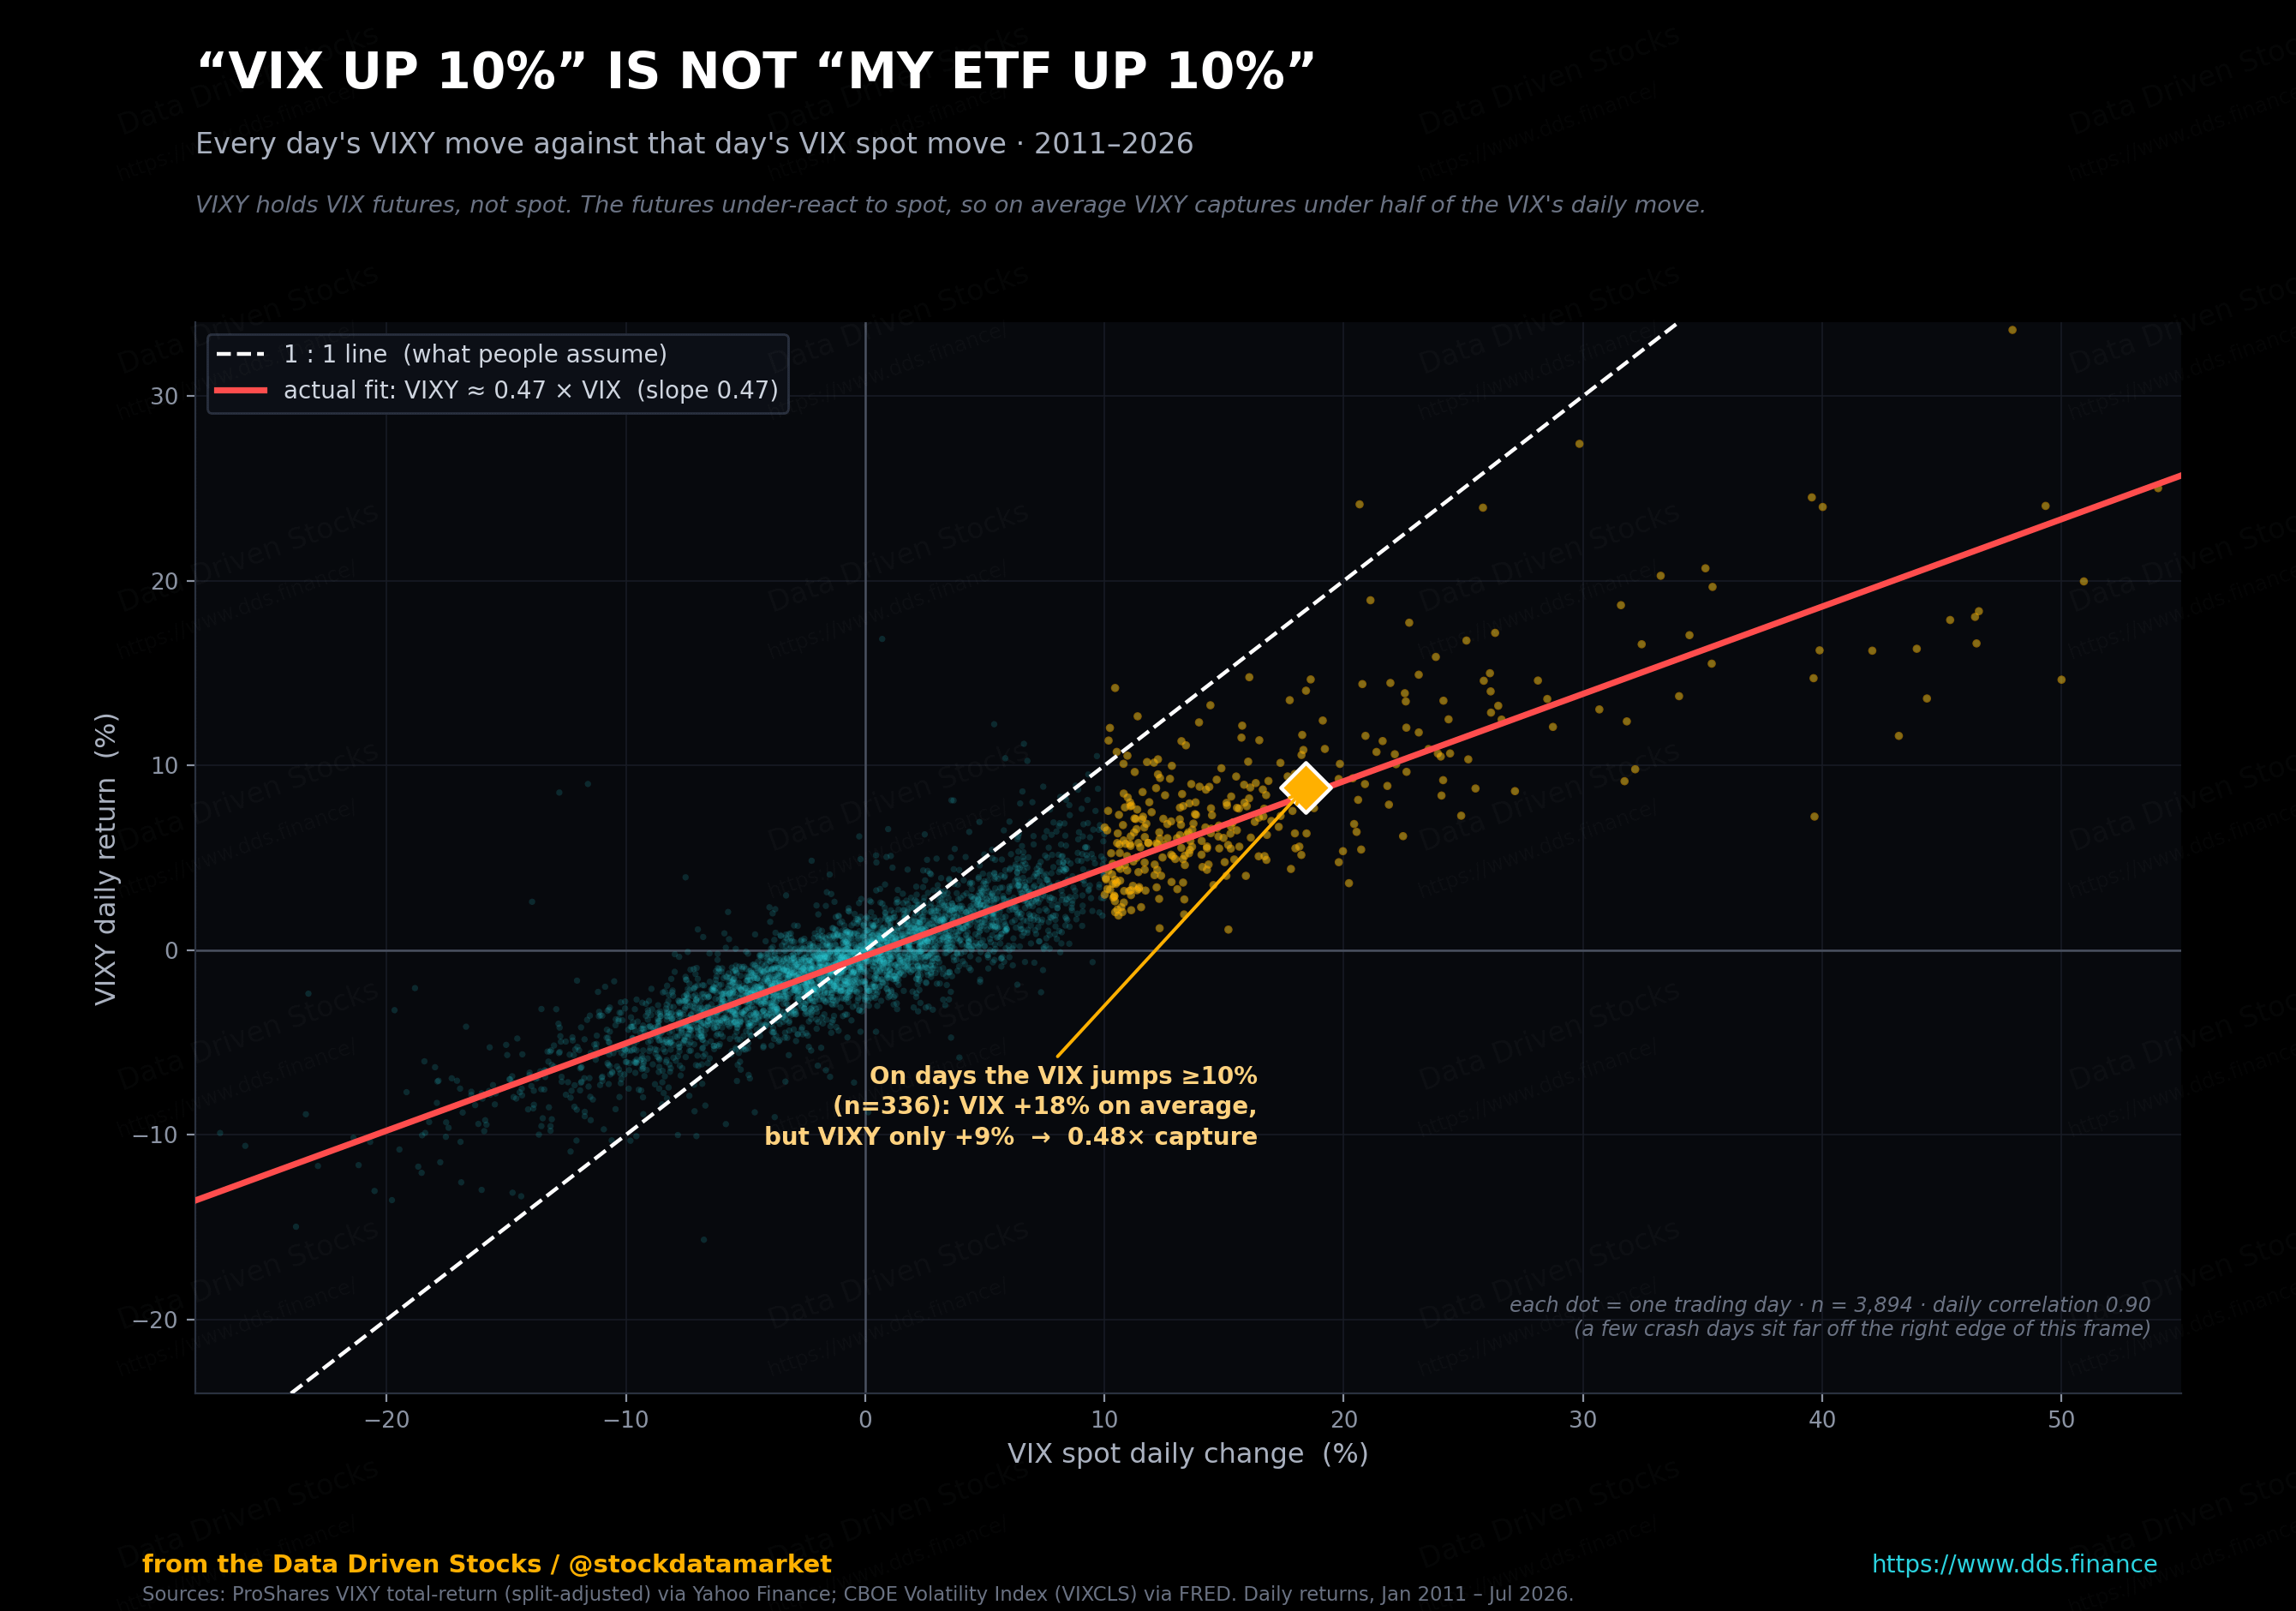
Three forces stack up to cause that gap, and they compound each other. The ETFs hold futures, and a spot move today may not shift the market’s view of where the VIX lands at settlement. The portfolio is a weighted blend of two contracts, so even when the front one jumps, the second often moves less and drags the average down. And rolling itself costs money whenever the curve is in contango, which as we just saw is most of the time. That last one is the famous “VIX ETF decay” people meme about. There is nothing mystical in it. You are buying next month’s forecast every single day and paying the spread to do it.
If you want a picture that sticks: spot VIX is today’s weather report, the futures are the forecast for next month’s report, and a long VIX ETF is a subscription that keeps buying next month’s forecast every day and eats a small fee each time. Over years, that fee is the chart at the top of this article.
So when is it actually worth owning one?
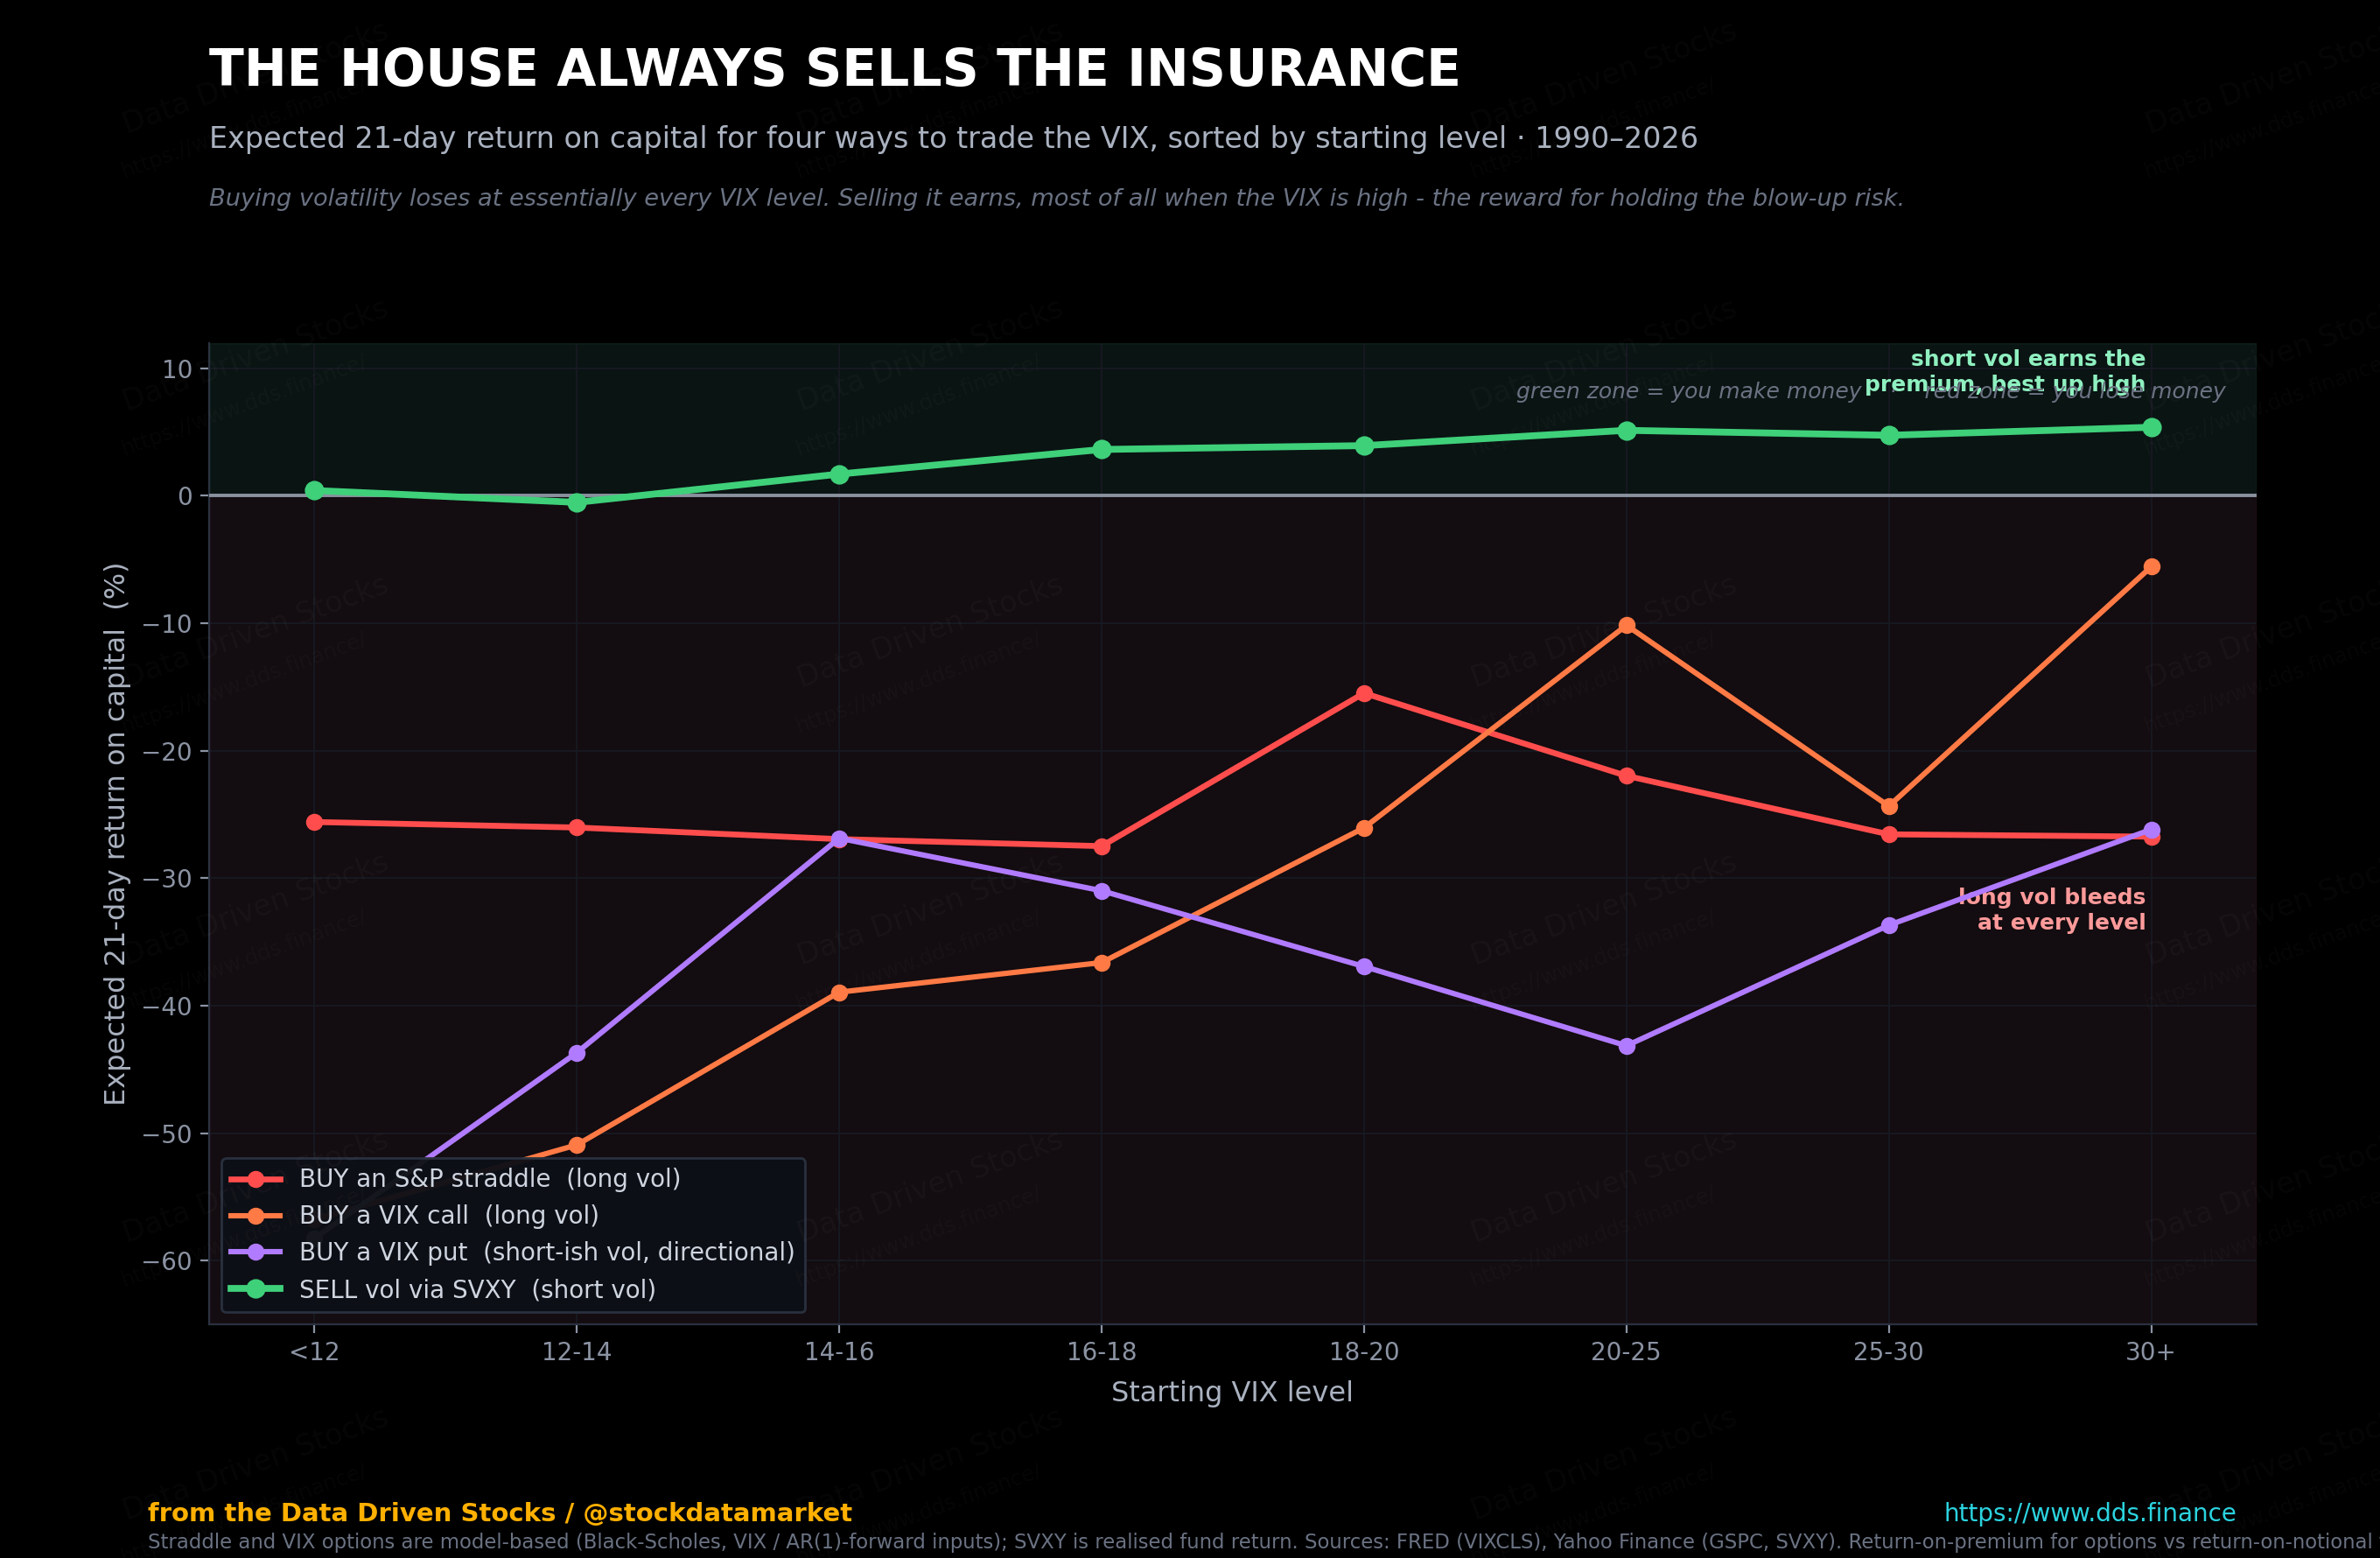
Knowing they decay is not the same as knowing when to touch them. So I ran the tape. For every trading day since 2011, I checked where the VIX was sitting, then measured what each ETF did over the following month. Then I sorted the results by the starting VIX level. The pattern is clean, and it is the opposite for the long side and the short side.
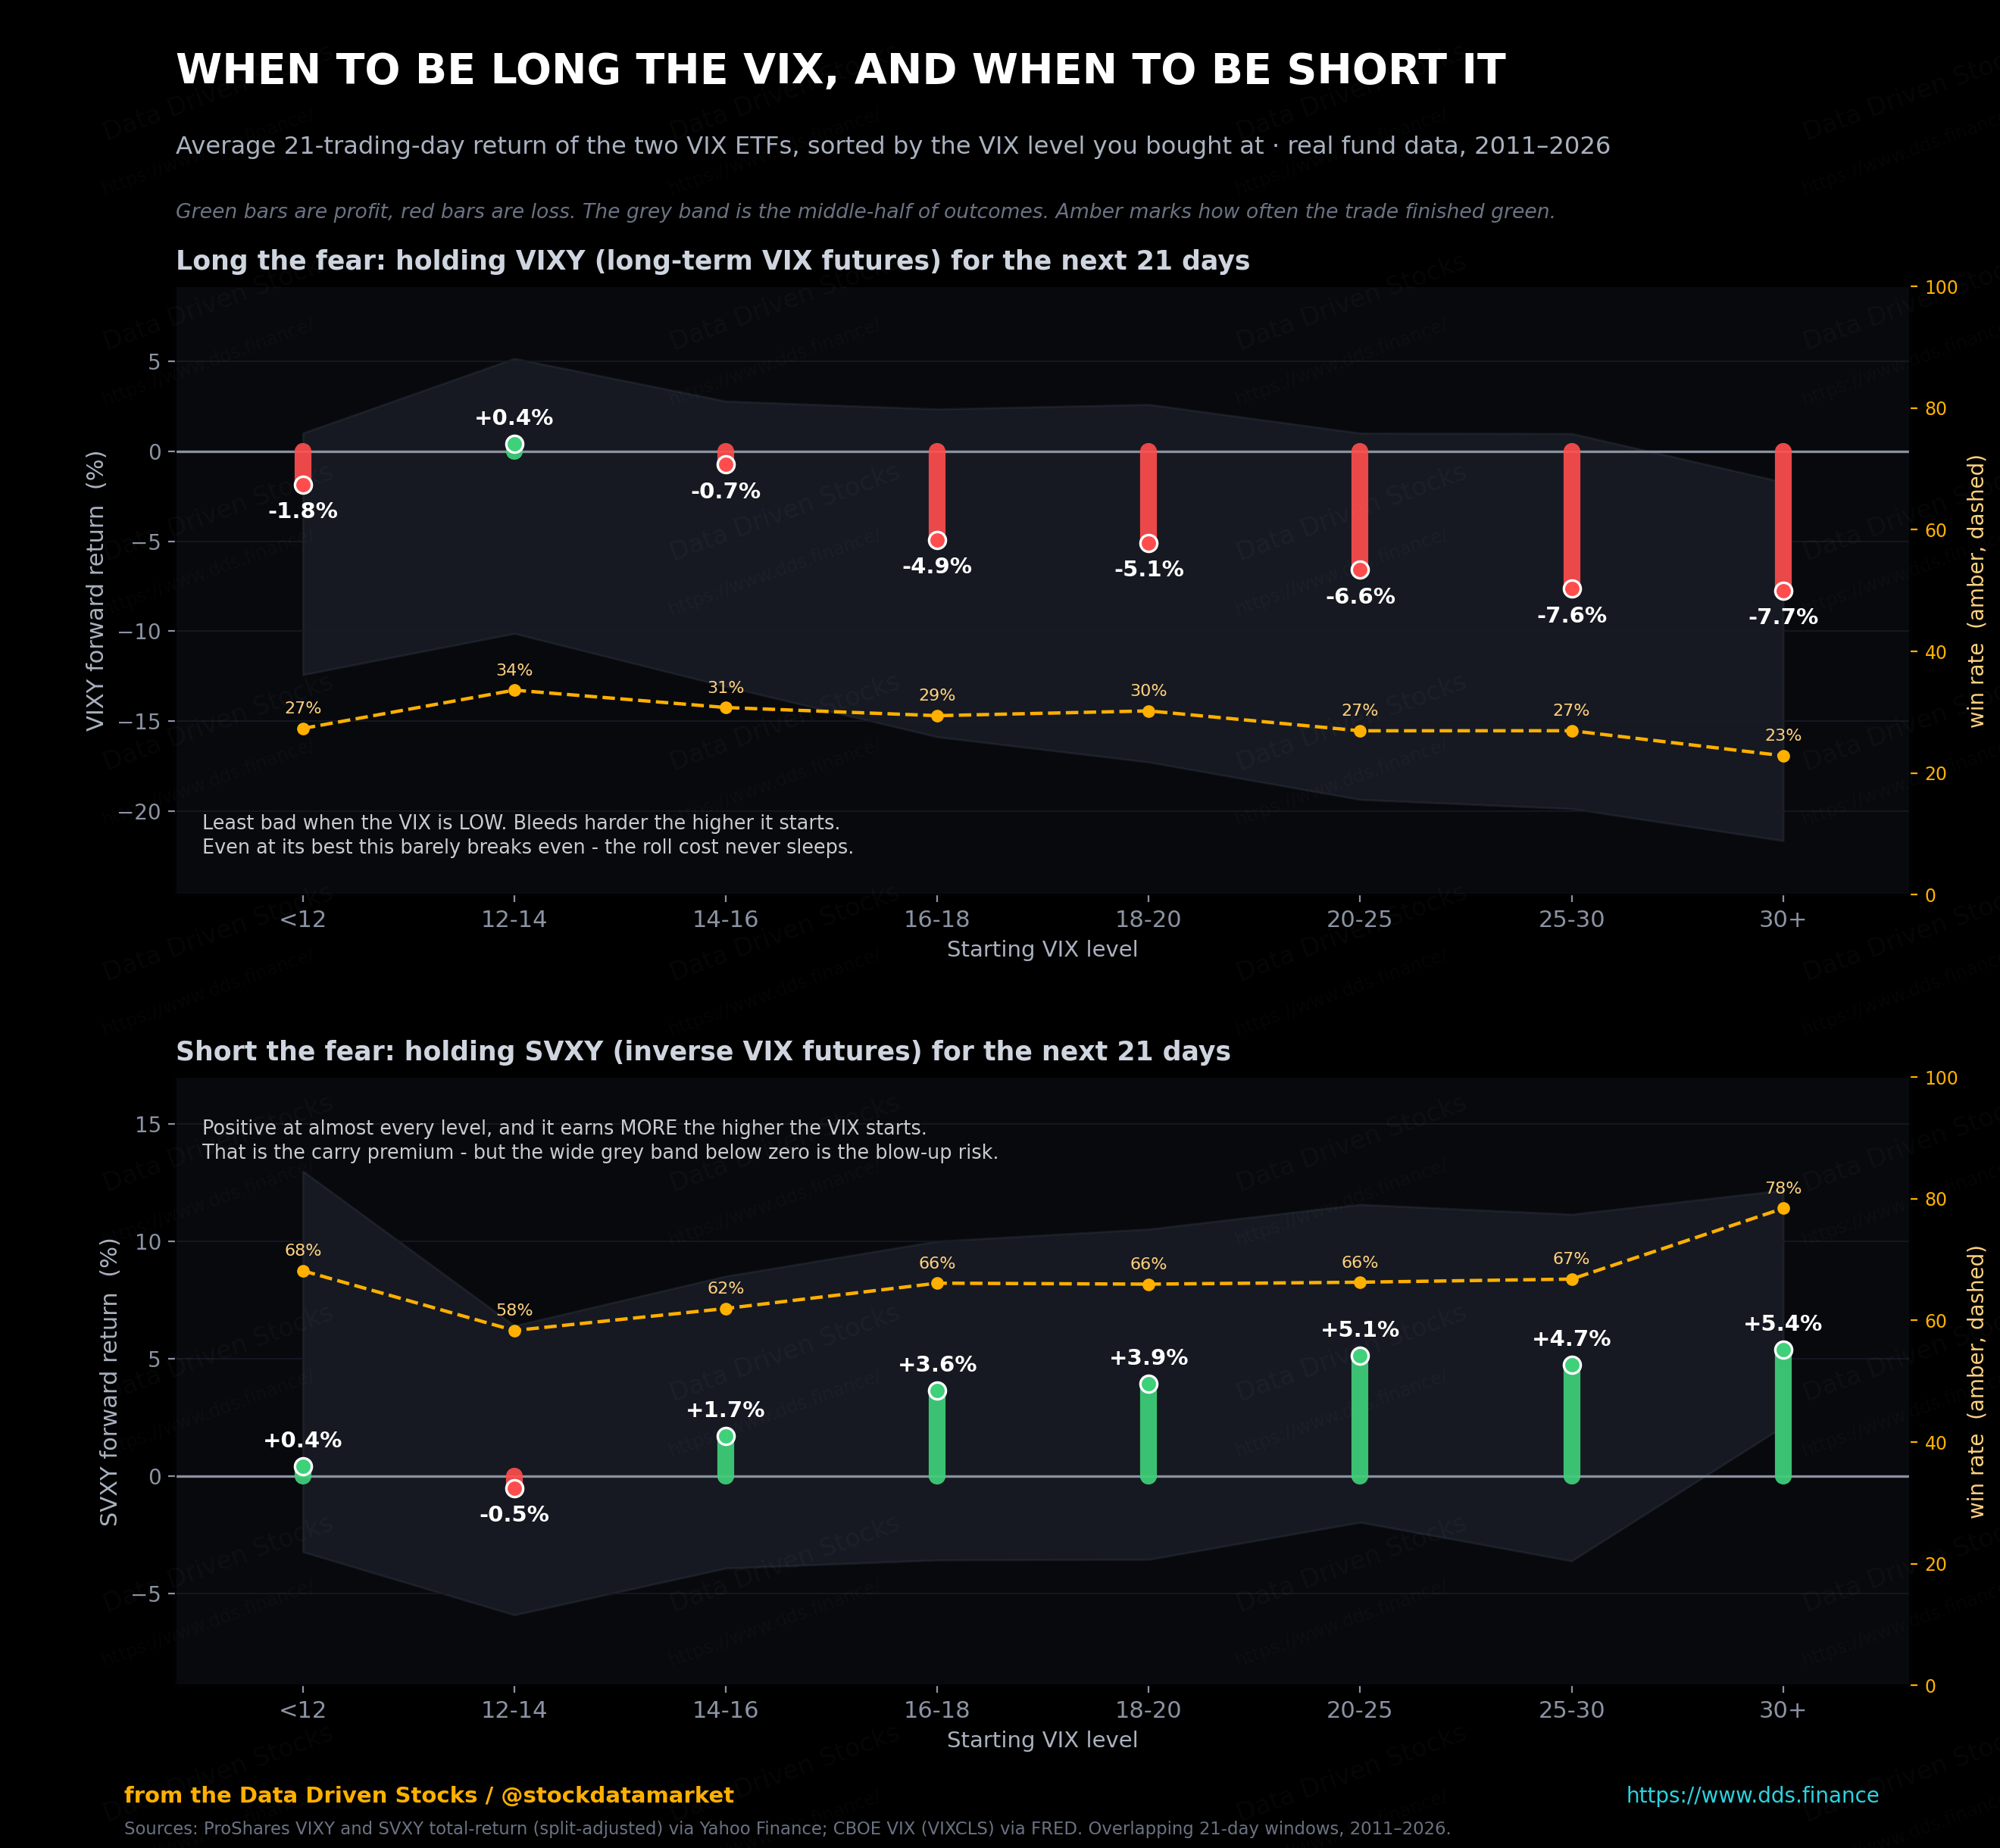
Read the top panel first. If you are going to be long volatility through an ETF, the only defensible time is when the VIX is cheap, because that is the one zone where the roll cost roughly cancels out against the odds of a pop. Buy the long-vol fund when the gauge is already high and you are paying a fortune to hold something that mean-reverts against you. Even at its best, though, the long-vol side barely breaks even. There is no green mountain on that panel, only a shallow hole that gets deeper.
The bottom panel is where the money actually is, and it comes with a warning stapled to it. Shorting volatility paid at nearly every VIX level, and it paid most when the VIX was already elevated, which is the statistical case for the classic move of selling into a spike and waiting for the calm. But look at how wide the grey band drops below the bars in that same high-VIX zone. That downside is not theoretical. February 2018 lived in exactly that part of the chart, and it is where the inverse funds nearly died. The average is green. The tail is a cliff.
4. SPX and XSP straddles: trading volatility at the source
Here is a cleaner way in for some traders. If the VIX is built from SPX options, then buying or selling those options is trading volatility right where it comes from. This is why “I want to trade the VIX” so often turns into “I am trading implied volatility through SPX or XSP structures.” The most direct expression of that is the straddle.
A long straddle is buying a call and a put at the same strike and the same expiration. You are not betting on up or down. You are betting the move will be bigger than the market priced in. A short straddle is the mirror image: you sell both, collect the premium, and win if the market sits still.
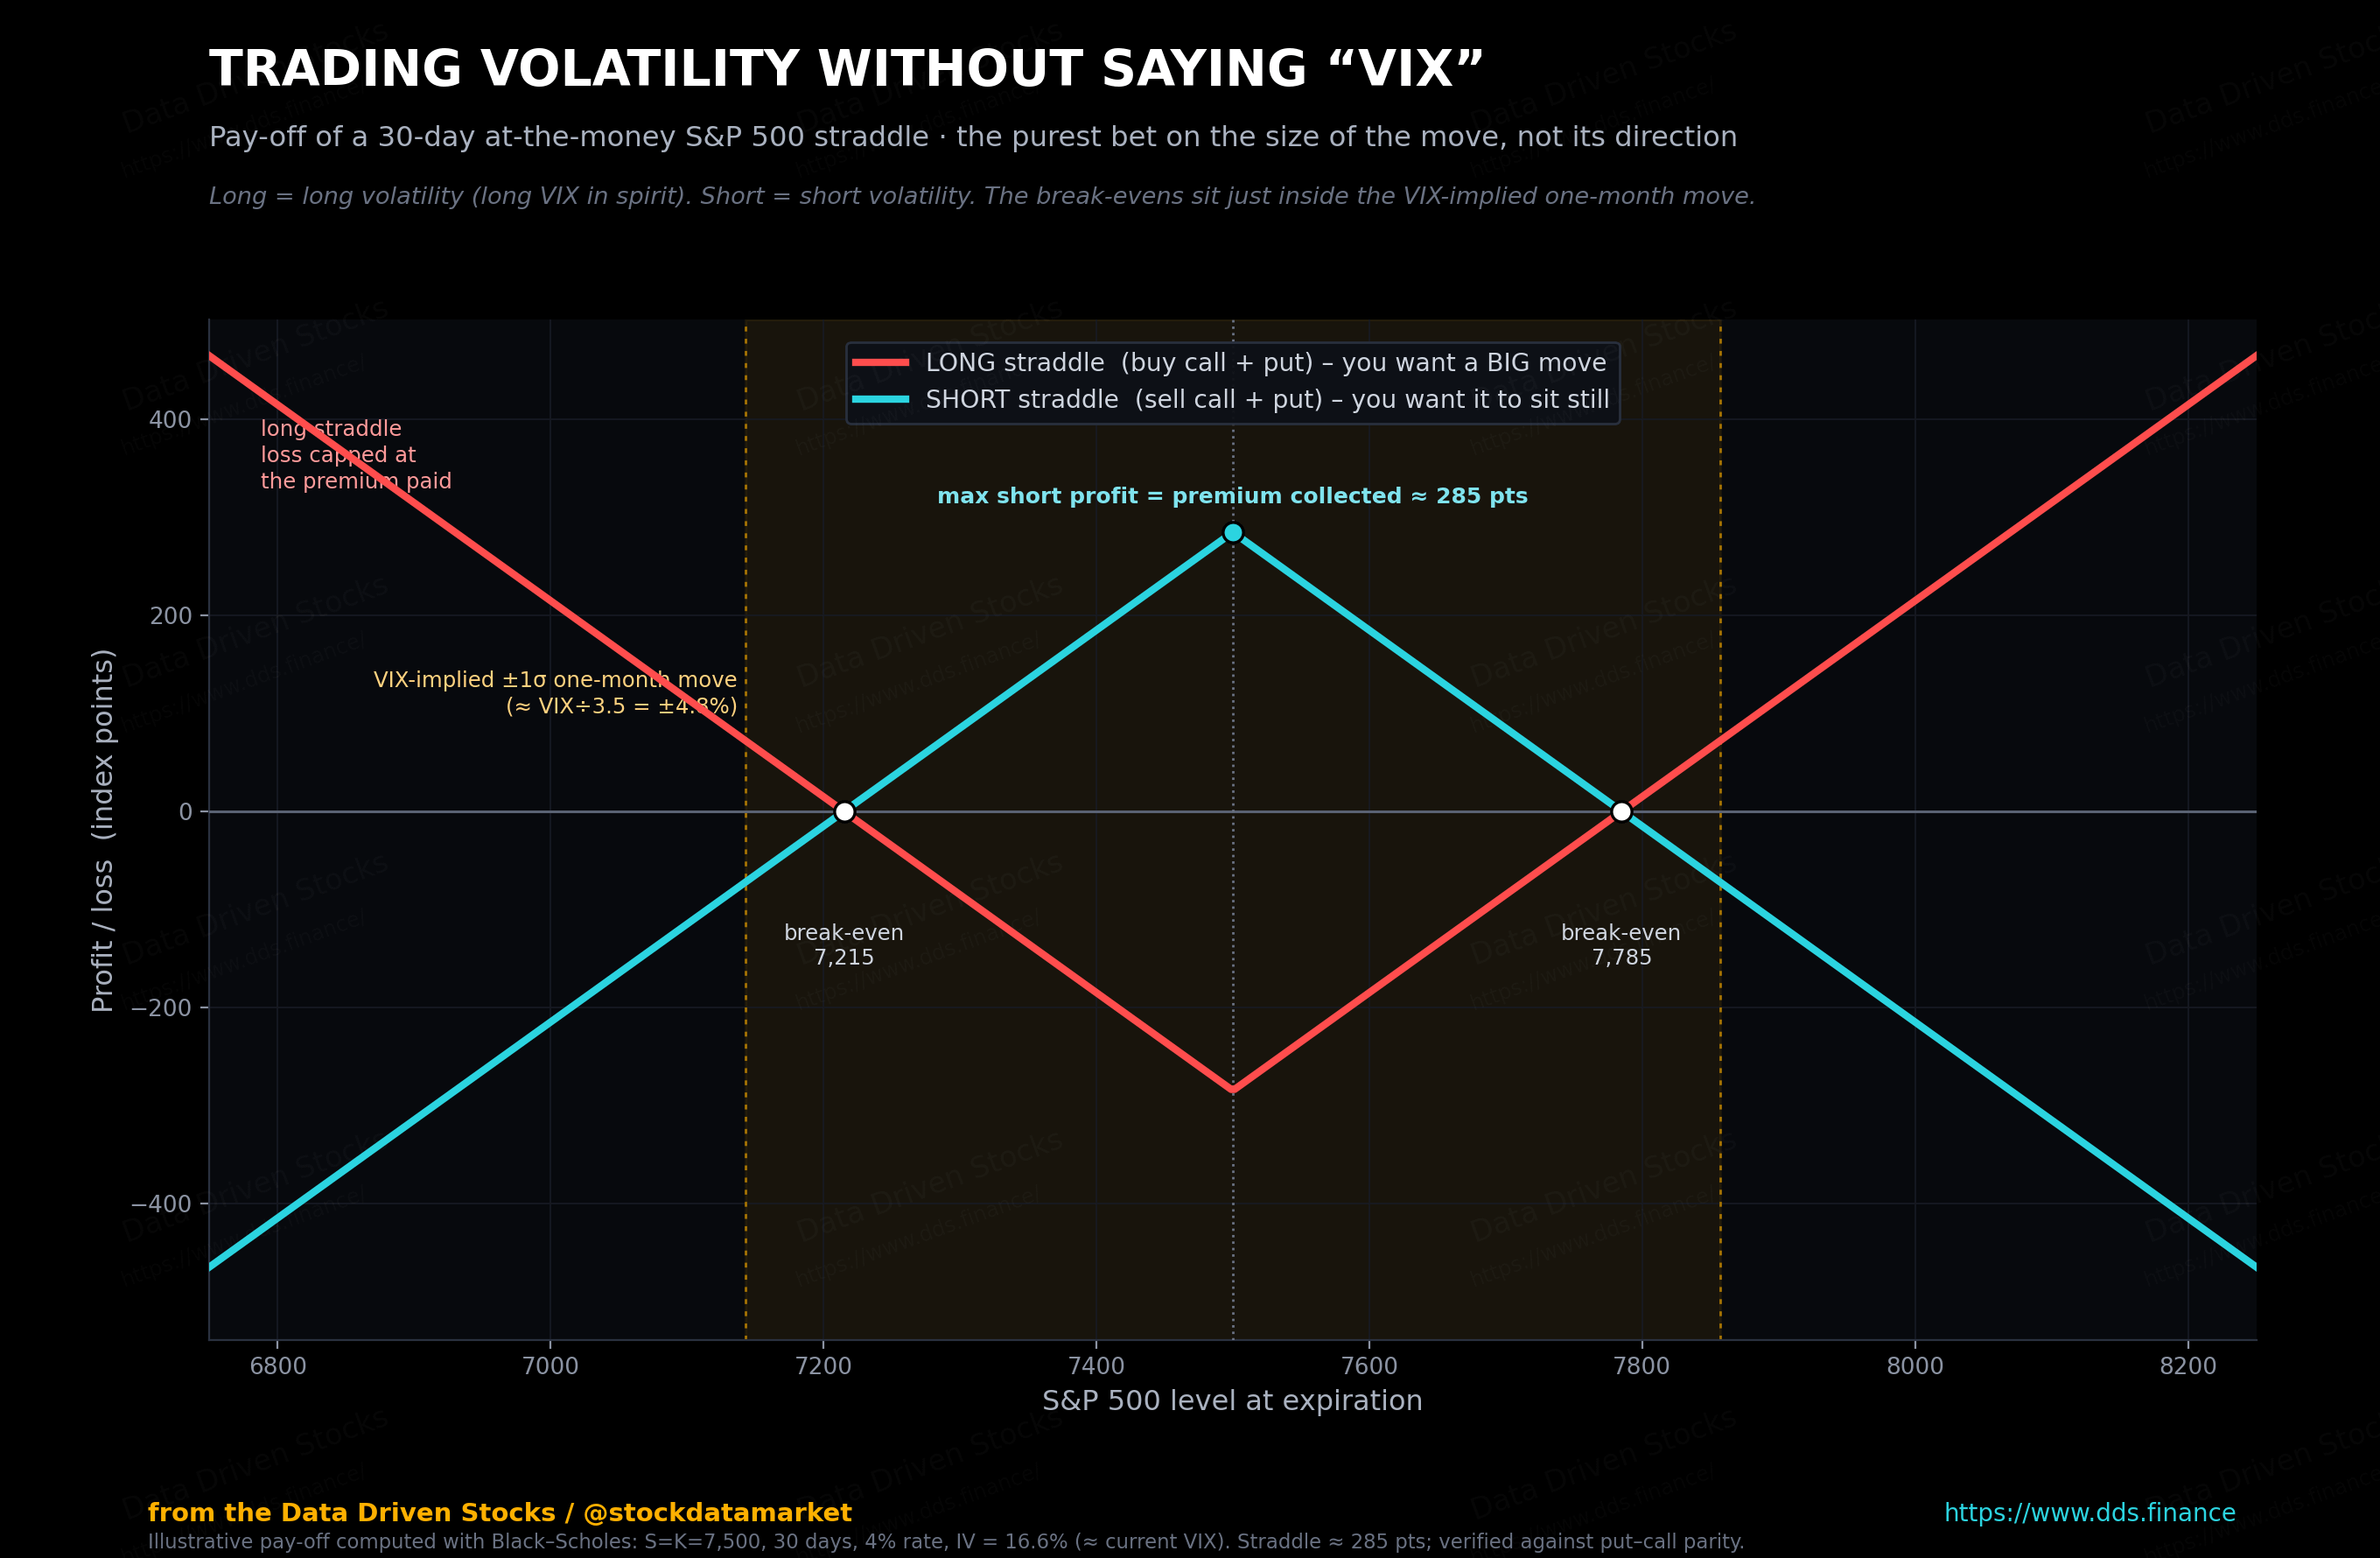
That link to Part 1 is worth sitting with. The break-even points on the straddle are not arbitrary. They sit just inside the one-month move the VIX is pricing, because the straddle premium is the expected-size move expressed in dollars, and that average move runs a little under the full one-sigma swing. The gauge and the option are quoting the same thing in two different languages.
The reason index traders reach for SPX and XSP specifically is settlement. Both are cash-settled and European-style, which means no one can exercise them early. If you have ever had a short SPY option assigned overnight for no better reason than a dividend, you already understand the appeal. XSP is simply the smaller-notional version of the same thing.
Long straddles tend to make sense heading into a known catalyst, a Fed meeting or an inflation print, when you think the actual move will beat what the market charged. Short straddles are the opposite bet, usually placed when implied volatility looks rich and you expect it to cool off. One is long volatility. The other is short volatility. Neither one needs you to call the direction.
So is buying a straddle ever a good bet?
The payoff diagram shows the shape of the trade. It says nothing about whether the trade actually pays. The intuitive answer is that you should buy straddles when the VIX is low, because the breakeven is small and any decent move gets you paid. It is a clean story. So I tested it on every trading day back to 1990. For each day I priced a 30-day at-the-money straddle off the VIX, then checked what the S&P actually did over the next month, and measured the result as a return on the premium you paid. Then I sorted by starting VIX.
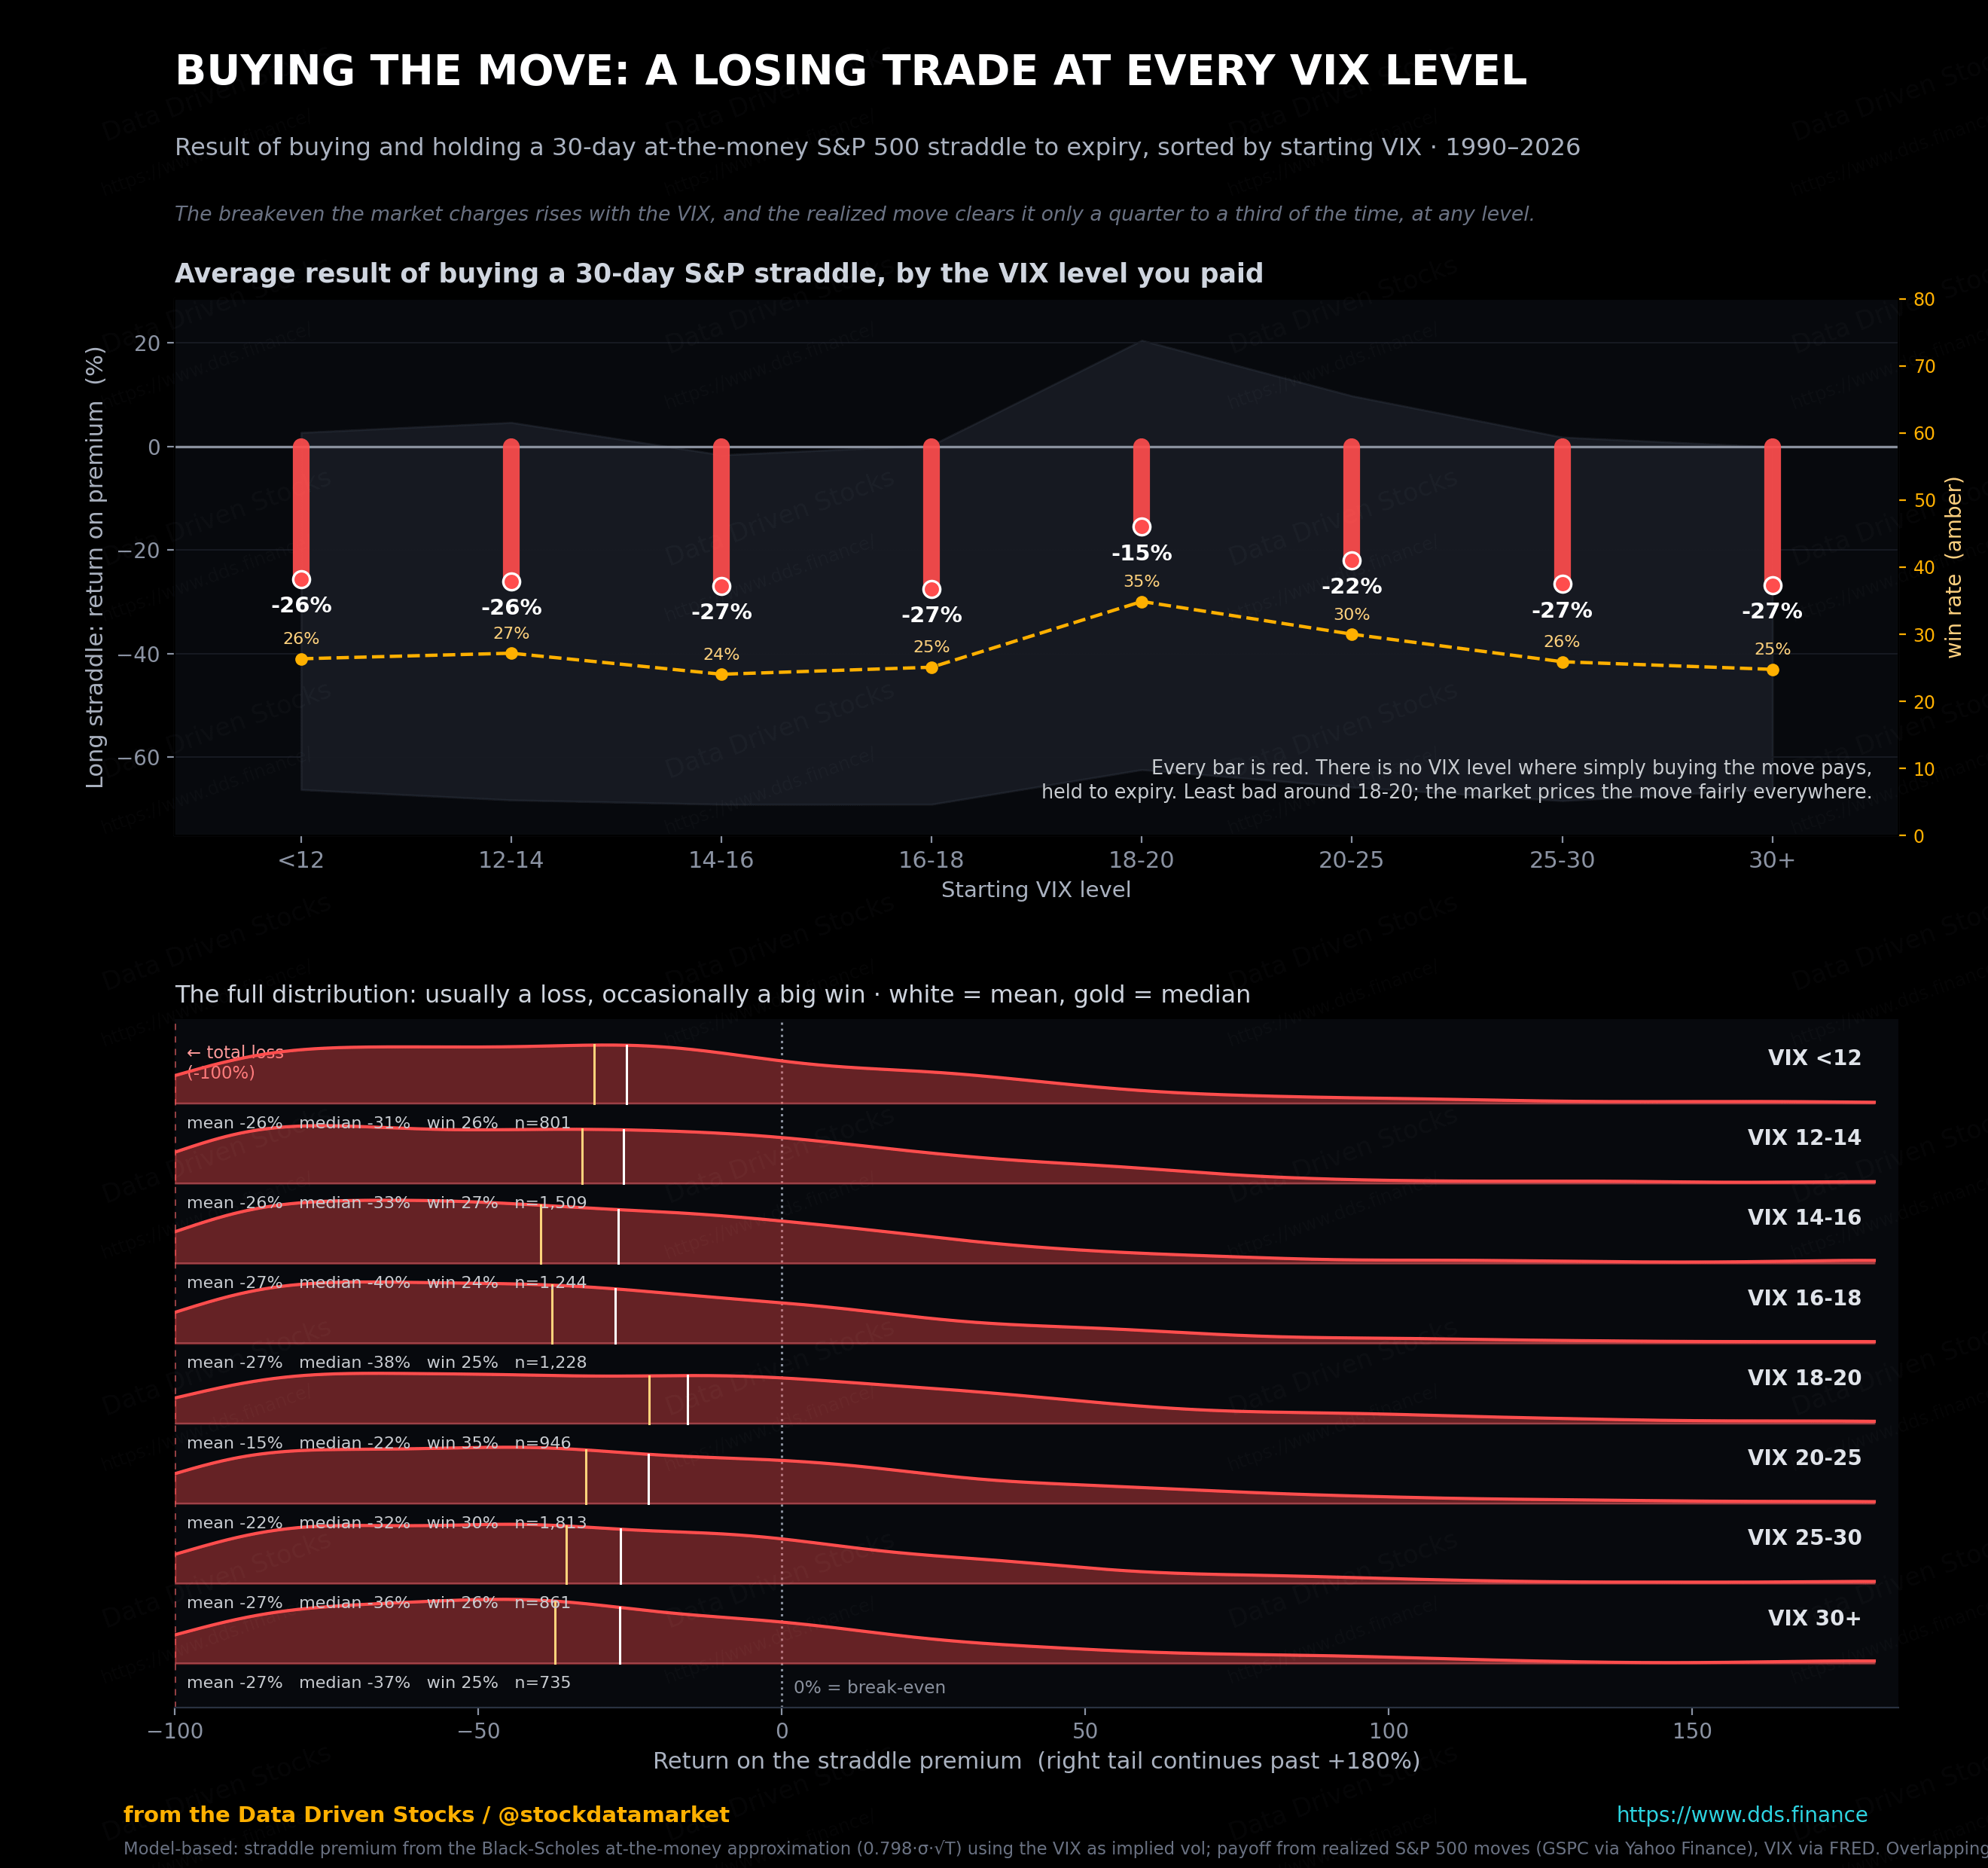
The clean story is wrong. There is no VIX level where simply buying the move pays off when held to expiry. The reason is the volatility risk premium from Part 1, and it does not switch off at low VIX. When the gauge is cheap the breakeven is indeed small, but calm markets tend to stay calm, so the small move you need still fails to show up most of the time. The least-bad zone sits around a VIX of 18 to 20, and even there you lose on average. The market prices the size of the move fairly to slightly expensively at every level. That is the whole point of the premium.
None of this means straddles are useless. It means the edge in a straddle is not in buying one at some magic VIX level. The edge, such as it is, belongs to whoever sold it to you. Which is a good moment to look at the other side of that trade.
5. VIX options: right on the gauge, wrong on the money
Yes, you can trade options on the VIX directly. And yes, people get cooked, because they assume these behave like SPY options. They do not, for two reasons that are easy to state and easy to forget.
First, VIX options settle to that same Wednesday-morning SOQ, not to Tuesday’s close. Second, they are European-style and priced off the corresponding VIX future, not off spot VIX. So a VIX option is effectively an option on the forward, which is already an estimate of where the gauge lands at settlement. You are two steps removed from the number you are watching.
Put those together and you get a result that looks impossible until you do the arithmetic. You can be right on direction, finish in the money, and still lose.
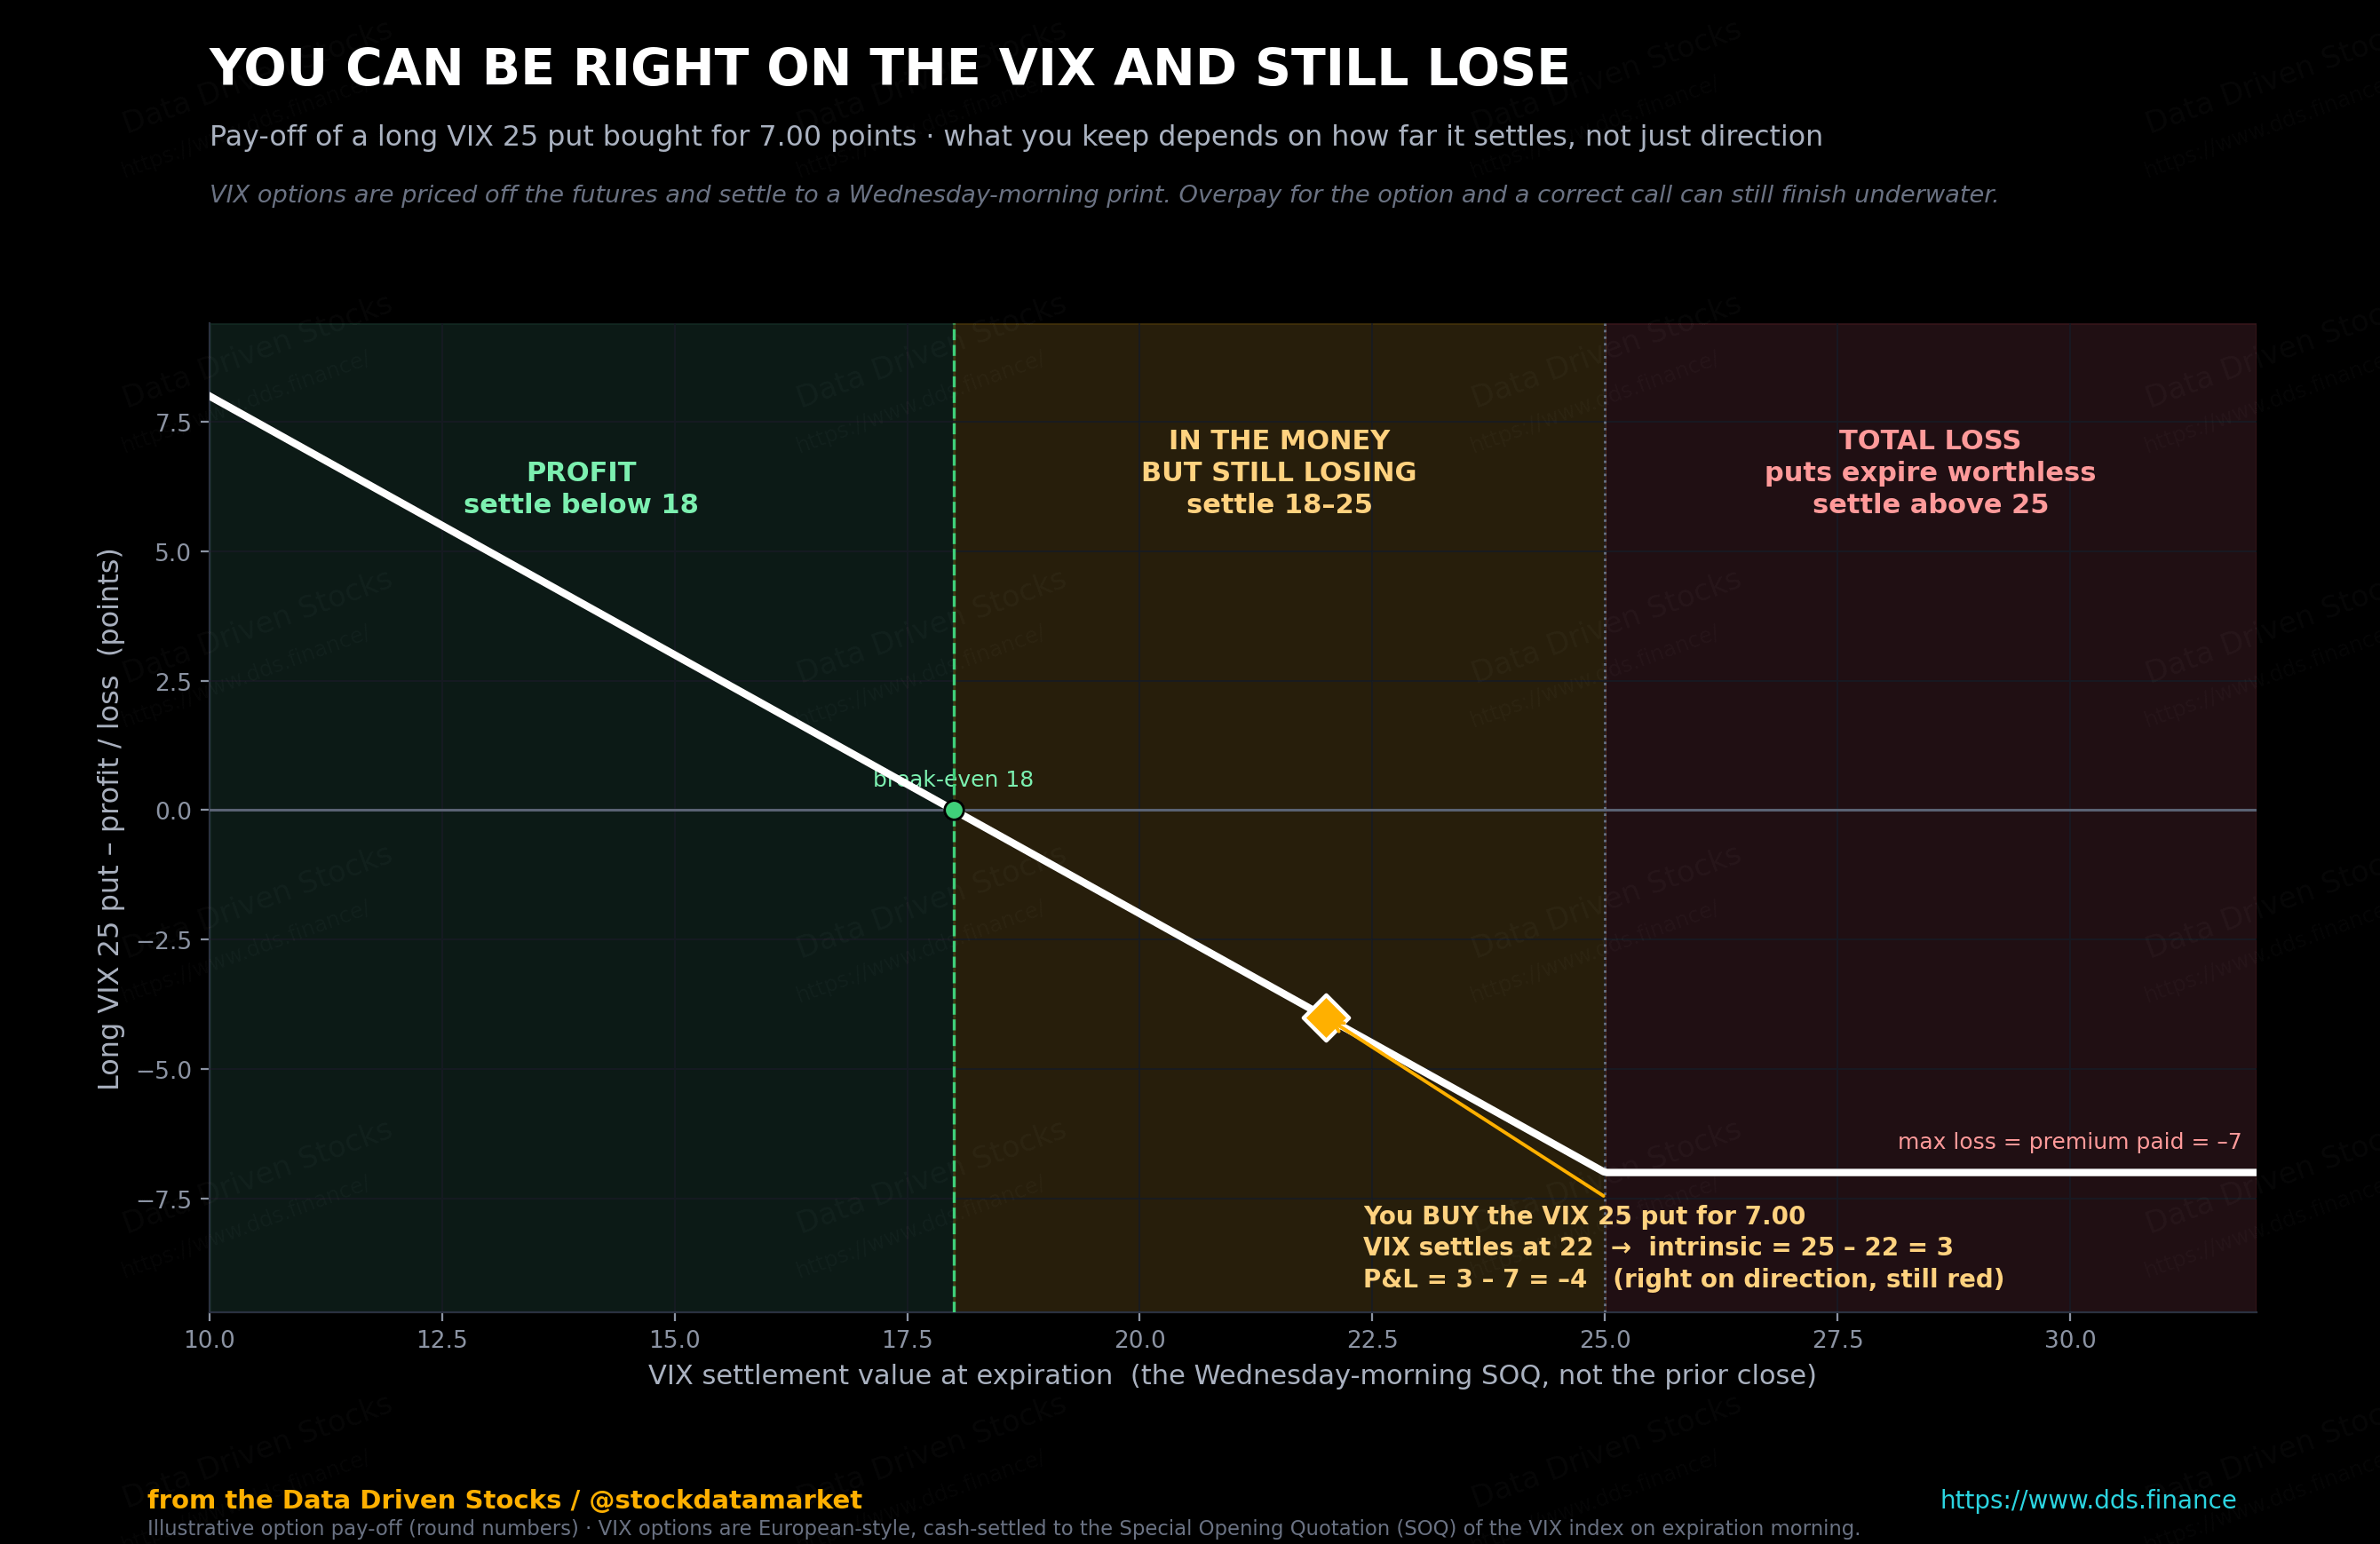
This is not a VIX quirk. It is just how options work. The premium you pay already contains implied volatility, time value and plain demand. When the panic drains out, all three deflate, and the option can lose value faster than a favorable move in the gauge earns it back. Because VIX options are priced off the future, you can even be right about spot VIX and still not get paid the way you pictured. Overpay for protection and a correct call can finish in the red.
How often does buying VIX options actually pay?
That was one trade with round numbers. To see the real shape of it, I ran a backtest across more than thirty years. For every day, I priced a 30-day at-the-money VIX call and put, using a mean-reverting model for where the VIX future sits, then settled each one against the VIX that actually printed a month later. This part is model-based, so treat the exact percentages as illustrative rather than gospel. The shape, though, is stubborn, and it holds no matter how I tune the model.
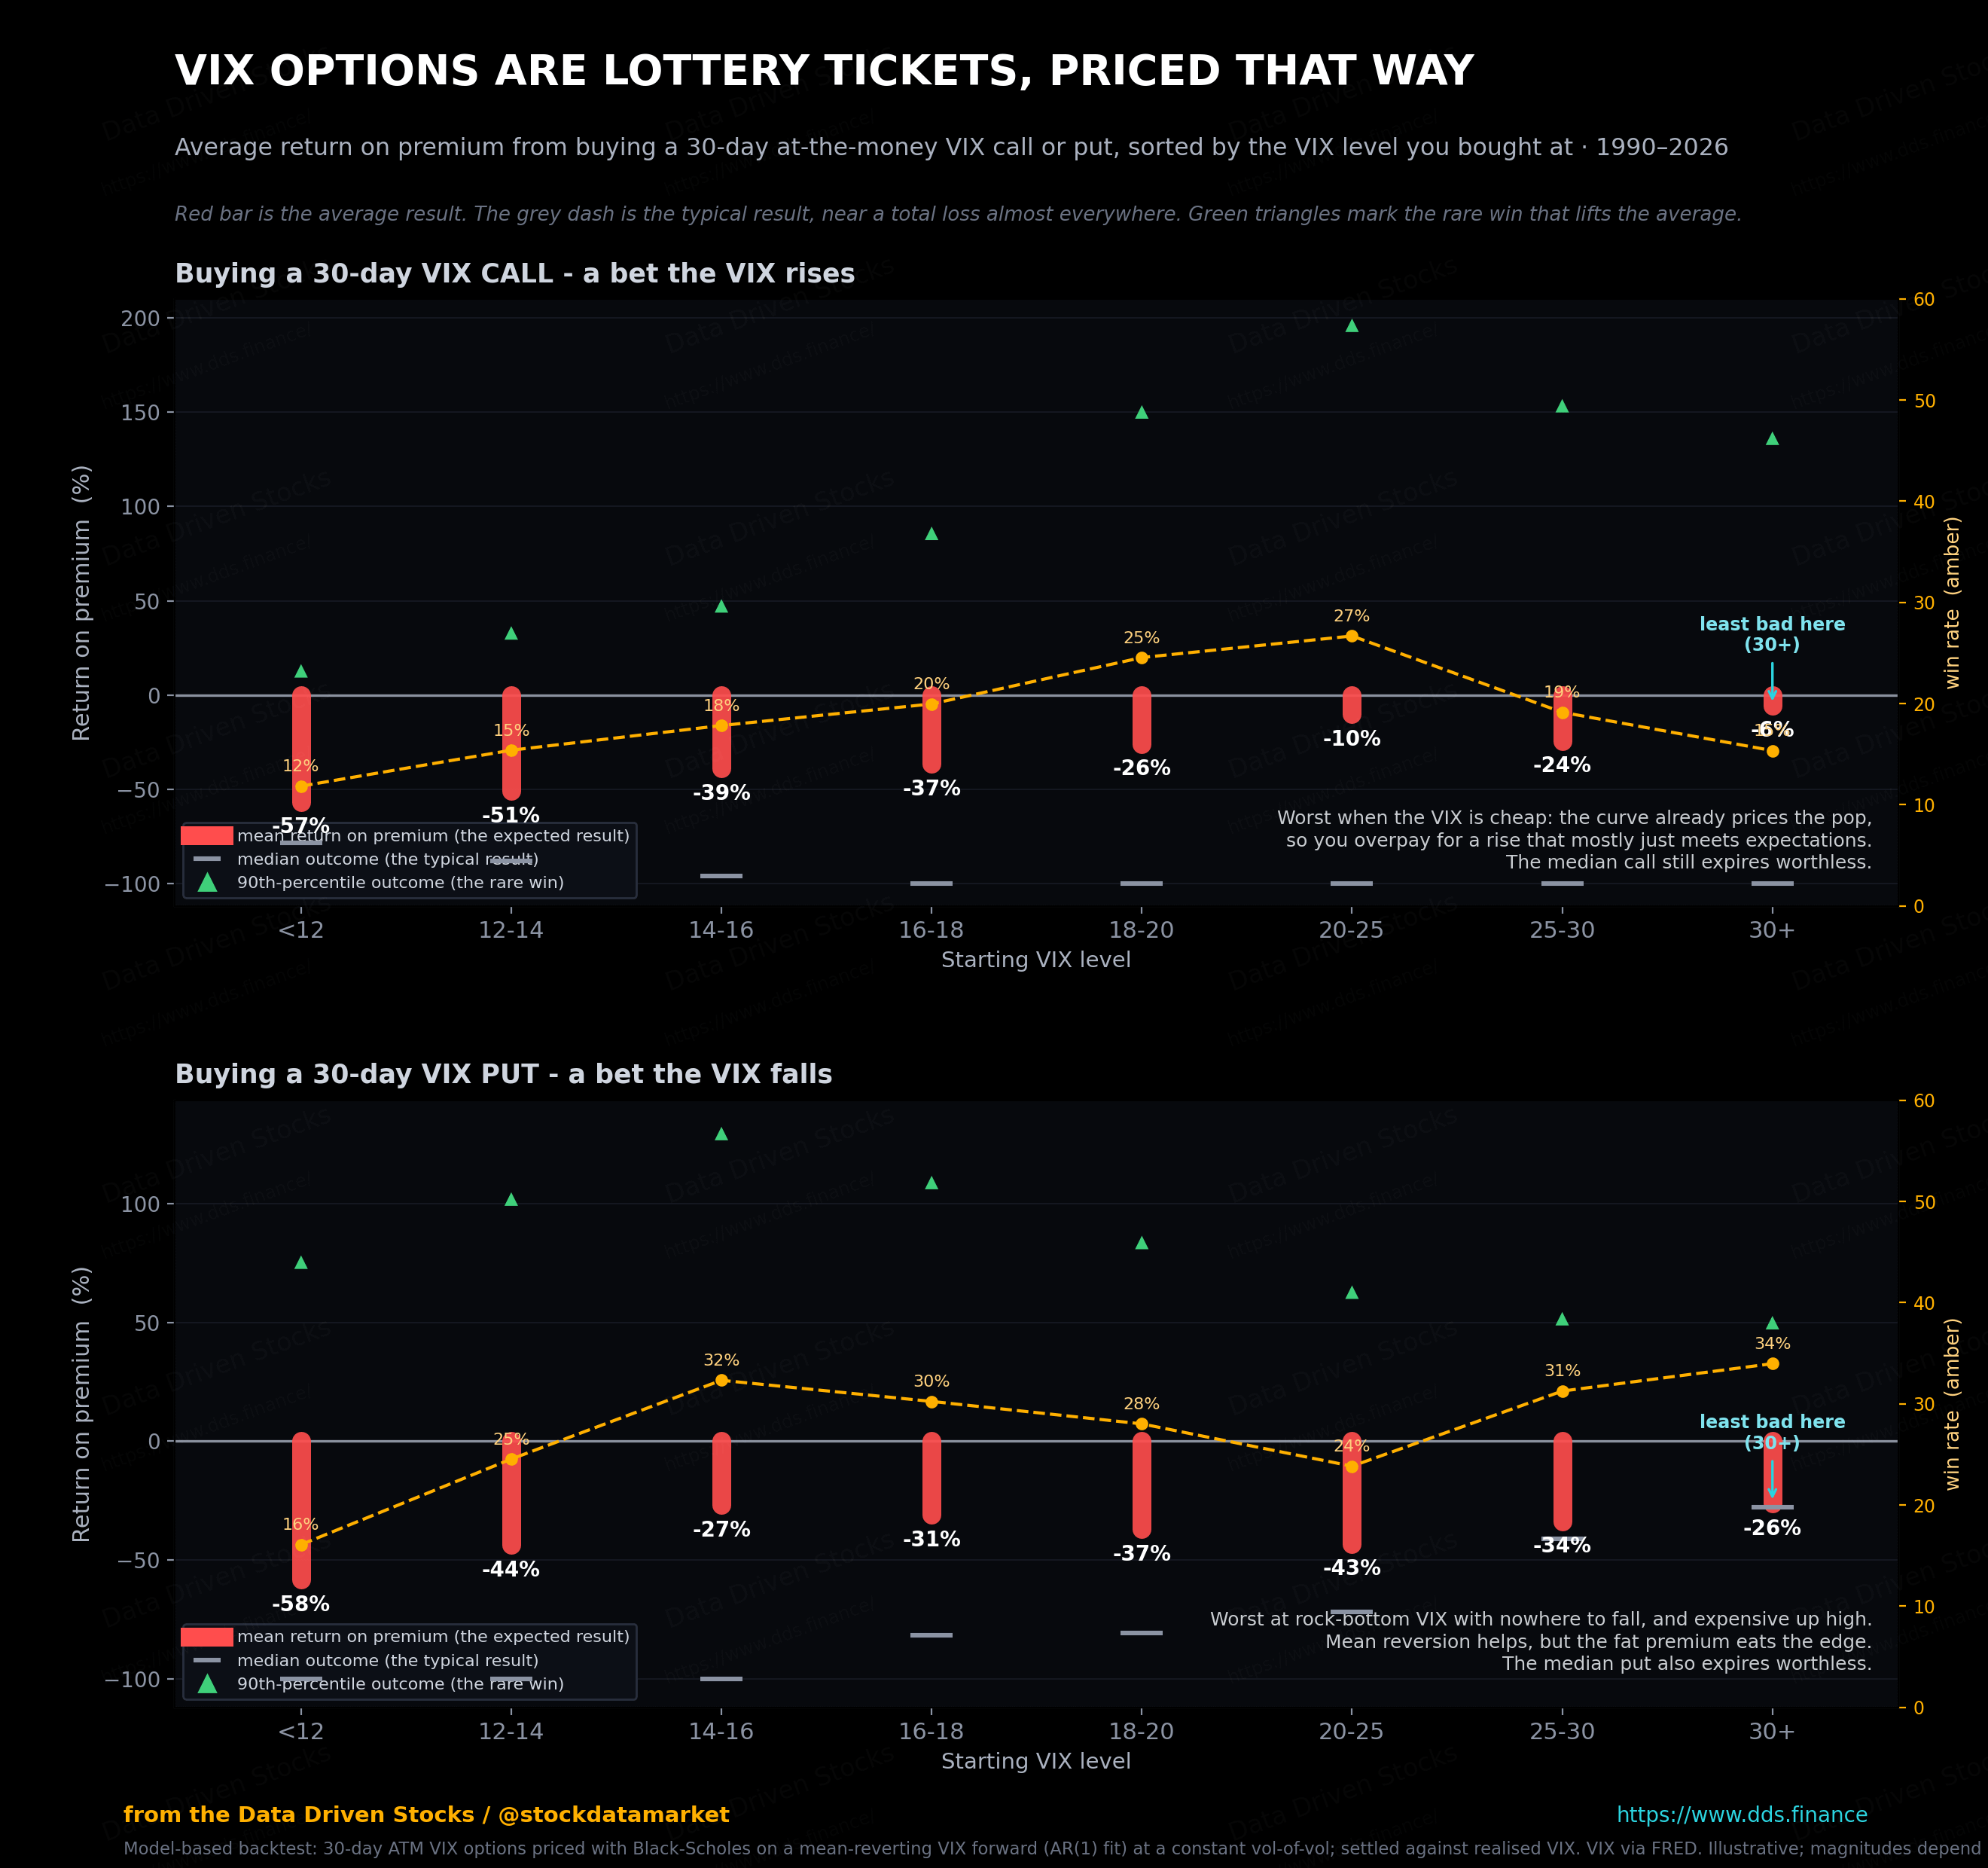
Here is the part that trips people up. The direction is right on average. The VIX really does tend to rise when it is low and fall when it is high, which is exactly what a call buyer and a put buyer are betting on. We measured that mean reversion directly in Part 1. So why does buying still lose at every level?
Because the forward already knows. VIX options are priced off the future, and the future has the same mean-reversion baked into it. When the VIX is at 11, the market is not pricing it to stay at 11. The one-month future already sits a few points higher, around 14, because the gauge tends to climb back toward its high-teens long-run average, and your call is priced against that higher forward before you even buy it. So a call only pays if the VIX rises by more than the forward already expected. On average it does not. The typical call and the typical put both expire worthless, which is why the median outcome hugs minus 100 percent across the board. You are buying a lottery ticket, and the price of the ticket already reflects the jackpot.
6. Why Wall Street sells volatility, until the hurricane
This is where the “why is everyone short vol?” question gets interesting. The answer sits in two structural facts we have already met.
Over long stretches, the volatility implied by SPX option prices tends to run above the volatility that actually shows up. That gap, the volatility risk premium from Part 1, is what option sellers harvest. On top of that, holding long volatility through a contango curve bleeds money on the roll, which means the short side collects that too. Sell volatility, pocket the premium, and let time and the curve work in your favor. That is the short-vol carry trade in one line, and for long quiet stretches it feels like free money.
Then it stops feeling like free money.
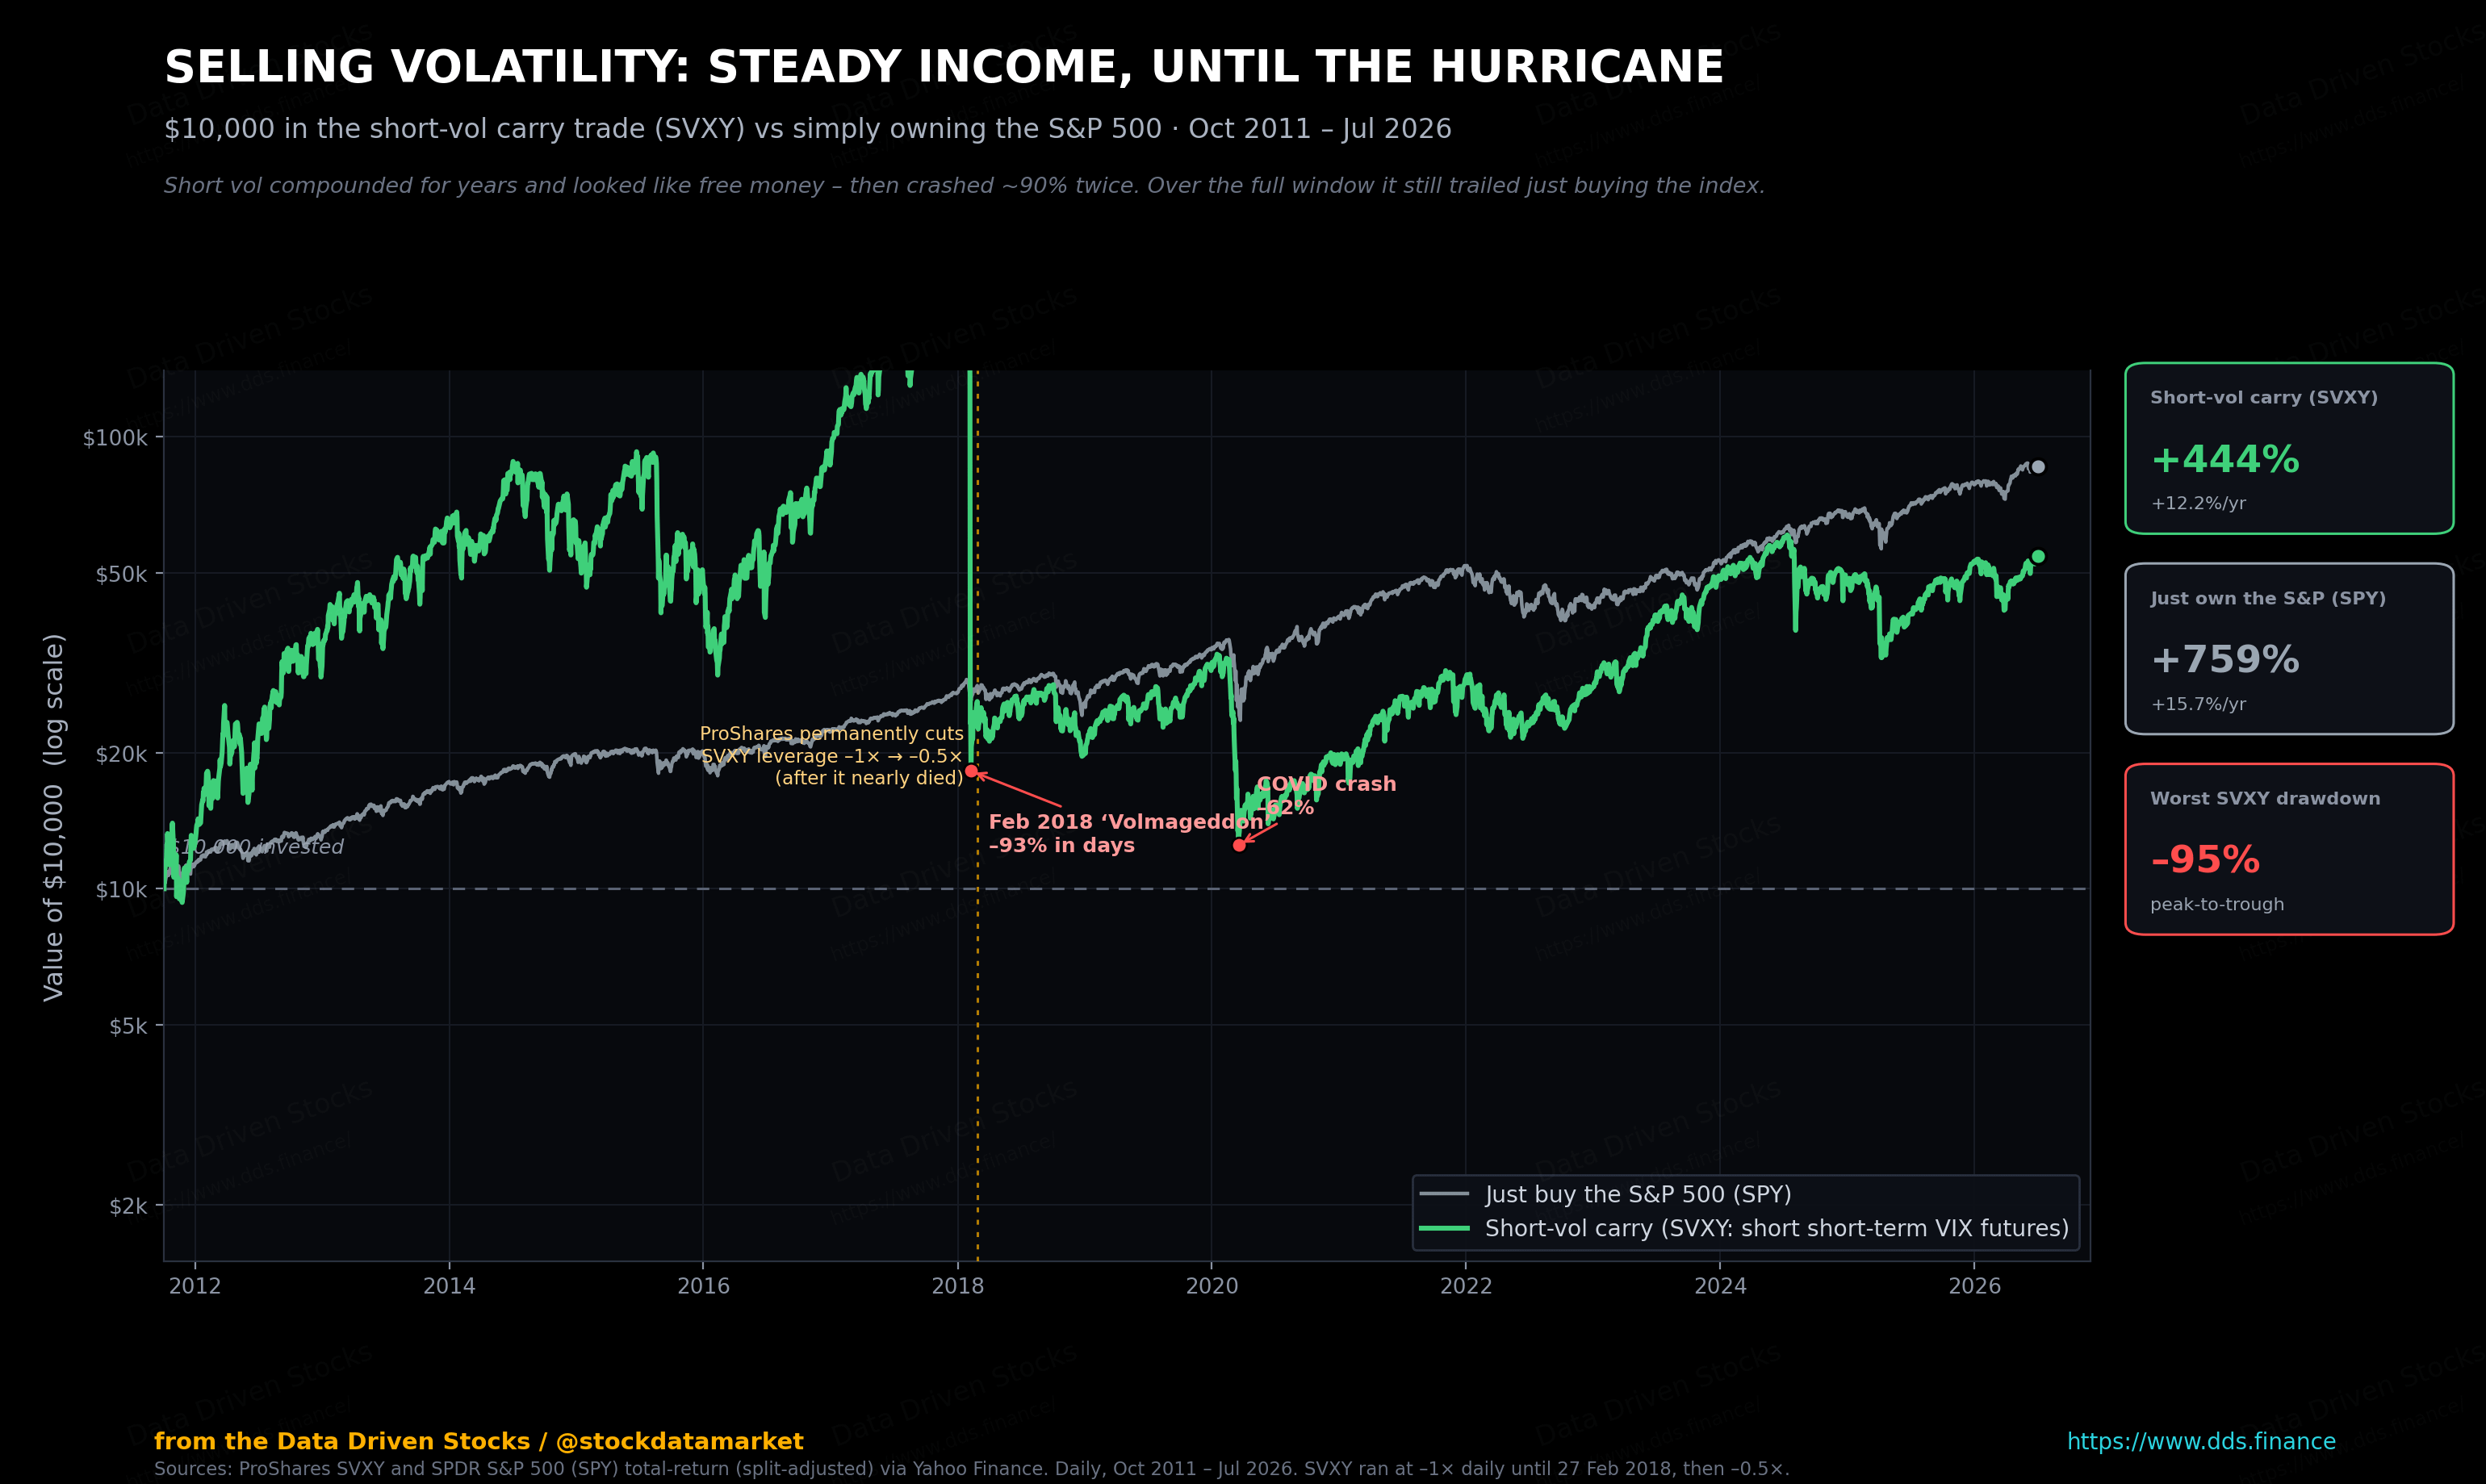
That chart is the honest version of the short-vol story, and it says two uncomfortable things at once. Selling volatility did make money over this window. It also nearly went to zero twice, and it underperformed a plain index fund that no one had to babysit. Volatility reverts toward its average, but it does not climb the stairs on the way there. It takes the elevator. That is exactly why short vol can print small gains for months and then hand back years of them in a single week. On the fifth of February 2018, the VIX more than doubled in one session, jumping about 116 percent. One popular inverse product, the XIV note, lost around 96 percent of its value and was shut down within weeks. Institutions still short volatility, every day. The graveyard is also full of desks that thought this was the easy part.
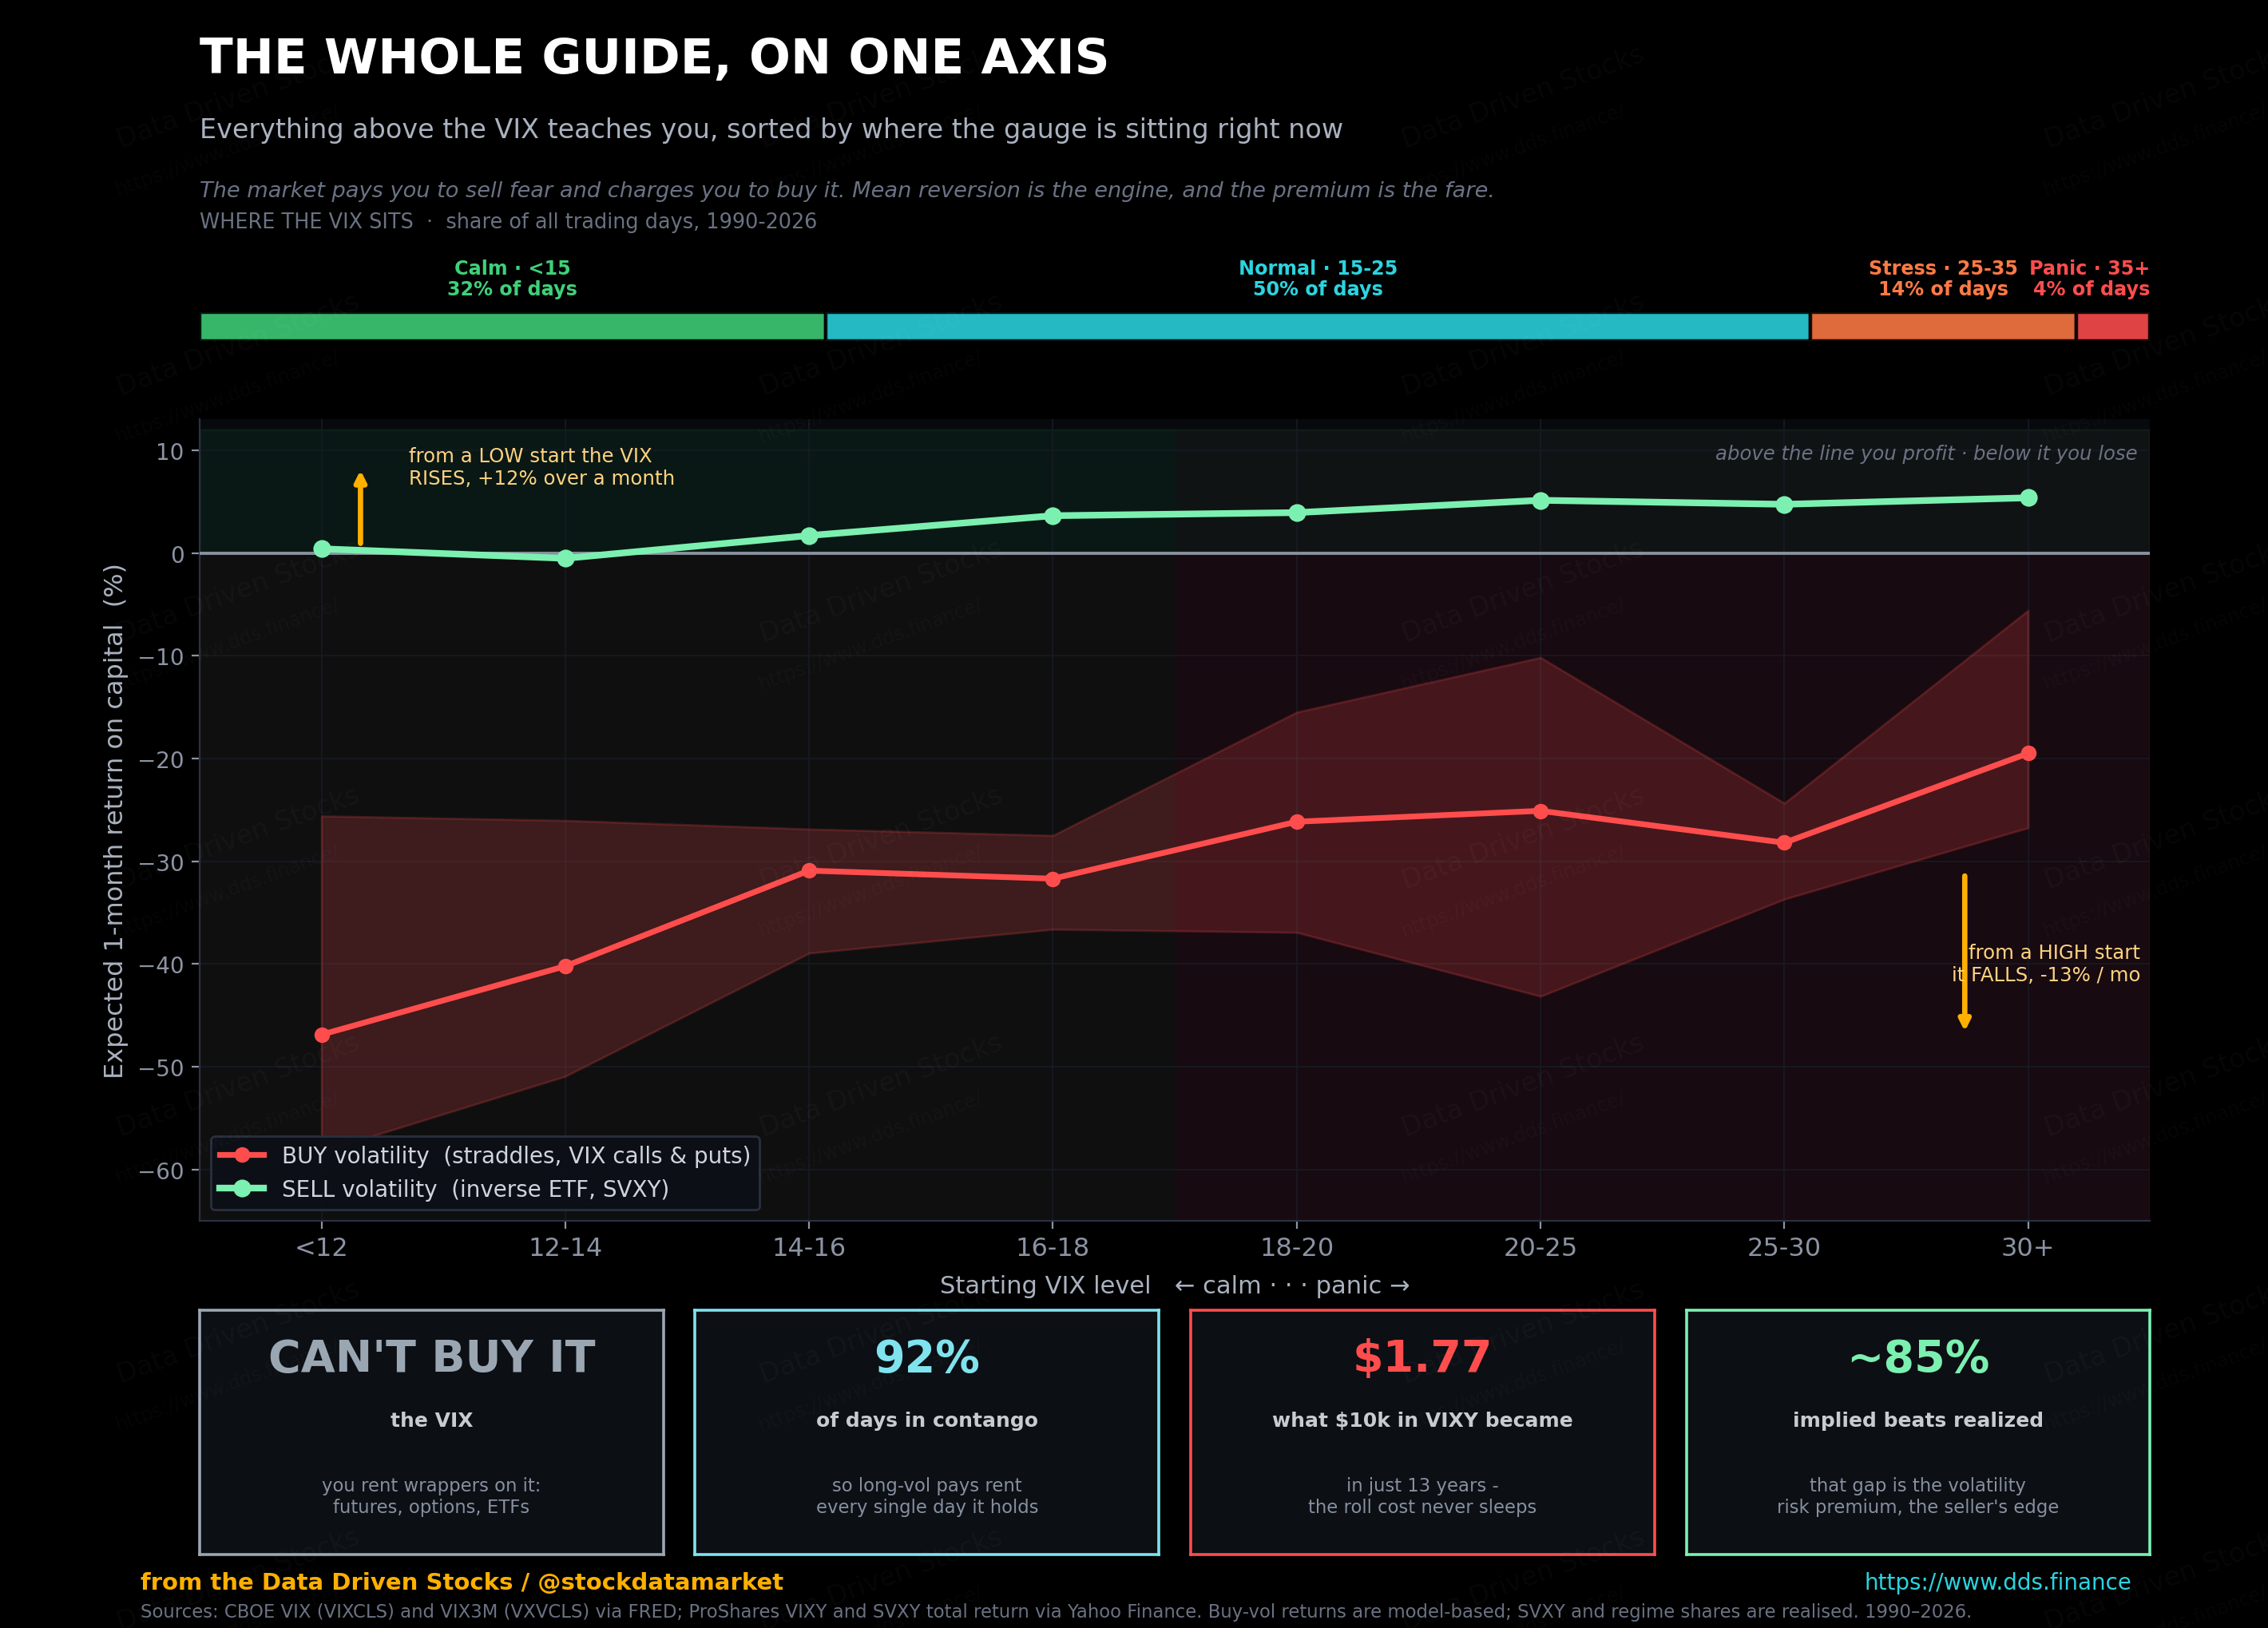
Put the last four sections on a single chart and the whole game snaps into focus.
This is the single most useful picture in the whole series, so it is worth stating plainly. Buying volatility is a structural loser at nearly every VIX level, because you are paying a premium for a move the market has already priced. Selling volatility is a structural winner, because you collect that premium, and the collection is richest right after a scare when everyone wants protection at once. The catch is the one you already saw. The winning side is the side that blows up. The premium is real, and so is the crater. Every serious volatility strategy is just an answer to the same question: how do you keep collecting that premium without being standing there when the elevator drops.
7. A practical playbook: long the calm, fade the panic, respect the calendar
None of what follows is financial advice. It is the mental model that sits underneath most volatility trading, drawn straight from how the gauge actually behaves. And it starts from one property we can measure directly.
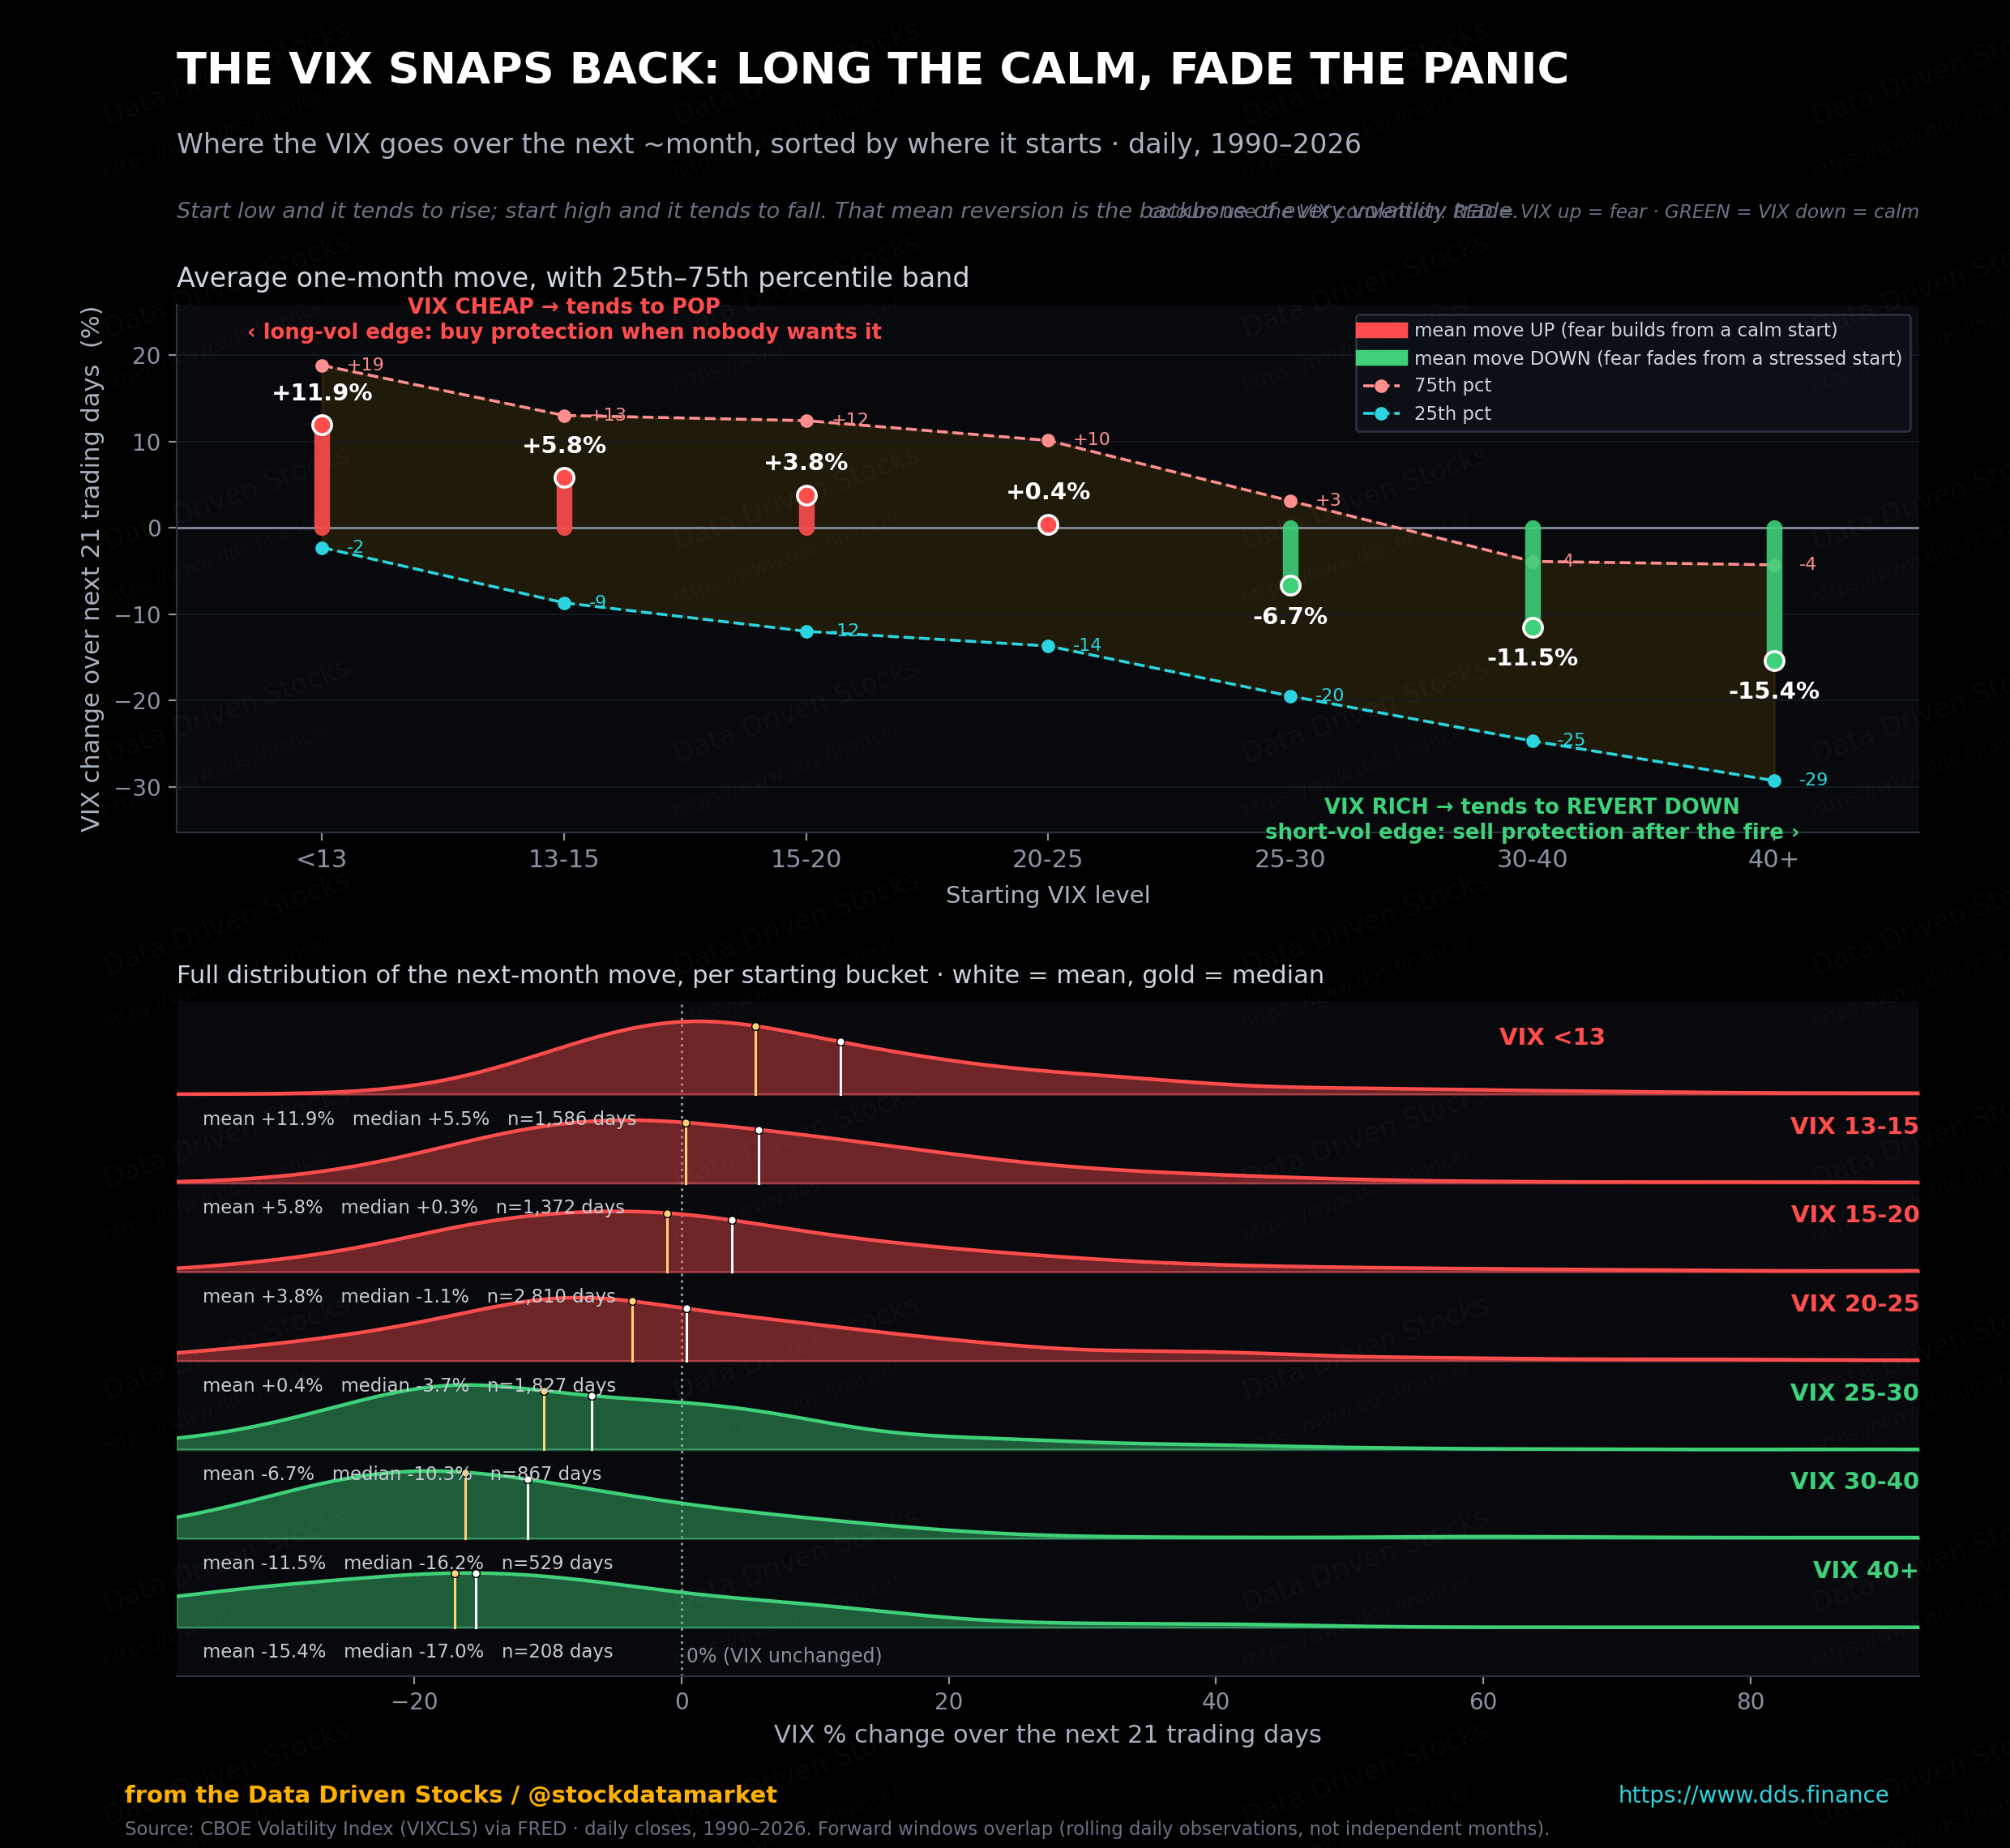
Read that chart left to right and the playbook writes itself. When the VIX is cheap, you are buying insurance nobody else wants, and history says it tends to pop from there. The reason it works is that volatility is not symmetric. Panic reprices far faster than calm builds. The cleanest ways to lean that direction are convex: calls or call spreads on VIX futures, long SPX straddles or strangles, anything that is long gamma. The cost is honest, though. Time decay never sleeps, and if nothing happens, you bleed while you wait.
When the VIX is high and the catalyst starts to fade, the trade flips. Insurance is expensive, the scare usually passes, realized volatility cools, and implied volatility drifts back toward its long-run home. That is the logic behind selling rich protection after the fire rather than before it. The caveat is brutal and worth repeating. Sometimes the shock is not a one-day scare but the start of a genuine regime change. Shorting volatility too early into one of those is how traders learn humility, and it is expensive tuition.
Then there is the fine print, which is not fine print at all. It is the entire business model. Short-dated VIX futures and the ETFs built on them lose value quickly in contango, because they are constantly rolling into pricier contracts and watching them converge down. Leverage adds daily compounding on top, which pulls longer-term returns away from the advertised daily target. Options carry their own calendar tax, with time decay going vertical near expiration and vega collapsing right when you feel most correct. And with VIX options, always remember they are European-style, priced off the future, and settled on a Wednesday-morning print.
Here is the sentence to keep. If you treat any of these products like a long-term holding, you are not investing. You are paying rent. The whole game is knowing which side of that rent you are on, and for how long.
That is the toolkit. The gauge tells you the weather, and now you know how to trade around it without mistaking the forecast for the sky. In the next part we will put these pieces together into the setups traders actually run, and walk through what the tape looked like the last few times the VIX went from quiet to loud.
Until then, if the number on your screen is low and calm, that is usually the interesting time, not the boring one. And when it’s very high it’s yet another opportunity.
This is analysis and education, not financial advice. Volatility products are complex and can lose value rapidl. Do your own work before risking money.
Sources and notes
Volatility index and term structure data: CBOE Volatility Index (VIXCLS) and CBOE S&P 500 3-Month Volatility Index (VXVCLS), retrieved from the Federal Reserve Bank of St. Louis (FRED). Daily closes.
Fund performance data: ProShares VIX Short-Term Futures ETF (VIXY), ProShares Ultra VIX Short-Term Futures ETF (UVXY), ProShares Short VIX Short-Term Futures ETF (SVXY), ProShares VIX Mid-Term Futures ETF (VIXM), and SPDR S&P 500 ETF (SPY), total-return series (split and distribution adjusted) via Yahoo Finance.
Product mechanics: CBOE methodology and educational materials for the VIX Index, VIX futures, and VIX options, including European-style exercise, pricing off the corresponding VIX future, and settlement via the Special Opening Quotation (SOQ) on the morning of expiration. Fund benchmark descriptions, daily rolling mechanics, leverage targets, and roll-cost disclosures from ProShares fund documentation and S&P Dow Jones Indices descriptions of the S&P 500 VIX Short-Term and Mid-Term Futures Indices.
Straddle payoff: computed with the Black-Scholes model at a 7,500 index level, 30 days to expiration, a 4 percent rate, and 16.6 percent implied volatility (approximately the current VIX), and verified against put-call parity.
Profitability backtests, by starting VIX level: all sorted into VIX buckets and measured over a 21-trading-day (roughly one-month) horizon, using overlapping windows, which means the observations are daily rather than independent months. The ETF results (VIXY long-volatility, SVXY short-volatility) are realized total returns from the fund data above, 2011 to 2026, and involve no model. The straddle result buys and holds a 30-day at-the-money S&P 500 straddle to expiry; the premium comes from the Black-Scholes at-the-money approximation (premium as a fraction of spot of about 0.798 times implied volatility times the square root of time to expiry) with the VIX as the implied-volatility input, and the payoff comes from the realized S&P 500 move over the window, 1990 to 2026. The VIX call and put results are model-based: options are priced with Black-Scholes on a mean-reverting VIX forward, where the forward is the conditional expectation of the VIX from an AR(1) model fit to the daily VIX series, evaluated at a constant vol-of-vol, and each option is settled against the VIX that actually realized 21 trading days later. These option figures are illustrative; the sign and shape of the result are stable across model choices, but the exact percentages depend on the pricing assumptions.
February 2018 volatility event: the VIX rose from 17.31 on 2 February 2018 to 37.32 on 5 February 2018, a gain of roughly 116 percent, per CBOE VIX data via FRED. The termination of the VelocityShares Daily Inverse VIX Short-Term ETN (XIV) and the scale of its single-day loss are documented in contemporaneous exchange and issuer disclosures and in subsequent academic analysis of the episode.
All figures were checked against source data before publication. Charts and diagrams by Data Driven Stocks.