Why the S&P 500 Sometimes Gaps Up - And Sometimes Doesn’t
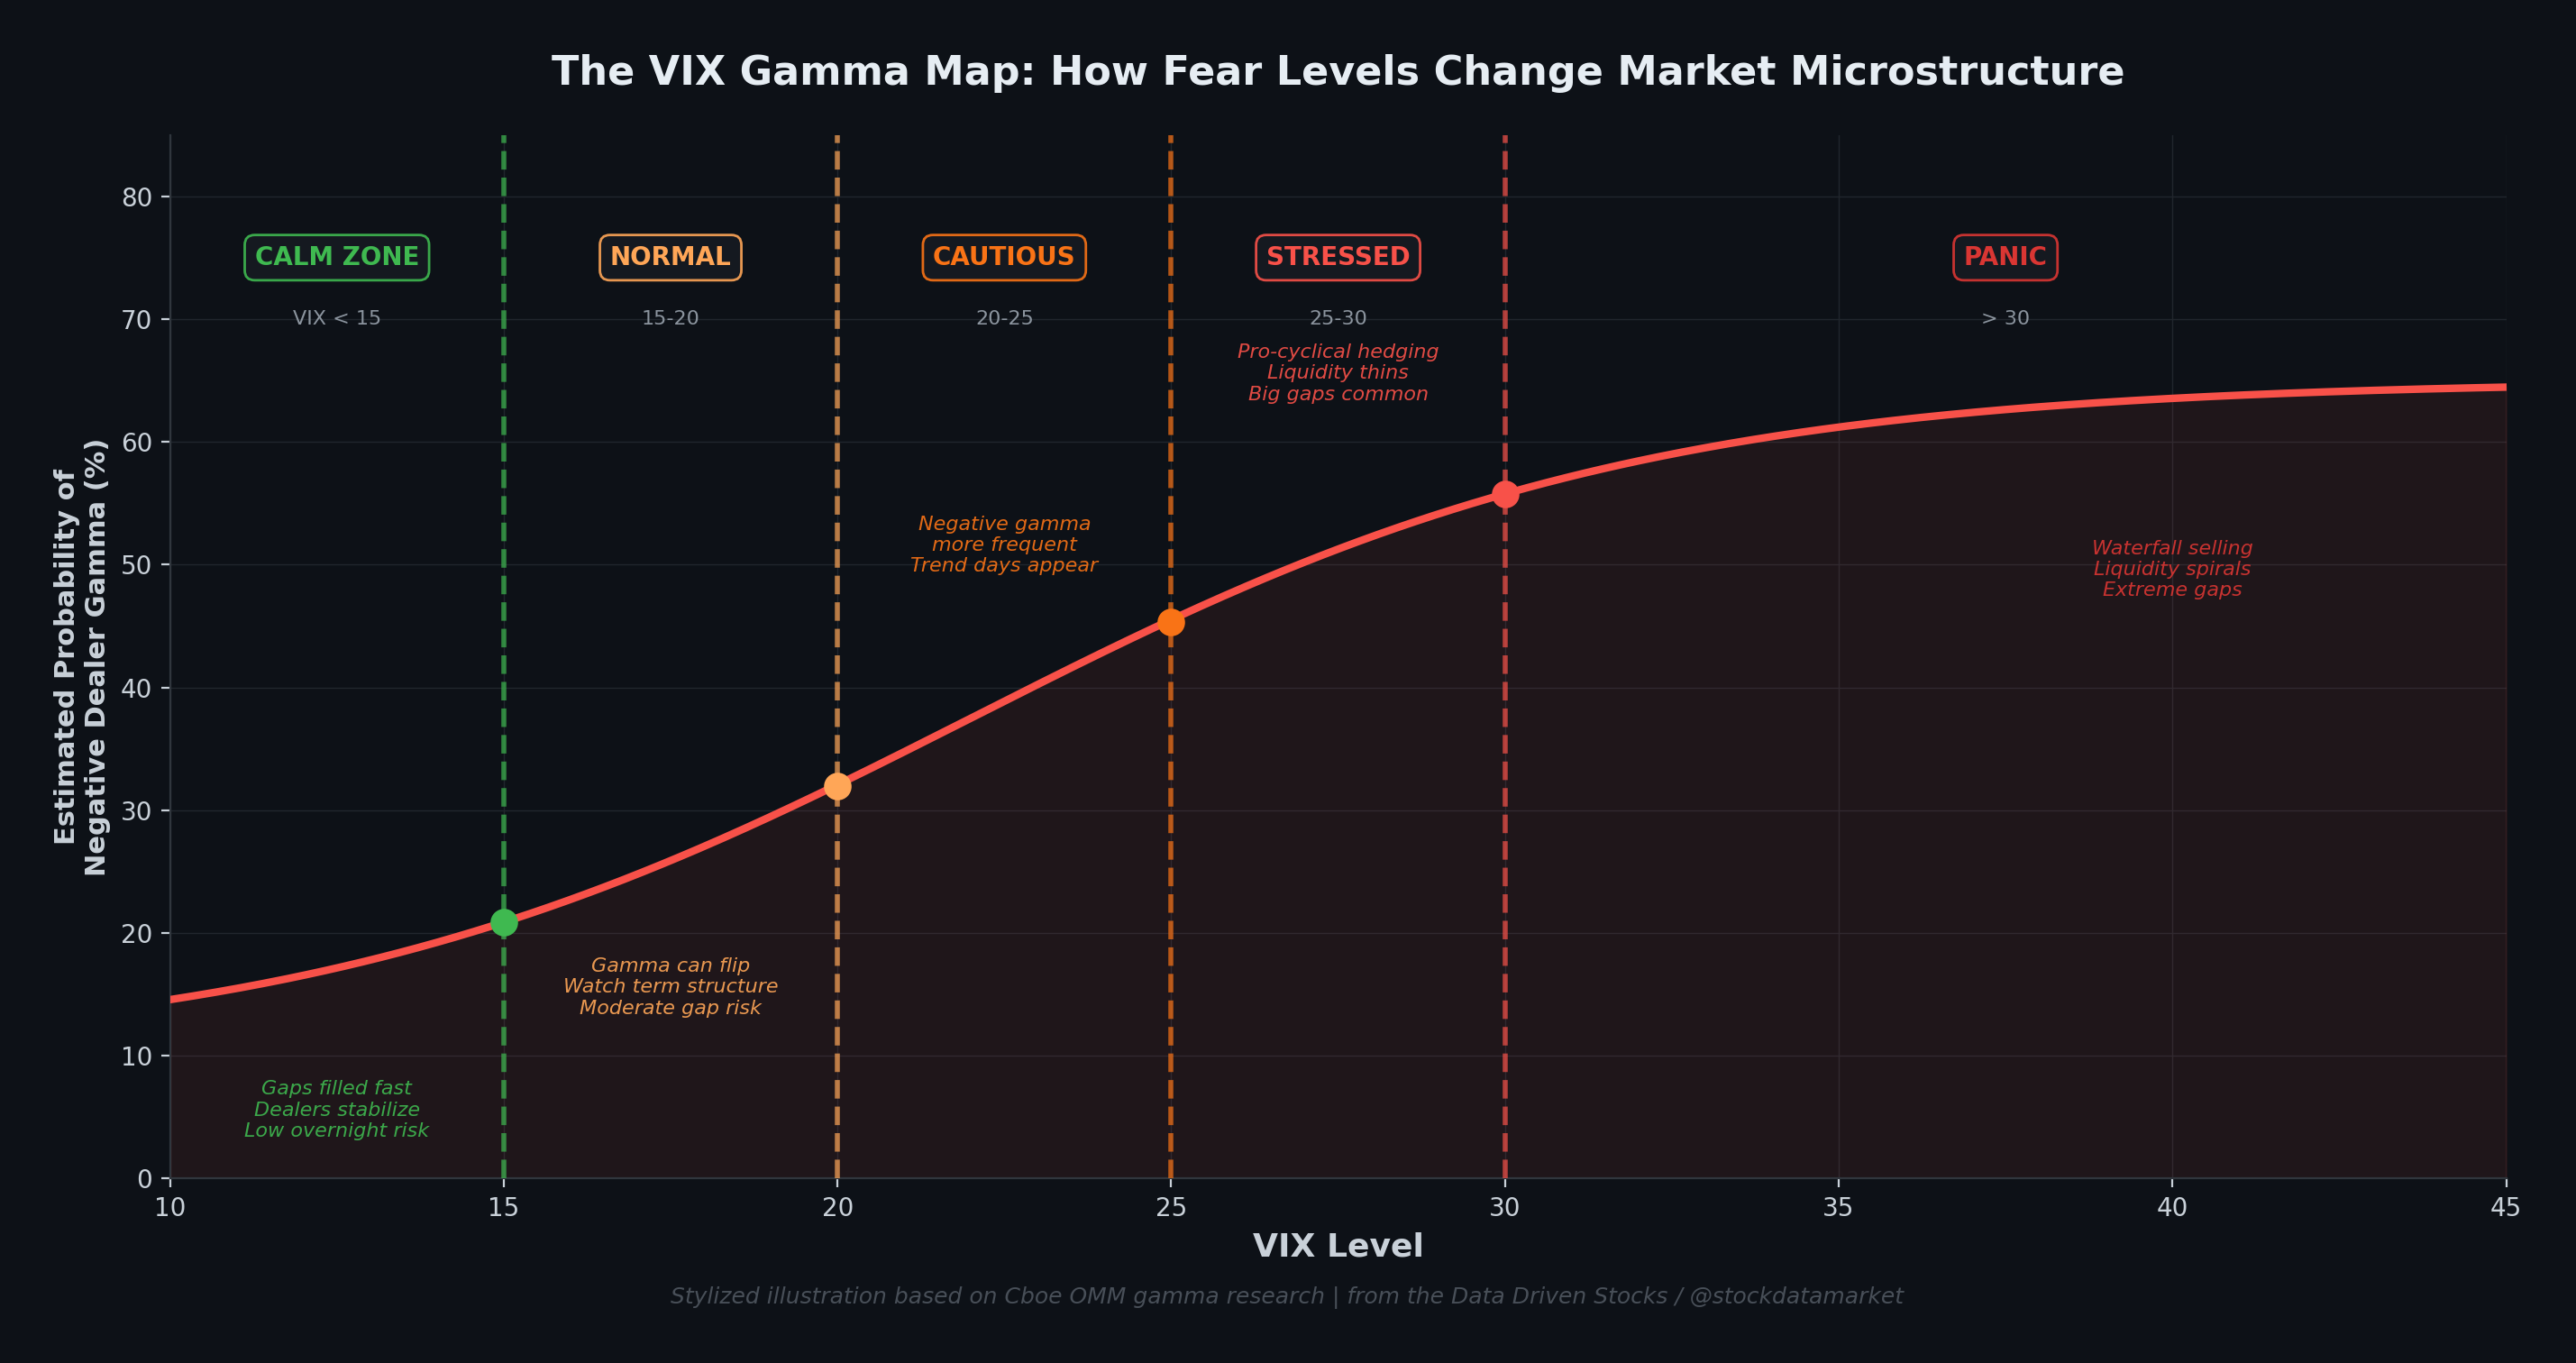
The VIX tells you more than you think about what happens at the open, midday, and close
Sometimes you see that the S&P 500 gaps down after a major draw down. But sometimes you see it does go down sharply near the close, only for the market to open flat or even higher the next morning. Other times, you get a nasty overnight gap down that looks like the end of the world at 9:30 AM, and by 4:00 PM the market has clawed back most of it. And then there are those days where the gap down at the open is just the appetizer, and the real selling doesn’t even start until 2:30 in the afternoon.
What determines which of these scenarios you get? The answer sits right in front of you, flashing on every trading screen in the world: the VIX.
But it’s not just the level of VIX that matters. It’s what that level implies about the hidden plumbing underneath the market, specifically, about where options dealers sit on the gamma spectrum and how their hedging flows either calm things down or pour gasoline on the fire.
Let’s break this down.
First, What Is a “Gap”?
Before we dive in, let’s make sure we’re speaking the same language. A gap is the difference between where the S&P 500 closed yesterday and where it opens today. That’s it. If the S&P closed at 5,000 yesterday and opens at 4,950 today, that’s a 1% gap down. If it opens at 5,050, that’s a 1% gap up. And when we talk about any gap, meaning the absolute size of the move regardless of direction, we’re measuring pure overnight uncertainty. Gap up, gap down, doesn’t matter. We’re asking: how much did the price jump while you were sleeping?
This distinction matters because gap ups and gap downs behave differently depending on the VIX regime. A gap down in a low-VIX world is a very different animal than a gap down when VIX is screaming above 30. Same with gap ups, a relief gap up after a high-VIX selloff carries entirely different follow-through characteristics than a gap up in a calm, grinding bull market.
The VIX Regime Framework: 15, 20, 25, 30, Why These Numbers Matter
The VIX is the market’s 30-day implied volatility gauge, calculated from S&P 500 option mid-quotes. Its long-run average hovers around 20–21. But different levels tell you dramatically different things about what’s likely to happen at the open, during the session, and into the close.
Using data from 2005 through early 2026, over 5,200 trading days, the numbers paint a vivid picture. When VIX sits below 15 (what we’d call the “calm zone”), the median overnight gap is a mere 0.18%. That’s nothing. You barely notice it. The 95th percentile worst-case gap in this regime is just 0.61%, and fewer than 1% of all low-VIX days see a gap exceeding 1%. Gaps above 2% simply don’t happen. The market opens roughly where it closed, day after day after day.

When VIX moves into the 15–25 range — the transition zone, things start shifting. The median gap doubles to 0.32%, the 95th percentile gap jumps to 1.15%, and now about 7.5% of days feature a gap exceeding 1%. This is where the market starts to get interesting and where many traders first realize that overnight risk is real.
But the real transformation happens when VIX crosses above 25. Now you’re in a different universe entirely. The median overnight gap leaps to 0.71% — nearly four times the calm-market level. The 95th percentile hits a jarring 2.74%. And here’s the number that should make you sit up straight: on more than one-third of all high-VIX trading days, the market gaps more than 1% overnight. Nearly 12% of those days see a gap exceeding 2%.

It’s Not Just About VIX — It’s About Gamma
Here’s where it gets deeper. VIX tells you the temperature of the market, how much implied volatility is priced in. But what really determines how the S&P 500 behaves intraday, especially around the open and close, is the gamma exposure of options dealers.
Option gamma measures how much a dealer’s hedge (their delta) changes when the underlying moves. When dealers are long gamma (positive gamma exposure), they’re natural stabilizers. Price drops? They buy. Price rises? They sell. They’re constantly fighting the move, dampening volatility, and creating that sticky, grinding, mean-reverting tape you see in calm markets.
When dealers flip to short gamma (negative gamma exposure), the opposite happens. Price drops and they have to sell more to stay hedged. Price rises and they chase it higher. They become amplifiers, not dampeners. This is the mechanism that turns a bad day into a terrible one, and it’s why the last hour of trading in a high-VIX environment can feel like the floor is disappearing.
Research from the Cboe using actual trade records confirms this isn’t just theory. Their analysis of options market maker gamma from 2020 to 2023 shows that aggregate dealer gamma is “typically positive but often negative,” and when negative, realized volatility rises measurably, by as much as 3.3 annualized vol points on daily measures and 6.4 vol points on intraday 30-minute measures. A separate study published in the Journal of Financial Economics found that “market intraday momentum” — the tendency of the market to continue its direction into the close, is much stronger when net gamma exposure is negative and is statistically weak or absent when it’s positive.
In other words, gamma sign tells you whether the last hour of trading is going to mean-revert or blow up.

But Wait, VIX Has Its Own Gamma Walls Too
Here’s something most people don’t think about: just like the S&P 500 has gamma exposure profiles at different strike levels (you’ve probably seen those horizontal bar charts from SpotGamma or Unusual Whales), the VIX itself is a massive options market with its own gamma walls at key strike prices.
VIX options are among the most actively traded in the world. And because VIX options exist across a range of strikes — 15, 20, 25, 30, 35, 40 — the gamma exposure at each of those levels creates invisible barriers that influence how VIX moves. These gamma walls don’t just describe some abstract positioning quirk. They directly determine whether a VIX spike stalls and reverses, or rips through and accelerates into the next level, which in turn dictates whether the S&P 500 gaps, recovers, or collapses.
Think of it this way: VIX options dealers face the same gamma hedging dynamics that SPX dealers face, just applied to volatility itself. When there’s heavy call open interest at the VIX 20 strike, dealers who sold those calls need to hedge. If VIX approaches 20 from below, their hedging activity creates selling pressure on VIX — they effectively cap the spike. VIX gets “pinned” near the strike. This is why you often see VIX approach 20 and just... stall there for a while. It’s not magic, it’s gamma.
Recent analysis from Investing.com highlighted exactly this pattern: there was a significant amount of call gamma built up at the $20 strike in VIX, with the VIX in positive gamma and additional positioning around 22. With VIX trading near 19.9 at that point, it faced strong resistance above $20 and could even see selling pressure if it spiked early.

The Key VIX Gamma Walls and What Happens When They Break
The VIX 15 Put Floor. Below VIX 15, put open interest creates a structural floor. Dealers who sold puts at 15 must buy VIX (or equivalents) as it drops toward that level, creating upward pressure. This is one reason VIX rarely crashes below 12–13 for extended periods — there’s a gamma cushion underneath. For S&P 500 traders, this means when VIX is near 15, overnight gap risk is minimal, mean reversion dominates, and you’re in the calmest regime possible.
The VIX 20 Call Wall — the Big One. This is typically the single largest concentration of gamma in the VIX options market. The 20 strike acts like a magnet and a ceiling simultaneously. When VIX is below 20 and rising, call gamma at 20 creates resistance. Dealers sell into VIX spikes as it approaches, absorbing the upward momentum. This is why so many VIX spikes stall at or just above 20 — the gamma wall literally holds it there. For the S&P 500, a VIX that stalls at 20 means the fear spike is being contained, dealer gamma in SPX likely remains positive, and the gap-down risk for the next morning stays moderate.
But when the 20 wall breaks — when VIX punches through 20 with conviction, driven by a genuine fear catalyst — the gamma dynamics flip. Dealers who were short calls at 20 now need to buy VIX aggressively to hedge their suddenly in-the-money positions. Their hedging no longer caps VIX; it accelerates it. This is the gamma-driven “breakout” that practitioners talk about — once the biggest wall is breached, the path clears for a rapid acceleration toward the next wall.
The VIX 25 Stress Wall. If VIX blows through 20, the next major concentration of gamma sits around 25. This serves as the second line of defense. Some VIX spikes stall here as fresh call gamma creates temporary resistance. But 25 is where the character of SPX trading changes dramatically — as we showed earlier, more than a third of high-VIX days see overnight gaps exceeding 1%, and intraday momentum replaces mean reversion. If VIX stalls at 25 and then reverses, that’s often the signal for an S&P 500 relief rally. If it punches through, you’re heading into real trouble.
The VIX 30 Fear Barrier. The gamma wall at 30 is the final major defense line before crisis territory. When VIX approaches 30, the call gamma concentration here, combined with the fact that VIX above 30 historically represents extreme conditions, creates meaningful resistance. Many VIX spikes peak somewhere in the 28–32 range precisely because of this gamma friction. And when VIX hits 30 and reverses, it tends to reverse hard, because the same gamma dynamics that capped the rise now accelerate the decline. Dealers who were frantically buying VIX at 30 are now selling it as it pulls back, creating a “gamma reversal” that can pull VIX back to 25 in a matter of hours.
For the S&P 500, a VIX rejection at 30 is often the capitulation signal. It means the fear spike was absorbed, dealer hedging flows are shifting, and the next morning is more likely to see a gap up or at least a sharply reduced gap down compared to what the prior session’s selling might have suggested.
Above 30 — When All Walls Break :-( . In genuine panic events (think COVID in March 2020, when VIX hit 82; or the August 2024 flash spike), VIX blows through every gamma wall in succession. At that point, gamma dynamics become purely amplifying, every wall that gets breached accelerates the move to the next one. This is when you see VIX jump from 25 to 40+ in a single session and overnight gaps in the S&P 500 reach 3–5%.

Why This Matters for S&P 500 Gaps
The connection between VIX gamma walls and S&P 500 gap behavior is direct. When VIX is pinned at a gamma wall — say, sitting at 20 and unable to break higher — it means dealer hedging is successfully absorbing the fear spike. SPX dealers are more likely to remain in positive gamma territory, overnight gaps stay moderate, and any gap that does occur is more likely to get filled during the session.
When VIX breaks through a wall and accelerates, everything flips. SPX dealers shift toward negative gamma, overnight gap risk multiplies, and the gaps that occur tend to be gap downs that don’t get filled — they get worse as the session progresses, especially into the close.
The practical takeaway: before worrying about where the S&P 500 will open tomorrow, check where VIX is relative to its gamma walls. Is it stalled at 20? Is it breaking through 25? Did it just reject 30? The answer to that question tells you more about tomorrow morning’s gap than almost any other single data point.
The Key VIX Gamma Levels: 15, 20, 25, 30 and Above
Each major VIX threshold corresponds to a qualitative shift in how the market’s plumbing works. Think of these less as precise trigger points and more as zones where the character of trading fundamentally changes.
Below VIX 15 is the calm zone where dealers are overwhelmingly long gamma. Their hedging flows create a natural ceiling and floor for the market. Gaps tend to be tiny, and when they do occur, they get filled quickly during the session as dealers buy dips and sell rips. The market grinds, it doesn’t jump. Mean reversion is the dominant force, and “buying the dip” feels like free money (which, to be fair, it kind of is in this regime — the average daily S&P return runs around +15 basis points per day).
Around VIX 20 is where things start to get interesting. This is the long-run average, the line where the market’s mood shifts from “everything is fine” to “something might be brewing.” Dealer gamma can flip either way at this level. Some days they’re still net long and stabilizing, other days they’re net short and amplifying. The VIX futures term structure becomes important here as an early warning system — if it starts flattening from contango toward backwardation, the stress is building even if VIX itself hasn’t spiked yet. Gap risk roughly doubles compared to below-15, and the average daily return compresses to a meager +4.6 basis points.
At VIX 25 the regime change is real. Negative gamma episodes become significantly more frequent. Dealers who sold put protection to nervous investors are now sitting on positions that force them to sell into weakness. Liquidity starts thinning noticeably — bid-ask spreads in both the equity and options markets widen, and depth (the number of shares available at top-of-book) drops. Academic research documents that option spreads are materially higher when aggregate gamma inventory is negative, explaining up to roughly a third of daily spread variation. This is the zone where trend days start appearing regularly, where morning gaps don’t get filled, and where the afternoon session can carry momentum relentlessly in one direction.
VIX 30 and above is fear territory. Dealers are heavily short gamma because everyone and their mother is buying puts. Hedging flows become aggressively pro-cyclical. Liquidity can evaporate through what academics call “liquidity spirals” — where volatility forces dealers to widen spreads, which reduces depth, which makes prices more volatile, which forces dealers to widen spreads even further. The market’s natural shock absorbers have been completely overwhelmed. In this regime, the average daily S&P return runs at a brutal -24 basis points, annualized volatility hits 37%, and the market can experience the kind of multi-percent intraday swings that make headlines.

What Happens During the Trading Day: Open, Midday, and Close
Now let’s walk through how these gamma regimes actually play out across the trading session, because this is where it gets practical.
The Open (9:30 AM)
The open is where overnight information gets priced in, and it’s structurally the most fragile moment of the day. Opening auctions are empirically less liquid than closing auctions. In a low-VIX world, this barely matters, the gap is small, dealers absorb it easily, and within the first 30 minutes the market has settled into its groove.
In a high-VIX world, the open is a different beast. Three things collide at once. First, there’s the overnight gap itself, which as we’ve shown can be enormous (2%+ on a bad day). Second, dealers need to immediately rebalance their hedges to account for that gap, and in a short-gamma state, that means they need to trade with the move, selling if the market gapped down, buying if it gapped up, which amplifies the opening volatility. Third, short-dated options, especially zero-days-to-expiry (0DTE), have extremely large gammas near the money, so any strike-crossing in the first 30 minutes can trigger rapid, outsized delta rebalancing.
Here’s where it gets counterintuitive. When VIX is high and the market gaps down hard at the open, you sometimes see a brief morning bounce in the first hour or two. This is often what traders call a “dead cat bounce” or a short-covering rally. Shorts cover, some brave souls try to catch the bottom, and the immediate selling pressure from the gap-rebalance ebbs temporarily. But if dealer gamma is deeply negative, this bounce is fragile. It’s not backed by stabilizing flows — it’s just a pause in the selling.
The Midday Session (11:00 AM – 2:30 PM)
Midday is typically the quietest part of the session, even in high-VIX environments. The intraday volatility pattern follows a well-documented “U-shape”, high at the open, low in the middle, high again at the close. In a low-VIX regime, midday is almost boring. Spreads are tight, depth is good, and not much happens. If the market gapped down at the open, this is where mean-reversion flows from long-gamma dealers are doing their work, slowly buying the dip and pulling prices back.
In a high-VIX regime, midday is where you find out whether the morning move was real. If VIX starts pulling back during the late morning, if fear is subsiding, if the options market starts seeing some put sellers, you get a signal that the market might recover. The VIX and S&P 500 move inversely with roughly -0.74 correlation across all regimes, so a declining VIX during midday is a strong hint that buying is developing underneath.
But if VIX holds firm or creeps higher through midday, watch out. That means the hedging pressure hasn’t abated. Dealers are still short gamma, the options market is still pricing in fear, and the table is being set for an ugly afternoon.
The Close (2:30 PM – 4:00 PM)
This is where gamma sign matters most. Closing auctions alone account for roughly 10% of daily trading volume and often offer lower price impact than continuous trading, which means a disproportionate amount of institutional rebalancing, benchmarking, and hedging flows are compressed into the last 90 minutes.
When dealer gamma is positive (low VIX regime), the close tends to be stabilizing. If the market drifted lower during the day, long-gamma dealers are still buying, and the closing auction tends to absorb imbalances without drama. Gaps from the morning often get filled by the bell.
When dealer gamma is negative (high VIX regime), the close becomes the most dangerous part of the day. The academic evidence is clear: intraday momentum, the tendency of the market to continue its direction from midday into the close, is much stronger on negative-gamma days. This means if the market has been selling off through midday, the final 90 minutes are likely to bring accelerating selling as dealers chase hedges, vol-targeting funds reduce exposure, and momentum signals pile on. The market closes at its lows, setting up the potential for yet another gap the next morning.

The Four Scenarios: How VIX Behavior During the Day Tells You What’s Coming
Let’s put this all together into the practical scenarios that matter for traders.
Scenario 1: VIX Tanks at the Open. This is the relief trade. The market was scared, maybe VIX was elevated heading into the session, but something changed, a policy announcement, a better-than-expected data print, short covering. VIX drops sharply at the open. When this happens, it typically means put demand is falling and dealers who were short gamma are getting relief. They need to buy back the index (or futures) they had been selling as hedges, which creates a self-reinforcing rally. If VIX continues to fall through midday, this is a strong signal that the gap-up has legs. In low-VIX starting conditions, this barely registers as noteworthy. But if VIX was sitting at 28 and drops to 23 at the open, that’s a meaningful regime shift and the market can rally hard as the entire hedging dynamic flips.
Scenario 2: VIX Recovers (Falls) in the Middle of the Session. This is the “grinder” recovery. The open might have been ugly, maybe a gap down with VIX elevated - but during midday something stabilizes. Perhaps the options market starts seeing sellers of puts rather than buyers. VIX starts to leak lower. When this happens between 11 AM and 2 PM, it often sets up a positive close because the late-day hedging flows shift from amplifying (negative gamma, selling into weakness) to dampening (moving toward positive gamma territory). The overnight variance share - the amount of total daily risk that occurs outside regular hours - runs about 31% in low VIX and 39% in high VIX, so a midday VIX decline also signals that the next morning’s gap risk is declining.

Scenario 3: VIX Recovers (Falls) Into the Close. This is the best-case scenario for bulls. A falling VIX heading into the 3:00–4:00 PM window means dealer hedging pressure is easing at precisely the moment when the most liquidity and flow is compressed. The closing auction, which handles around 10% of daily volume, clears with less selling pressure. If VIX was falling and gamma exposure is shifting toward positive, the market has its best shot at closing strong, setting up a flat or positive gap the next morning. The research on end-of-day imbalances and subsequent overnight returns (from a New York Fed study) shows that the relationship between closing flow imbalances and overnight drift is amplified when VIX is higher, so a positive close in a high-VIX environment carries more signal than the same close in calm markets.
Scenario 4: VIX Goes Even Higher Into the Close. This is the nightmare. VIX rising in the final 90 minutes means fear is escalating into precisely the window where hedging flows are most powerful. Negative gamma is at its most destructive when combined with concentrated closing flows. Dealers must sell, vol-targeting systems must reduce exposure, and the momentum is relentless. The market closes at its lows, overnight risk surges (remember, 39% of variance happens outside RTH in high VIX), and the next morning opens with another gap down. This is how multi-day selloffs compound - not because of a single big event, but because the gamma feedback loop keeps feeding on itself session after session.
The Pre-Market Wild Card
One critical caveat on VIX: pre-market VIX readings can be misleading, especially in stressed environments. VIX is calculated from option mid-quotes, and when liquidity is thin - as it always is outside regular trading hours — bid-ask spreads in OTM puts can blow out and mechanically push VIX higher without any actual change in fundamental expectations.
The most dramatic example came on August 5, 2024, when VIX spiked roughly 180% to around 66 in the pre-market. The BIS documented that this spike was largely driven by bid-ask spread widening in less-liquid out-of-the-money puts, not by a proportionate increase in fear. VIX closed that day at 38.57 - still elevated, but less than 60% of the pre-market print. Remarkably, dealers actually had positive gamma exposure at the start of the regular session that day, showing that high VIX and negative gamma don’t always go hand-in-hand.
The lesson: don’t react to pre-market VIX spikes as if they’re gospel. Wait for the regular session to open, let the options market establish proper two-sided quotes, and then assess the true regime.
The Bottom Line
The S&P 500’s gap behavior - whether it gaps up, gaps down, or barely gaps at all - is not random. It’s a direct function of where VIX is sitting and what that implies about dealer gamma positioning. Below VIX 15, the market is a calm pool where gaps are tiny and get filled fast. Between 15 and 25, the system is transitional and you need to watch gamma closely. Above 25, you’re in a world where overnight gaps regularly exceed 1%, where intraday momentum replaces mean reversion, and where the close can be the most violent part of the day.
The four key scenarios - VIX dropping at the open, recovering midday, recovering into the close, or pushing higher into the close - each produce distinct market behavior that experienced traders can anticipate and position around. The trick is recognizing which regime you’re in before the move happens, not after.
VIX doesn’t just measure fear. It’s telling you who’s driving the bus - stabilizing dealers, or destabilizing ones - and whether the next gap is going to be an opportunity or a disaster.


