

WHEN IS THE BEST TIME TO ATTACK TAIWAN AND START THE WAR: AN ADVANCED TUTORIAL
You want to attack Taiwan - you are in a good place

Everyone talks about ships, missiles, and troop counts when discussing a potential Taiwan scenario. The talking heads on cable news love counting destroyers. Think tanks publish glossy PDFs full of satellite imagery and order-of-battle tables. But almost nobody talks about the single most important variable in any cross-strait military operation — the weather.
Here’s the uncomfortable truth that doesn’t fit neatly into a 30-second news segment: the Taiwan Strait is one of the most meteorologically hostile bodies of water on the planet for amphibious operations. It’s not just rough — it’s seasonally rough, in a pattern so predictable that it effectively functions as a natural defense system, one that Taiwan didn’t build but benefits from enormously. The data tells a story that no amount of military hardware can fully overcome: the Strait only opens its doors about two months a year.
Let’s dig into the numbers.
The Black Ditch
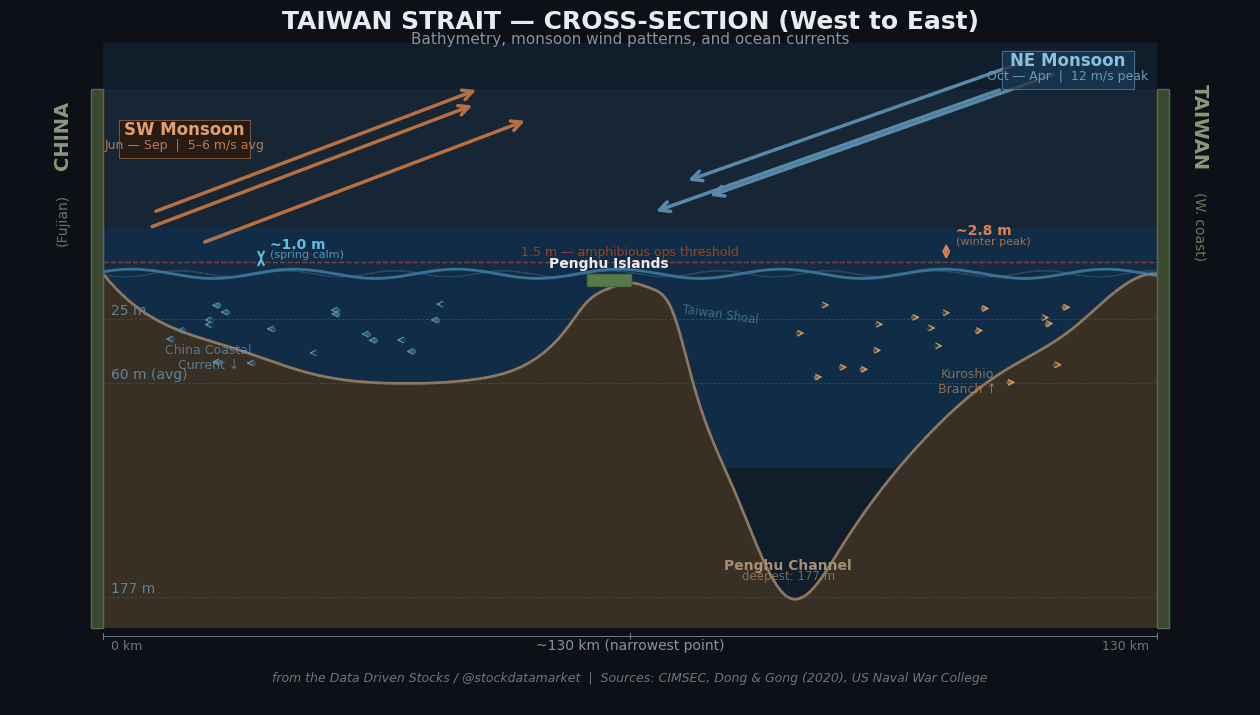
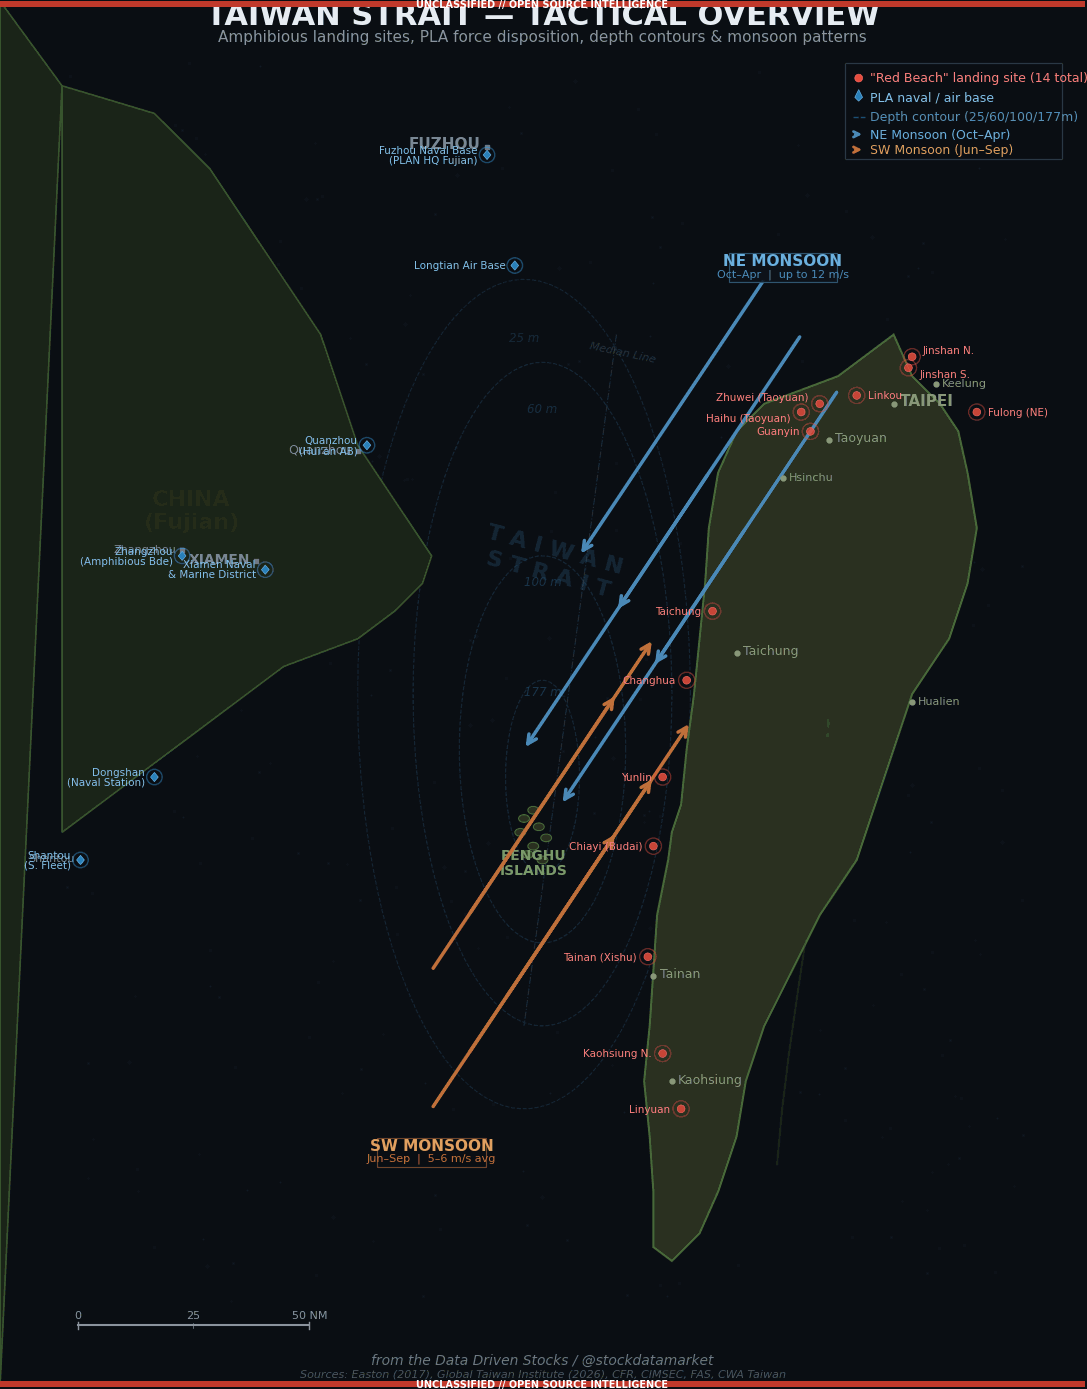
Sailors have called the Taiwan Strait the “Black Ditch” for centuries, and they didn’t mean it as a compliment. Stretching roughly 180 kilometers from northeast to southwest, with an average width of about 130 km at the narrowest point, the Strait sits at the intersection of two massive weather systems that take turns punishing it year-round. The average depth is around 60 meters, though the Penghu Channel plunges to 177 meters while the Taiwan Shoal in the south is barely 25 meters deep. This irregular bathymetry amplifies wave action and creates unpredictable currents that would complicate any large-scale naval movement.
According to the Center for International Maritime Security (CIMSEC), the Strait experiences Beaufort scale 6 or higher conditions — meaning sustained winds above 25 knots and waves exceeding 3 meters — roughly 156 days per year. That’s 43% of the entire year where sea conditions alone would make amphibious landings extremely dangerous. The Taiwan Strait isn’t just a body of water you sail across. It’s a gauntlet.
Two Monsoons, One Problem
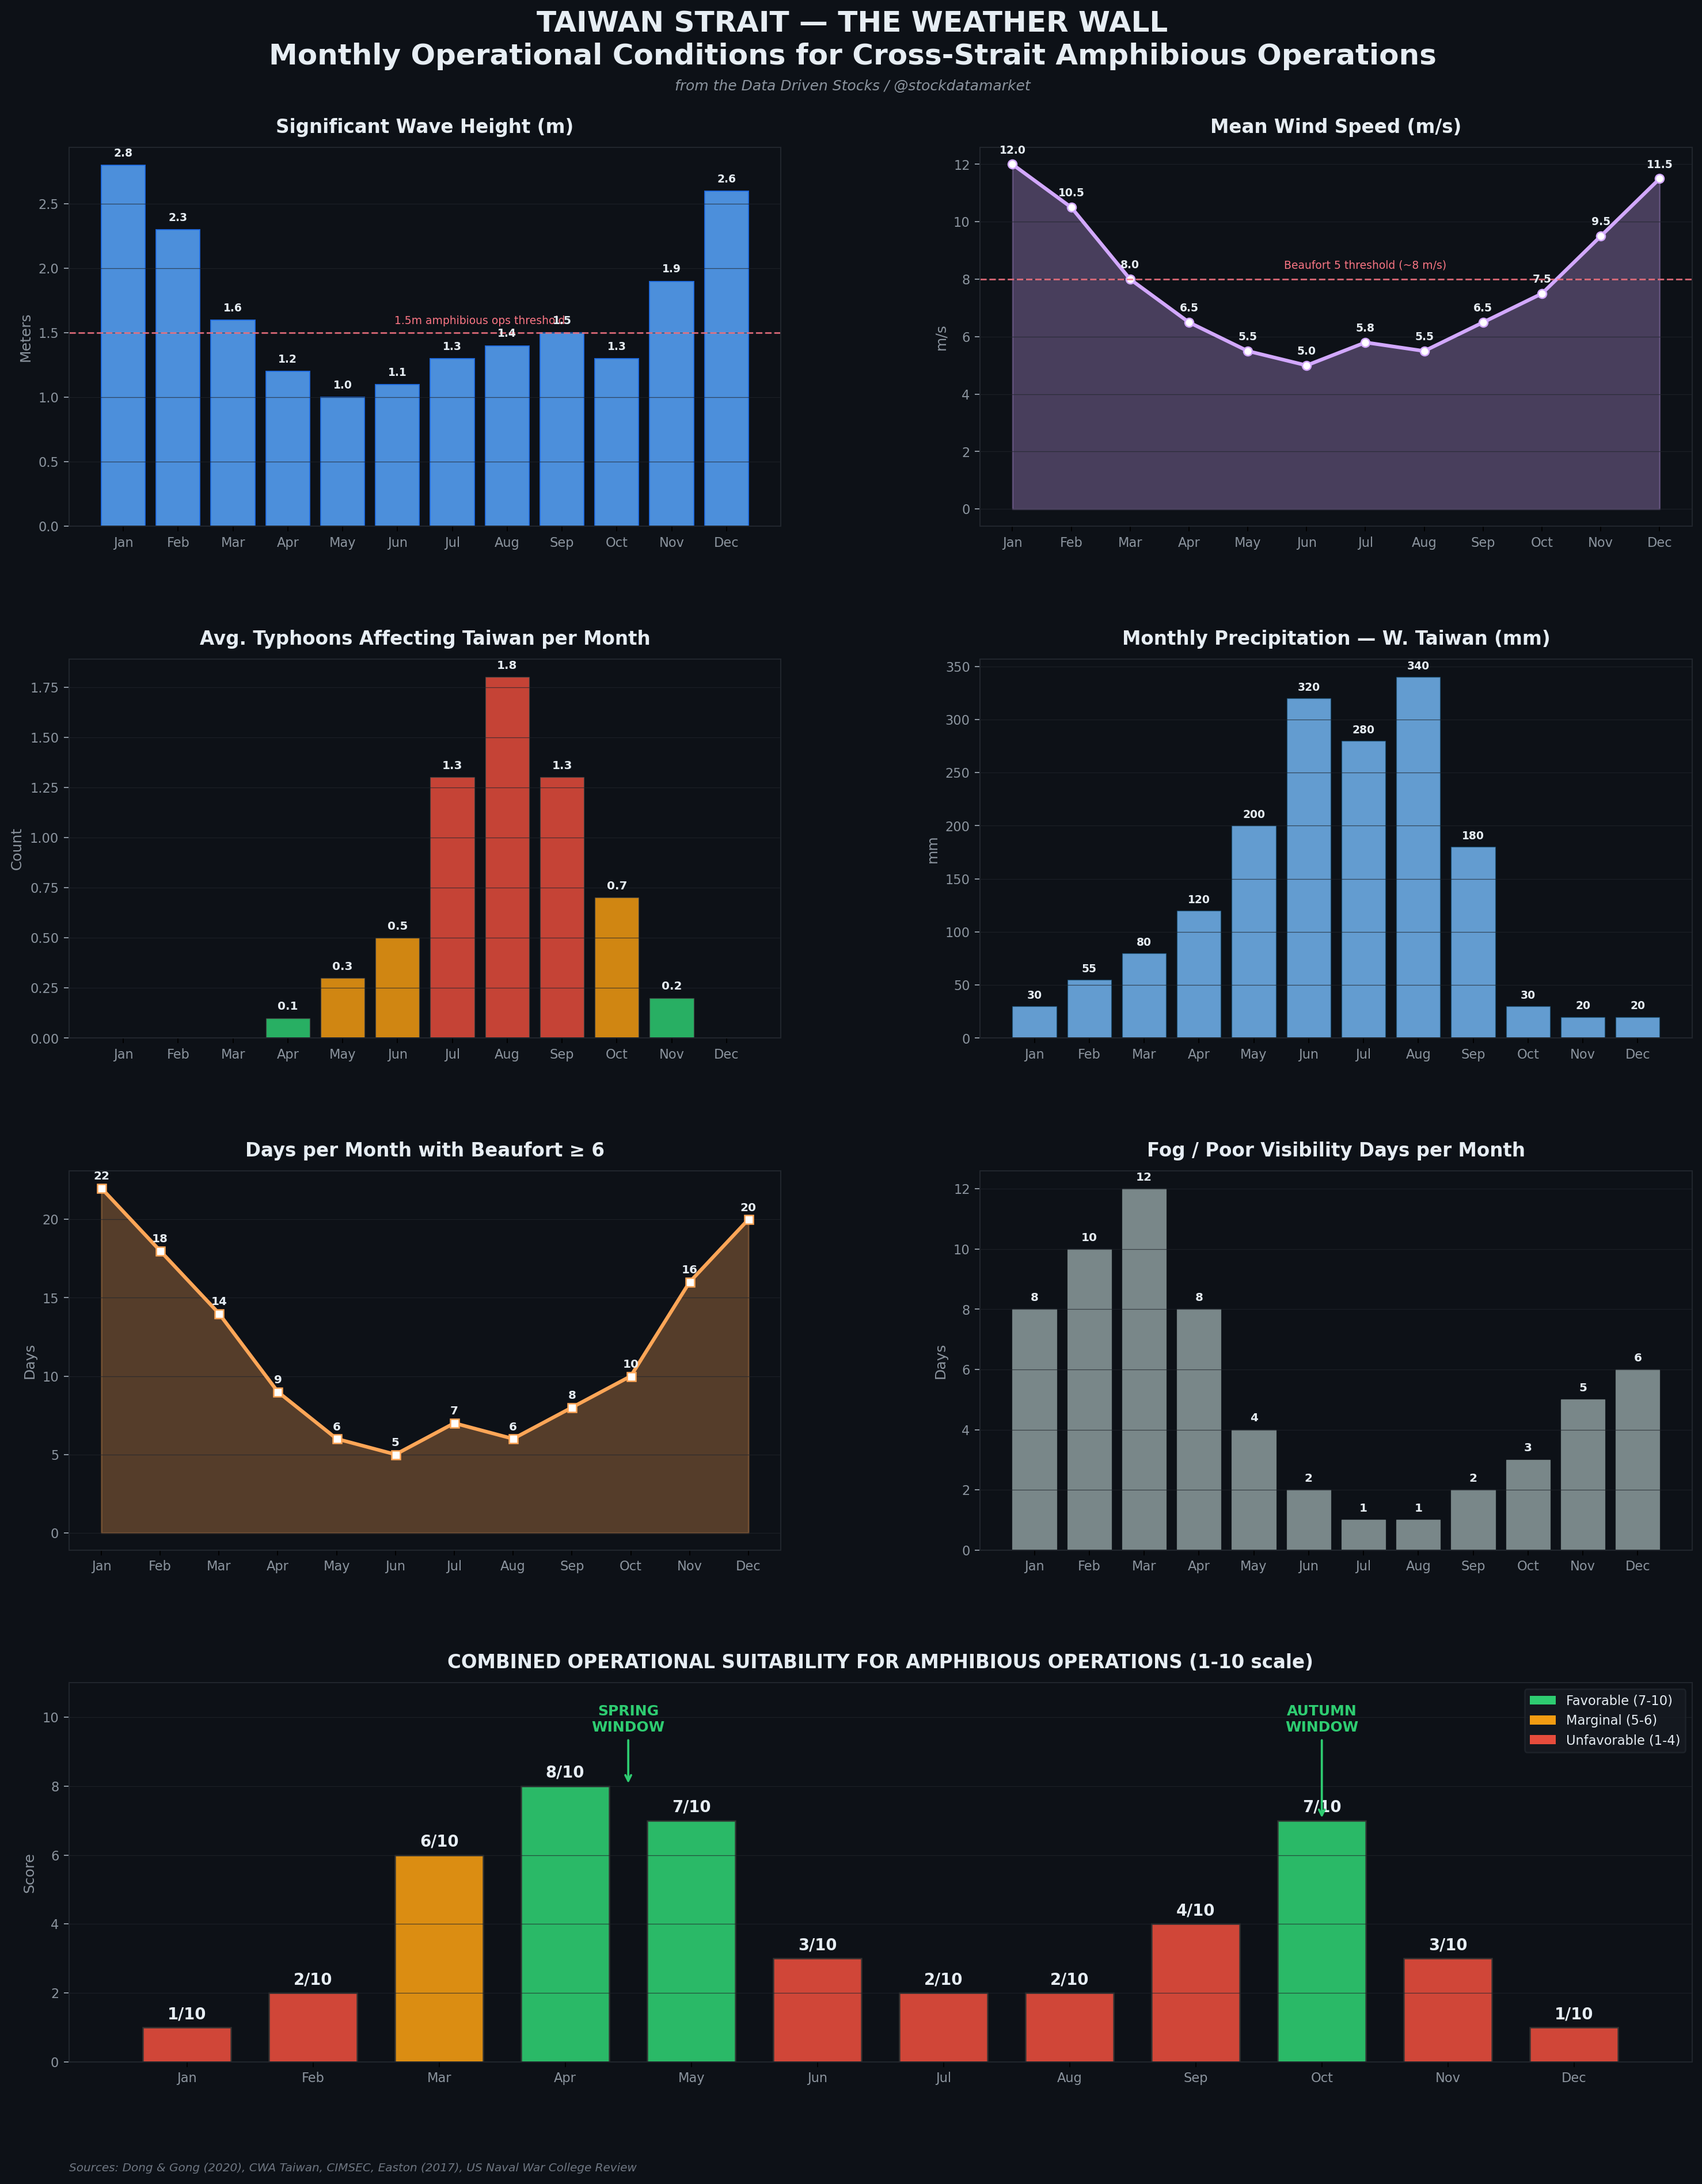
The Strait is governed by two monsoon systems that create a seasonal pincer effect. The Northeast Monsoon dominates from roughly October through April, driving cold, dry air masses down from Siberia and mainland China. This monsoon funnels through the Strait like air through a venturi tube, and the topographic channeling effect amplifies wind speeds significantly. Research from buoy stations within the Strait shows western waters averaging wind speeds of 8.83 to 13.03 m/s during winter months — approximately 1.5 to 1.8 times the summer averages.
Then from June through September, the Southwest Monsoon takes over, bringing warm, moist air from the tropical Pacific and South China Sea. While wind speeds during the SW monsoon are generally lower than winter (averaging 5-6 m/s), the real threat shifts: this is typhoon season, and the warm, moisture-laden atmosphere produces torrential rainfall that would degrade visibility, ground air support, and turn any beach landing zone into a mudfield.
The transition periods between these two monsoon regimes — roughly late March through May, and again in October — are the only windows where neither system dominates. And that’s where the data gets interesting.
Wave Height: The Landing Craft Killer
For anyone planning to send thousands of troops across water in flat-bottomed landing craft and roll-on/roll-off ferries, wave height isn’t just a comfort issue — it’s a survival issue. Modern amphibious assault vehicles and landing craft generally require significant wave heights below 1.5 meters for safe and effective operations. Above that, you start losing vehicles, troops get seasick to the point of combat ineffectiveness, and precision navigation to specific beach sectors becomes nearly impossible.
A landmark 30-year wave hindcast study (1988-2017) by Dong and Gong, published in the journal Ocean Engineering, provides the most comprehensive dataset available for the Taiwan Strait. Their findings paint a very clear picture: significant wave height peaks in January at approximately 2.8 meters and bottoms out around May at roughly 1.0 meter. The maximum wind speed in the Strait also peaks in January at around 12 m/s.
This means that from November through February, average wave conditions alone exceed the operational threshold for amphibious landings. You don’t need anti-ship missiles to stop a fleet in January — the ocean does it for free. The months of April, May, and October consistently show wave heights in the 1.0-1.3 meter range, well within the operational envelope for landing craft. These align almost perfectly with the monsoon transition periods — no coincidence there.
Typhoon Season: Nature’s No-Go Zone
If the monsoons define the broad seasonal patterns, typhoons represent the acute, catastrophic risk. Taiwan sits squarely in the path of Western North Pacific tropical cyclones, and the historical record is emphatic about which months are off-limits.
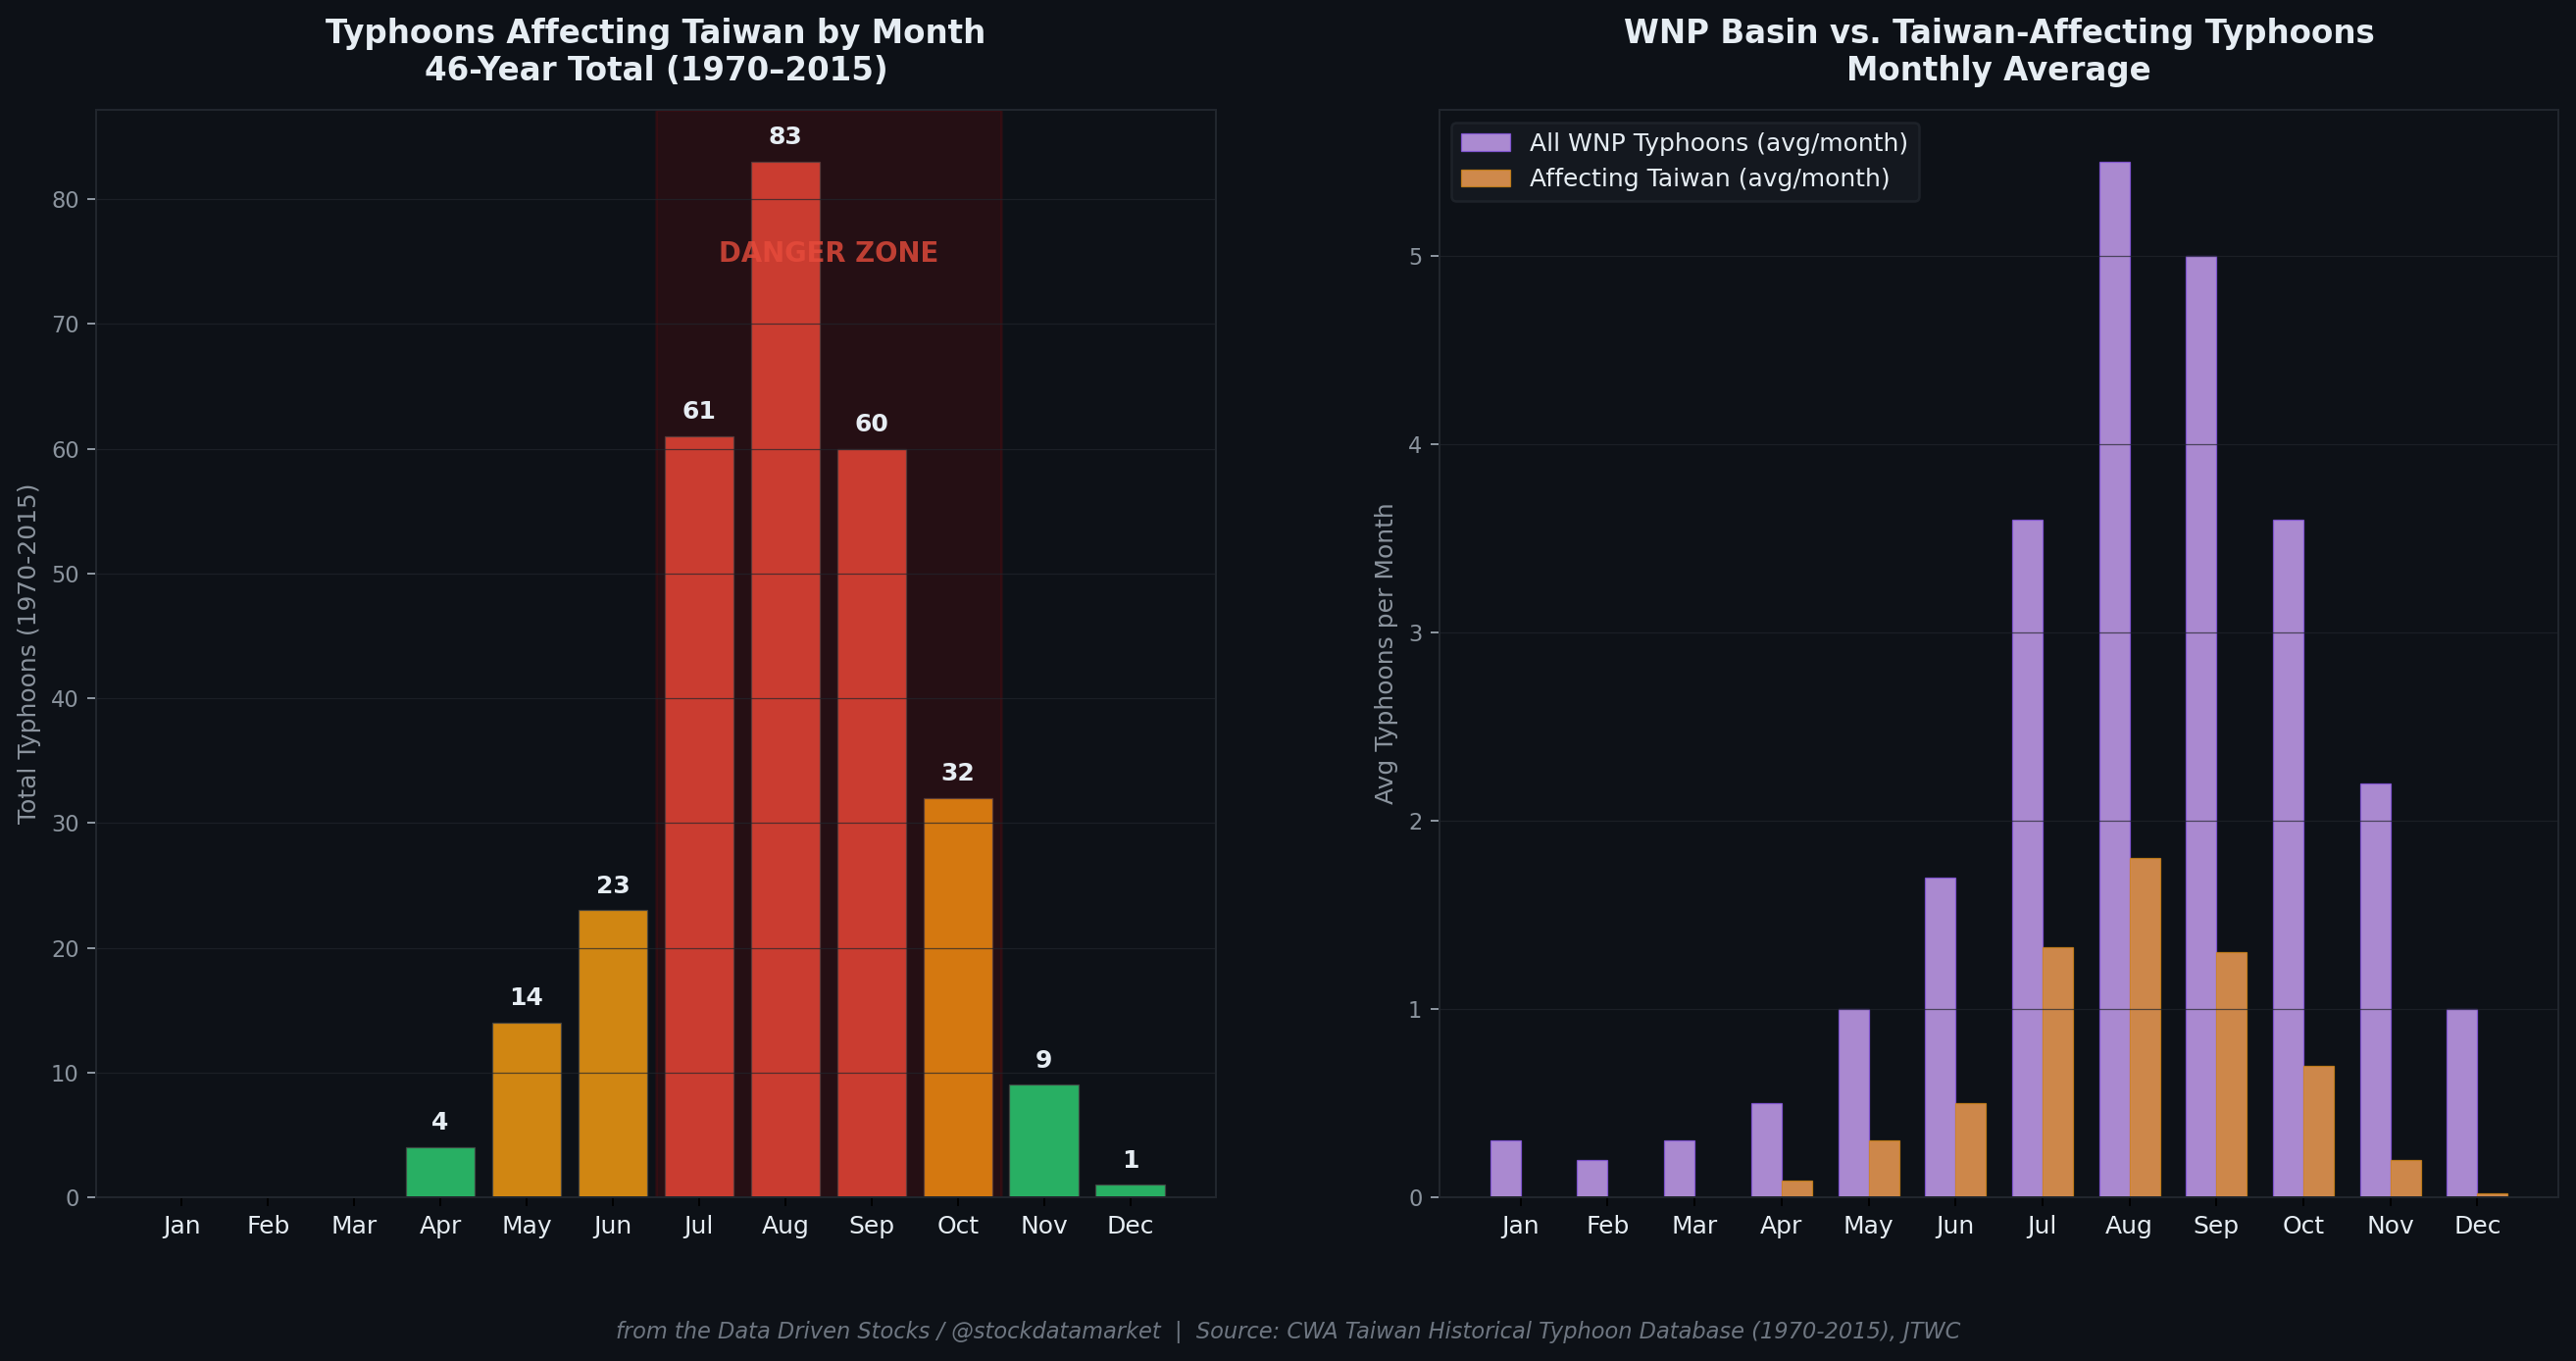
Data from Taiwan’s Central Weather Administration spanning 1970 to 2015 reveals that 83 typhoons affected the island in August alone during that 46-year period — an average of 1.8 per month. July and September were close behind at 61 and 60 respectively. The three-month window from July through September accounts for roughly 72% of all typhoons that have affected Taiwan in the modern satellite era.
What makes typhoons devastating for military operations isn’t just the storm itself — it’s the multi-day disruption. A typical typhoon affecting the Taiwan Strait region degrades sea conditions for 3-5 days before and after closest approach. The storm surge can add 1-2 meters to already elevated sea states. And critically, typhoons in the Western North Pacific are notoriously difficult to track more than 72 hours out with high confidence, meaning a fleet in transit could find itself caught in rapidly deteriorating conditions with nowhere to hide.
The October question is particularly nuanced. While October historically sees fewer typhoons than the summer peak (about 0.7 per month on average), the 2024 typhoon season put this in sharp relief: Taiwan experienced two powerful typhoons in October alone, an event that climate models suggest will become increasingly common as sea surface temperatures rise. Sust Global’s analysis projects an 8% increase in the probability of such two-typhoon Octobers by 2050, and 16% by 2080. October is becoming less reliable as an operational window with each passing decade.
The Beaufort Scale Reality Check
The Beaufort scale provides a useful shorthand for understanding what different wind conditions actually mean at sea level. For amphibious operations, Beaufort 5 (roughly 8 m/s or 17-21 knots) represents the practical upper limit for effective landing craft operations. Beyond Beaufort 6, seas become “rough” with wave heights of 2.5-4 meters, and small craft operations become extremely hazardous.
The Taiwan Strait logs Beaufort 6 or higher conditions on an estimated 22 days in January, 18 days in February, and 20 days in December. That’s effectively two-thirds of winter days where the sea state alone would prevent landing operations. The numbers drop dramatically in the spring transition: April sees roughly 9 days at Beaufort 6+, and May only about 6 days. Summer months hover around 5-7 days, but these are typically clustered around typhoon passages rather than distributed evenly.
The practical implication is straightforward. An amphibious force needs sustained favorable weather, not just a day or two of calm. You need clear windows of at least 7-10 consecutive days for the initial assault, reinforcement, and resupply chain to establish itself. In January, the probability of getting such a window is nearly zero. In April, it’s reasonable. In August, it would be reckless to count on it because even if the background sea state is manageable, a single typhoon can erase your timeline overnight.
Fog, Visibility, and the Air Support Problem
There’s a factor that gets even less attention than wave height: fog. The Taiwan Strait experiences significant fog, particularly from January through April, with March peaking at roughly 12 days of poor visibility per month. Fog disrupts close air support, helicopter operations, naval gunfire targeting, and the kind of precision coordination that a contested amphibious landing demands.
This creates a paradox for the spring window. While March offers improving sea conditions compared to winter (wave heights dropping to around 1.6m), the fog problem is at its worst. A fleet crossing in March might encounter adequate seas but find itself unable to call in air support or maintain visual coordination between assault elements. April resolves this somewhat — fog days drop to around 8 — and by May the visibility picture is excellent with only about 4 days of degraded conditions. The summer months (June through September) offer the best visibility, but of course, that’s typhoon territory.
Putting It All Together: The Two Windows
Ian Easton, in his extensively researched book The Chinese Invasion Threat, identified what the data confirms: the Taiwan Strait offers only two months of “good suitability” for cross-strait amphibious operations — April and October. A US Naval War College report expanded this slightly, identifying the windows as roughly May through July and October, though the summer months carry significant typhoon risk that arguably makes them marginal at best.
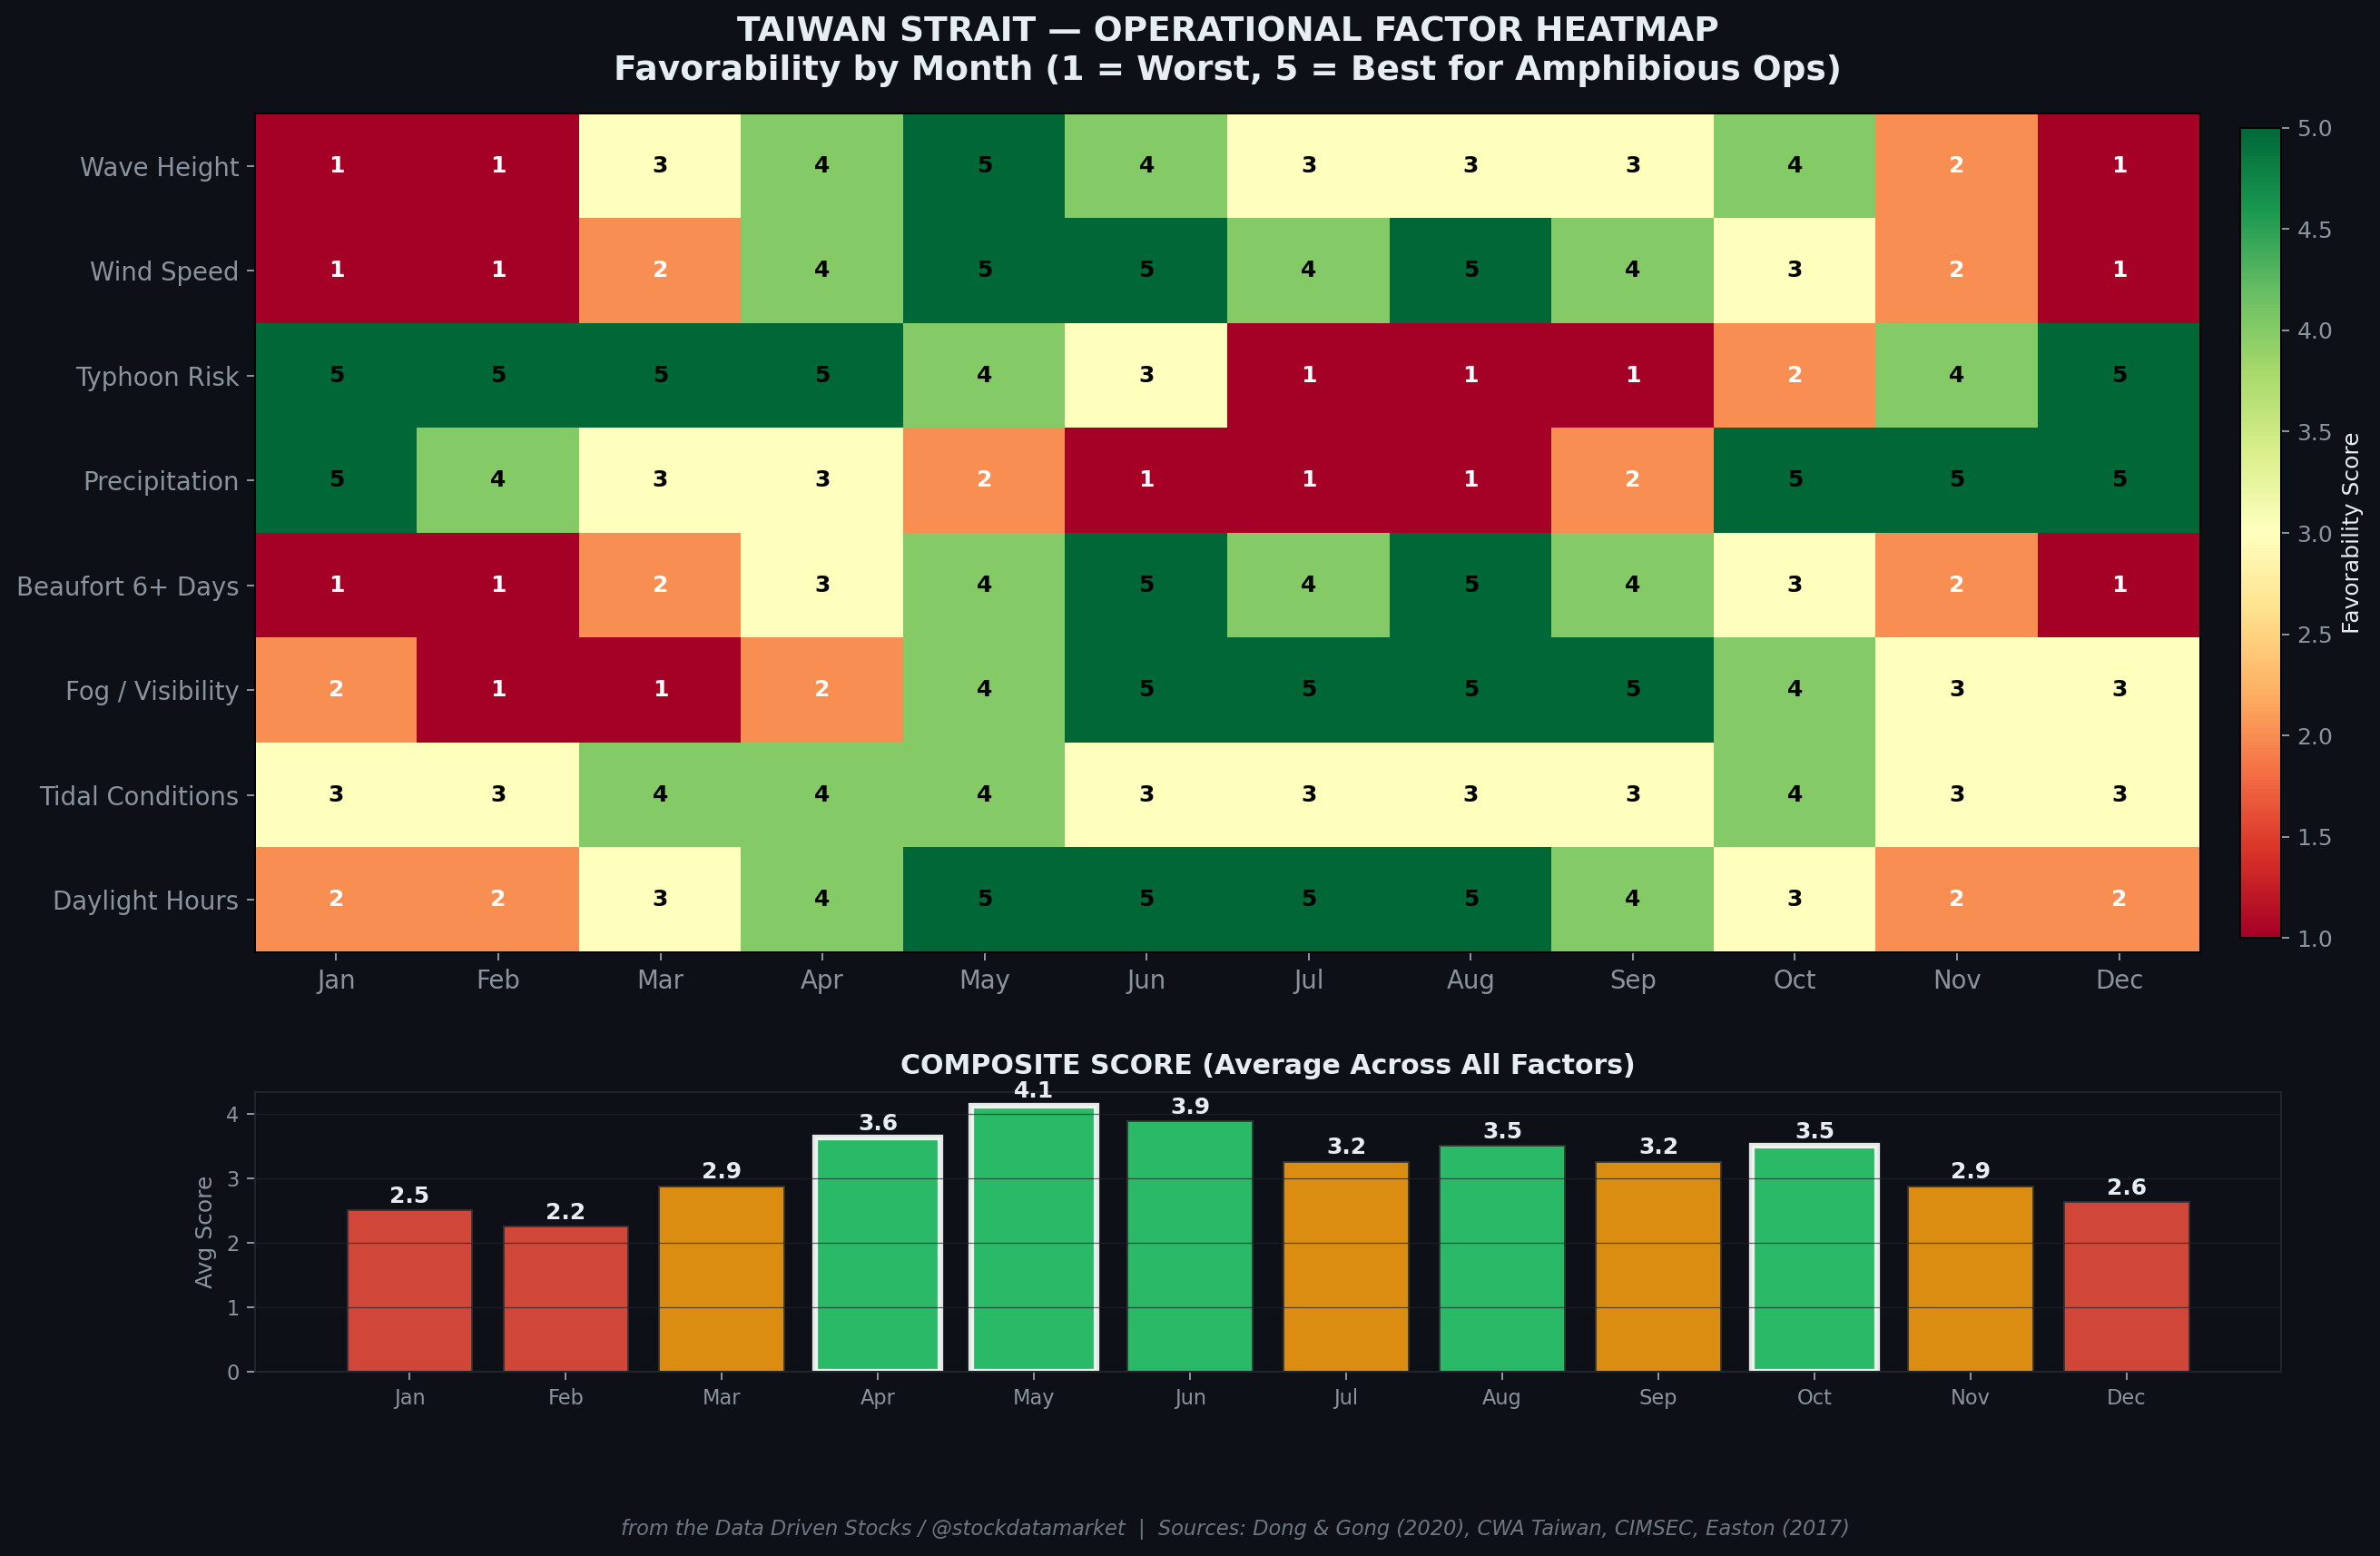
When you overlay every variable — wave height, wind speed, typhoon frequency, precipitation, Beaufort conditions, fog, tidal patterns, and daylight hours — the picture resolves into a remarkably narrow operational calendar. April scores highest across the composite of all factors: seas are calming after the NE monsoon, typhoon season hasn’t begun, fog is diminishing, rainfall is moderate, and daylight hours are increasing. May is nearly as good on most measures, though the leading edge of typhoon risk begins to appear.
October presents as the secondary window. The SW monsoon is fading, typhoon frequency is declining (though not negligible, as 2024 demonstrated), wave heights settle back toward 1.3 meters, and the NE monsoon hasn’t fully engaged. The catch is that October’s window is narrower and less reliable than April’s — it’s essentially a race against the returning NE monsoon and any late-season typhoon activity.
November through March is effectively a wall. The NE monsoon generates sustained high seas, powerful winds, and degraded visibility. June through September is dominated by typhoon risk and SW monsoon precipitation. The Strait doesn’t politely close for business — it slams shut.
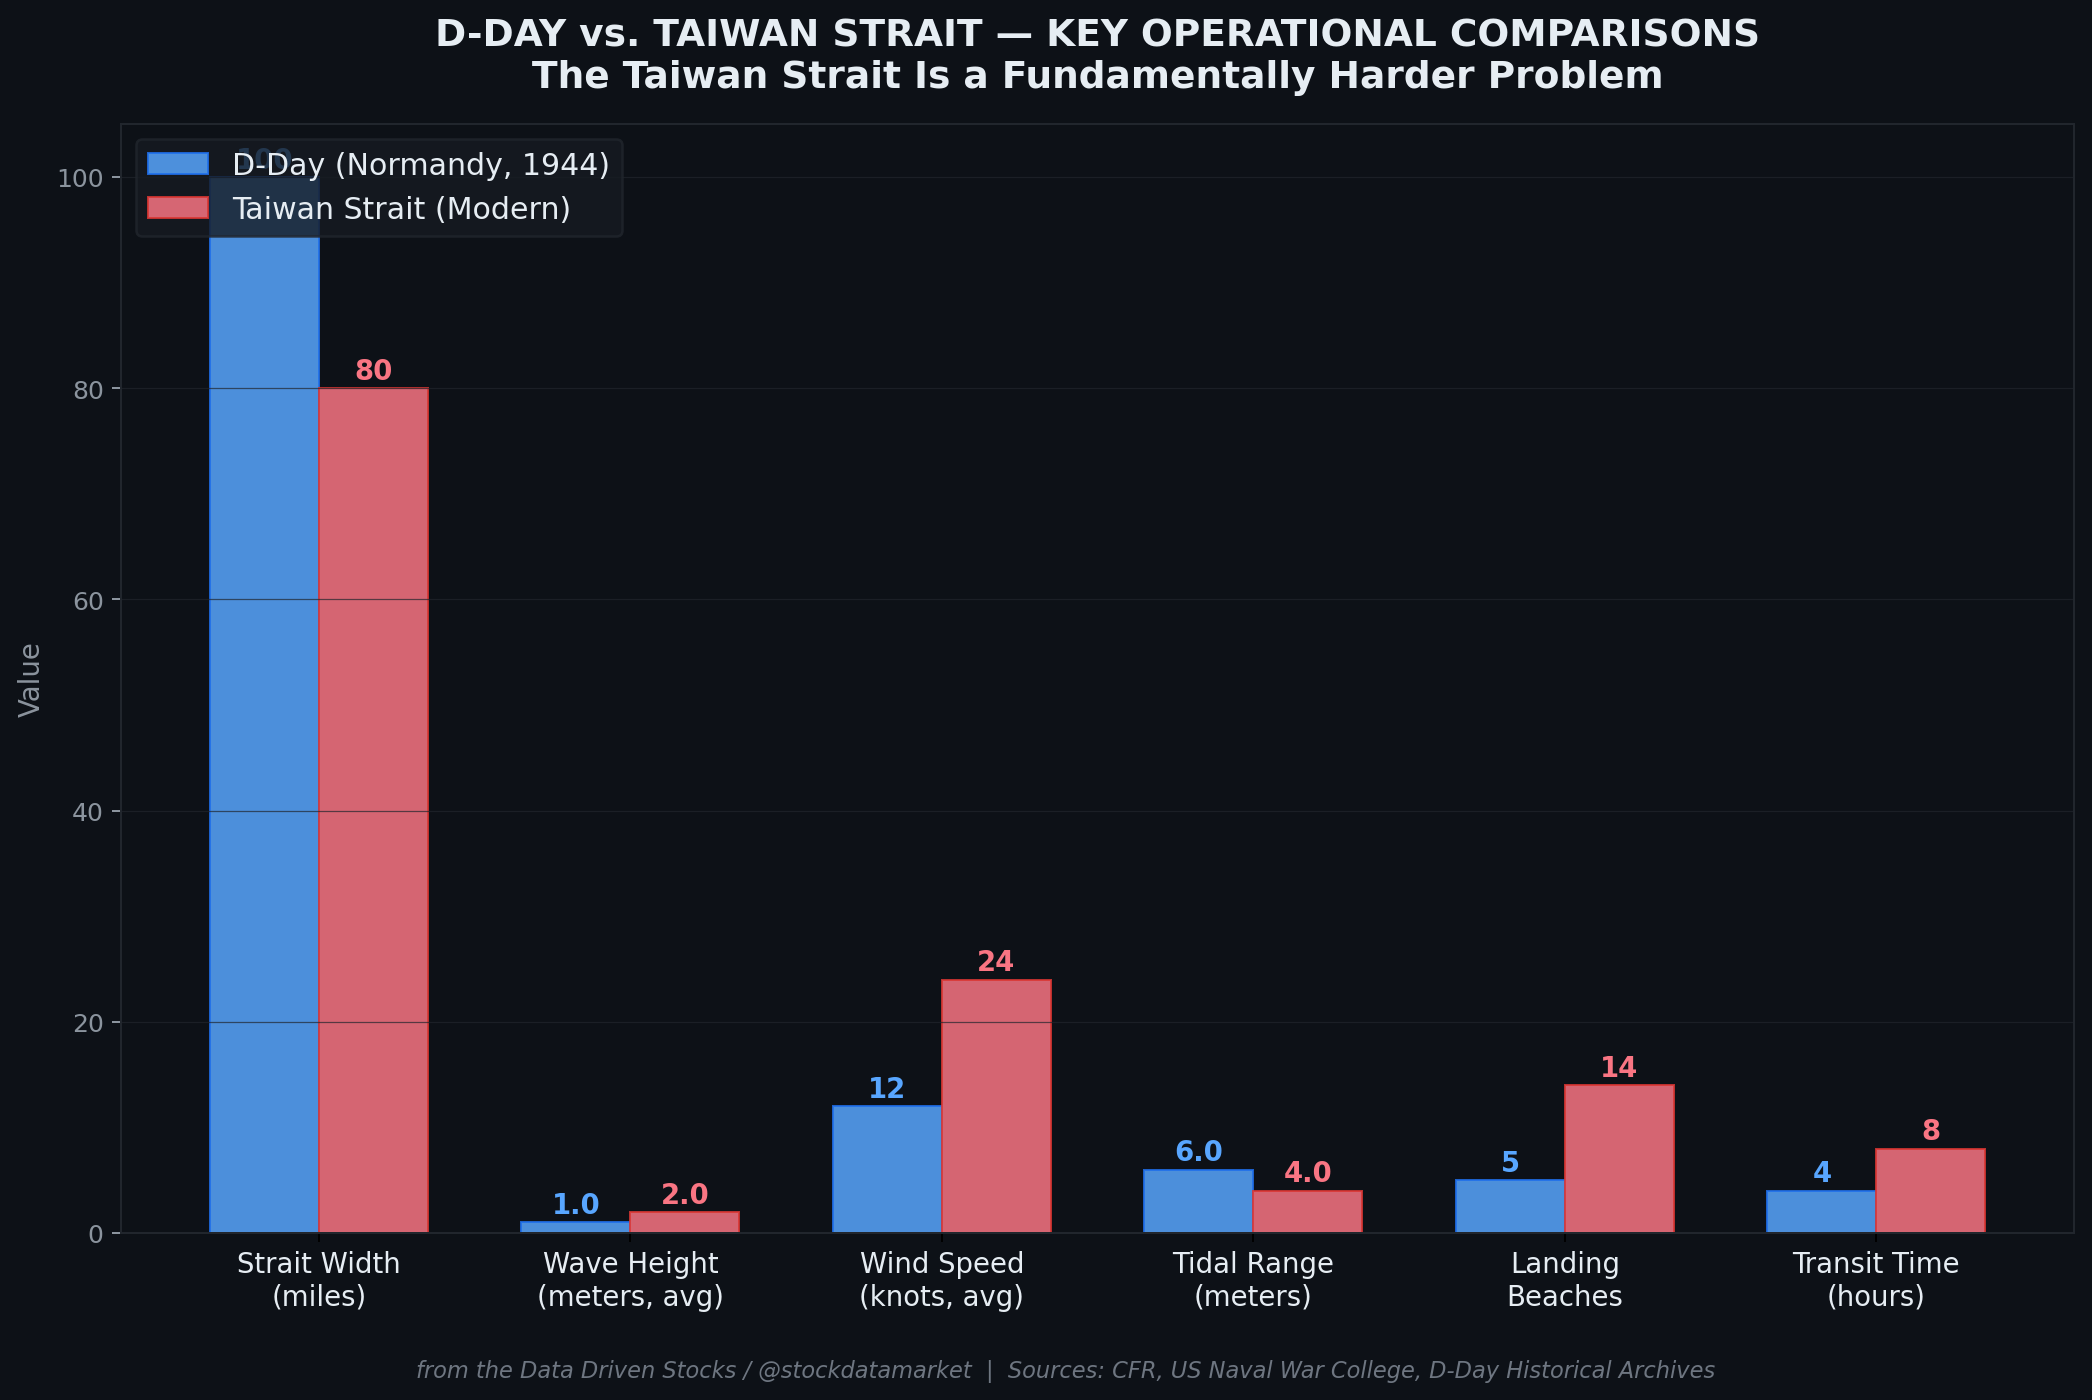
The D-Day Comparison Everyone Gets Wrong
Pundits love comparing a potential Taiwan invasion to D-Day. The comparison is useful, but not in the way most people think. The English Channel at Normandy is roughly comparable in width to the Taiwan Strait (about 100 miles vs. 80 miles at the narrowest). But that’s where the similarities end.
The English Channel’s average wave height during the D-Day period was around 1.0 meter — at the comfortable end of the amphibious operations envelope. The Taiwan Strait’s average, even during the best windows, runs 1.0-1.3 meters, and conditions can deteriorate rapidly. D-Day’s winds averaged about 12 knots; the Taiwan Strait during its monsoon-influenced months can sustain double that. The Channel has relatively predictable tidal patterns; the Strait’s tidal regime is complicated by the Penghu Islands, irregular bathymetry, and the interaction between the Kuroshio Current and the China Coastal Current.
And here’s the number that should give anyone pause: D-Day involved roughly 7,000 ships transporting about 156,000 troops on the first day, with 850,000 following over three weeks. A Taiwan scenario would require moving hundreds of thousands of troops, potentially millions of tons of equipment, across a more hostile body of water, with a much smaller operational window, against a defender who has had decades to prepare specifically for this contingency. Taiwan has only 12-14 beaches suitable for amphibious landing, all of which are known, fortified, and presumably pre-targeted with anti-ship missiles.
What Taiwan Knows (and Beijing Knows Taiwan Knows)
Taiwan’s defense planning has long incorporated the weather factor. The annual Han Kuang military exercises, which simulate a Chinese invasion, are typically conducted during the spring and autumn windows — precisely when an actual invasion would most likely occur. This allows Taiwan to focus its peak readiness on the months that matter most.
The Taiwanese military has also positioned its surveillance and early warning assets to exploit the long lead time that weather provides. Satellite imagery, weather buoys across the Strait, and SIGINT capabilities mean that any large-scale PLA mobilization during April-May or October would be immediately detected — and those are the only months when mobilization would make operational sense. The rest of the year, any troop movement toward the southeast coast can be reasonably assessed as exercises or posturing rather than imminent invasion preparation.
The PLA, for its part, has been incorporating civilian roll-on/roll-off ferries into its invasion planning to supplement its roughly 50-ship amphibious fleet. While this dramatically increases lift capacity, it also increases vulnerability to sea conditions. Military amphibious vessels are designed for rough water; a converted car ferry is not. These civilian vessels would be the first casualties of an unexpected weather deterioration during a crossing attempt.
The Climate Wild Card
One variable that’s shifting the calculus is climate change. Sea surface temperatures in the Western North Pacific have been rising steadily, and warmer waters fuel more intense (if not necessarily more frequent) tropical cyclones. The 30-year trend analysis by Dong and Gong found that both wind speeds and significant wave heights in the Taiwan Strait have been increasing over their study period, a trend consistent with broader climate patterns.
For operational planning, this means the already narrow windows could become even narrower. October, traditionally the autumn window, may become increasingly unreliable as the typhoon season extends later into the year. The 2024 season — with two October typhoons hitting Taiwan — may be a preview of the new normal rather than an anomaly. On the other hand, rising temperatures might slightly shorten the NE monsoon’s grip, potentially widening the March end of the spring window by a few days. But this is marginal — you’re talking about shifting the window by days or at most a week, not fundamentally altering the seasonal pattern.
The Bottom Line
The Taiwan Strait’s weather is not a footnote in cross-strait military analysis — it is arguably the single most important variable. Two monsoon systems, a vicious typhoon season, extreme Beaufort conditions for nearly half the year, persistent fog in early spring, and complex tidal patterns combine to create a natural defensive barrier that no amount of shipbuilding can fully overcome.
The data is unambiguous: April and October are the only months where all major weather variables simultaneously align to permit large-scale amphibious operations. Even within these windows, the margin for error is thin. A late typhoon, an early monsoon onset, or simply a week of unfavorable weather could derail an operation that requires months of preparation and involves the largest naval movement since World War II.
For investors monitoring Taiwan Strait tensions, this seasonality matters enormously. Watch for PLA activity ramping up in February-March (pre-positioning for a spring window) or August-September (preparation for an autumn window). If major military movements don’t materialize during these preparation periods, the next operational opportunity is months away. The weather doesn’t care about political timelines, nationalist sentiment, or Five-Year Plans. The Strait opens when it opens, and it closes when it closes.
Nature built Taiwan’s first line of defense. The data shows it’s still the most formidable one.
Disclaimer: This analysis is for informational and educational purposes only. It does not constitute investment advice or military planning guidance. All data is drawn from publicly available academic and institutional sources.
Sources
Dong, S. & Gong, Y. (2020). “Long-term variations of wind and wave conditions in the Taiwan Strait.” Ocean Engineering, 195.
Easton, I. (2017). The Chinese Invasion Threat: Taiwan’s Defense and American Strategy in Asia. Eastbridge Books.
Center for International Maritime Security (CIMSEC). “Navigating the Black Ditch: Risks in the Taiwan Strait.”
US Naval War College Review, Vol. 54, No. 4 (2001). “How China Might Invade Taiwan.”
Central Weather Administration (CWA), Taiwan. Historical Typhoon Database (1970-2015).
Council on Foreign Relations (CFR). (2024). “Why China Would Struggle to Invade Taiwan.”
War on the Rocks. (2023). “A Strait Too Far: How a Deliberate Campaigning Approach in the Pacific Can Make Beijing Think Twice.”
Sust Global. (2024). “Taiwan’s Increasing Threat of Cyclones: A Look at Frequency and Return Periods.”
Xu, X. et al. (2021). “Analysis of Wave Characteristics in the Central Taiwan Strait Based on Measured Data.” Journal of Tropical Oceanography, 40(1).
19FortyFive. (2025). “The Chinese Military Could Face a Taiwan Invasion ‘Nightmare’.”
Lethal Minds Journal. (2023). “Flashpoint Taiwan Part 2.”
Congressional Research Service (CRS). “Taiwan: Defense and Military Issues.” IF12481.
France 24. (2022). “A Chinese invasion of Taiwan: too costly to countenance?”
MDPI Journal of Marine Science and Engineering. (2025). “Analysis of Wind–Wave Relationship in Taiwan Waters.”