

What a $1.00 Option Really Means (How to Read Probability From Any Option Price)
The option market publishes its odds every few seconds. Most people never learn to read them. Ten minutes from now, you will.

Wherever you are, at some point you have opened an option chain, seen a call quoted at $1.00, and wondered what that number is actually saying.
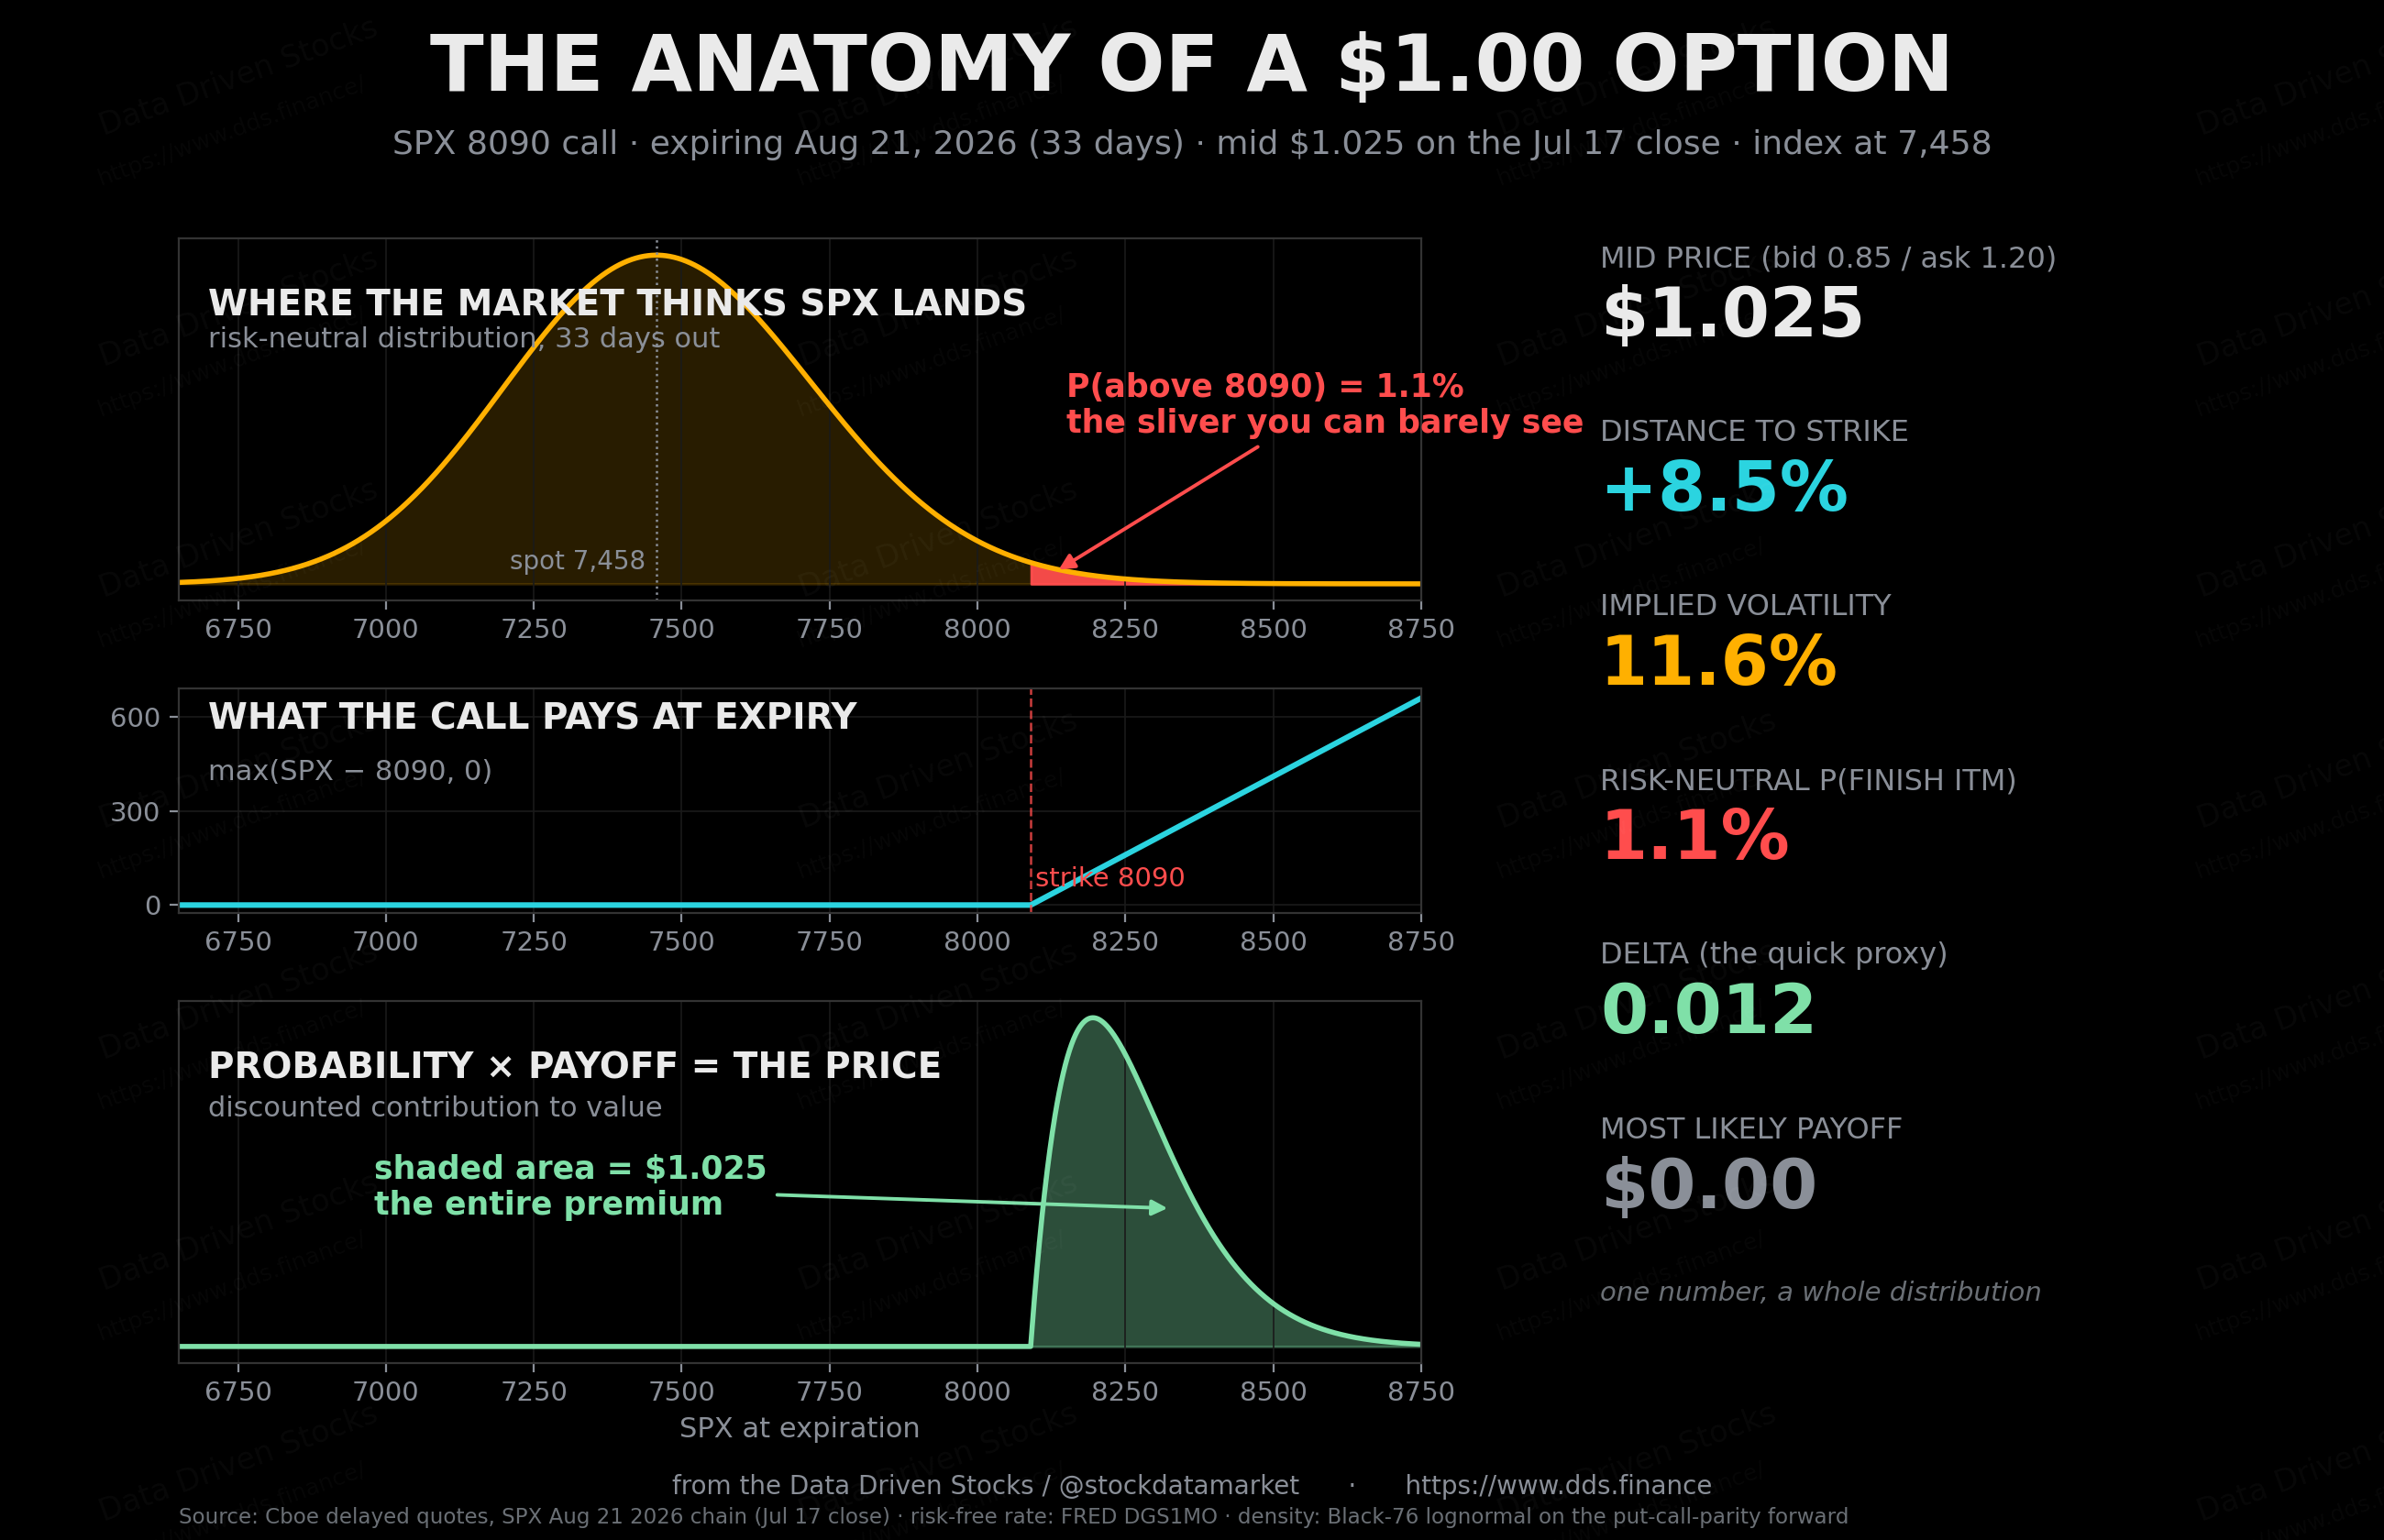
Here is a real one. On the July 17 close, with the S&P 500 at 7,458, the SPX 8090 call expiring August 21 traded at a mid of $1.025. Bid 0.85, ask 1.20. Thirty-three days of life. The strike sits 8.5% above the index.
One dollar. What does that buy?
The wrong read, and the right one
The intuitive read is that the market expects the index to end up about a dollar above the strike. That read is wrong, and it is wrong in an instructive way.
An option price is an average, not a forecast of where the stock will be. Take every possible level the index could close at on expiration day, multiply each payoff by the probability the market assigns to it, add everything up, discount it back to today. That sum is the premium. CME’s own options education walks through exactly this arithmetic: the theoretical price of a call is the sum of the probability-weighted payoffs across the whole distribution, nothing more.
For our 8090 call, that average is lopsided. The single most likely payoff is zero. Roughly 99 times out of 100, in the market’s own pricing, this thing expires worthless. The price is a dollar only because the rare scenarios pay big. Run the numbers and the conditional math says that when the option does finish in the money, the average payoff is about $97. A 1% chance at roughly $97, discounted, comes back to about a dollar. The premium is a lottery ticket with the odds printed on it, if you know where to look.
One housekeeping note for anyone new to index options: SPX contracts carry a $100 multiplier, so this “one dollar” option actually costs about $103 per contract at the mid.
Where the price comes from in the first place
Since 1973, the standard machine for producing that average has been the Black-Scholes model. It assumes the underlying wanders randomly with some volatility, and it prices the option as the discounted expected payoff in a constructed world where everything drifts at the risk-free rate. That construction sounds artificial, and it is. It works because a dealer can hedge the option by trading the underlying against it, and once you can hedge, your own market view stops mattering for the price. Only the width of the distribution matters.
For a call:
C = S·N(d1) - K·e^(-rT)·N(d2)

d1 = [ln(S/K) + (r + σ²/2)·T] / (σ√T)
d2 = d1 - σ√T
The classic textbook case: a $100 stock, $100 strike, one year, 20% volatility, 5% rates. The formula spits out $10.45 for the call. Ten and a half percent of the stock price for an at-the-money bet, and even there the most likely single outcome is a modest move.
You can also skip the formula entirely and brute-force it. Simulate a million random price paths with the option’s implied volatility, pay each path its payoff, average, discount. Same number. Watching that average settle is the fastest way I know to feel what a premium is.
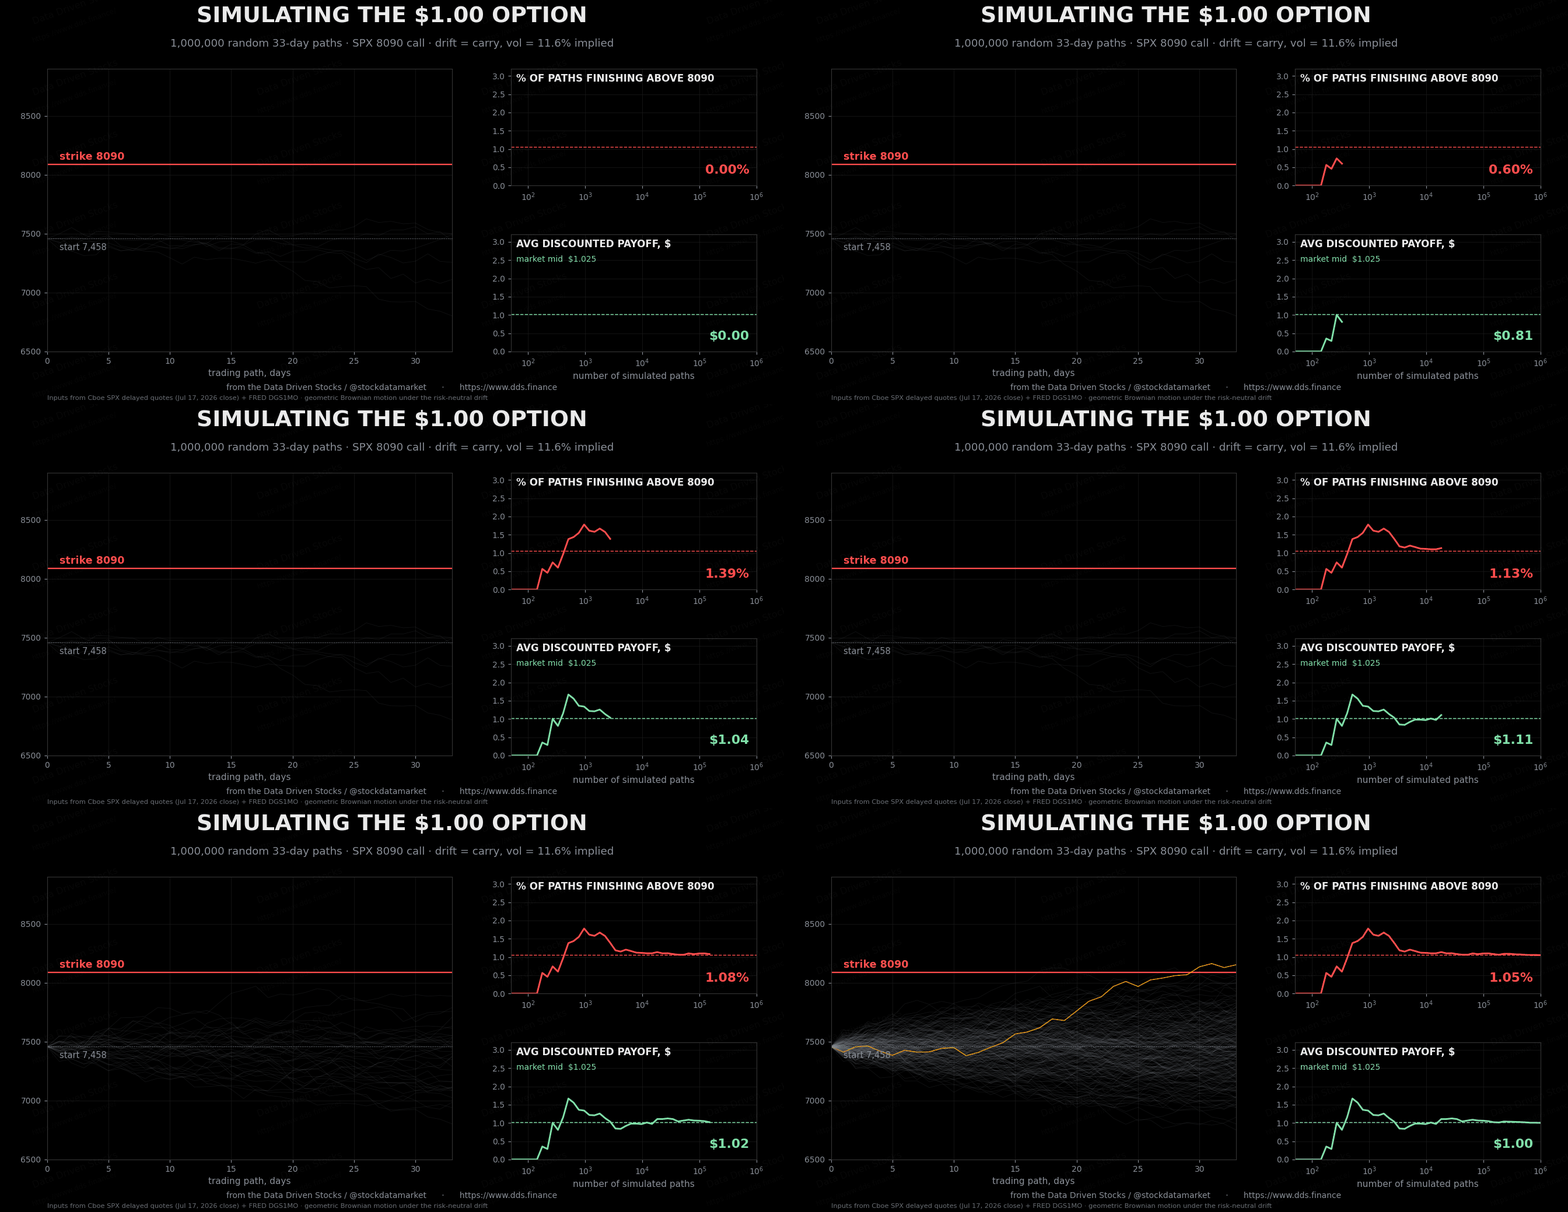
In practice traders run this loop backwards. The market hands you the price, and you solve for the volatility that reproduces it. That number is implied volatility, the market’s bet on how wide the distribution is. Our $1.025 call implies 11.6%. Nothing in it says up or down. It only says how much movement is being charged for.
The three quick reads
Now the practical part. You are staring at a chain and want a probability in seconds. Three tools, in increasing order of precision.
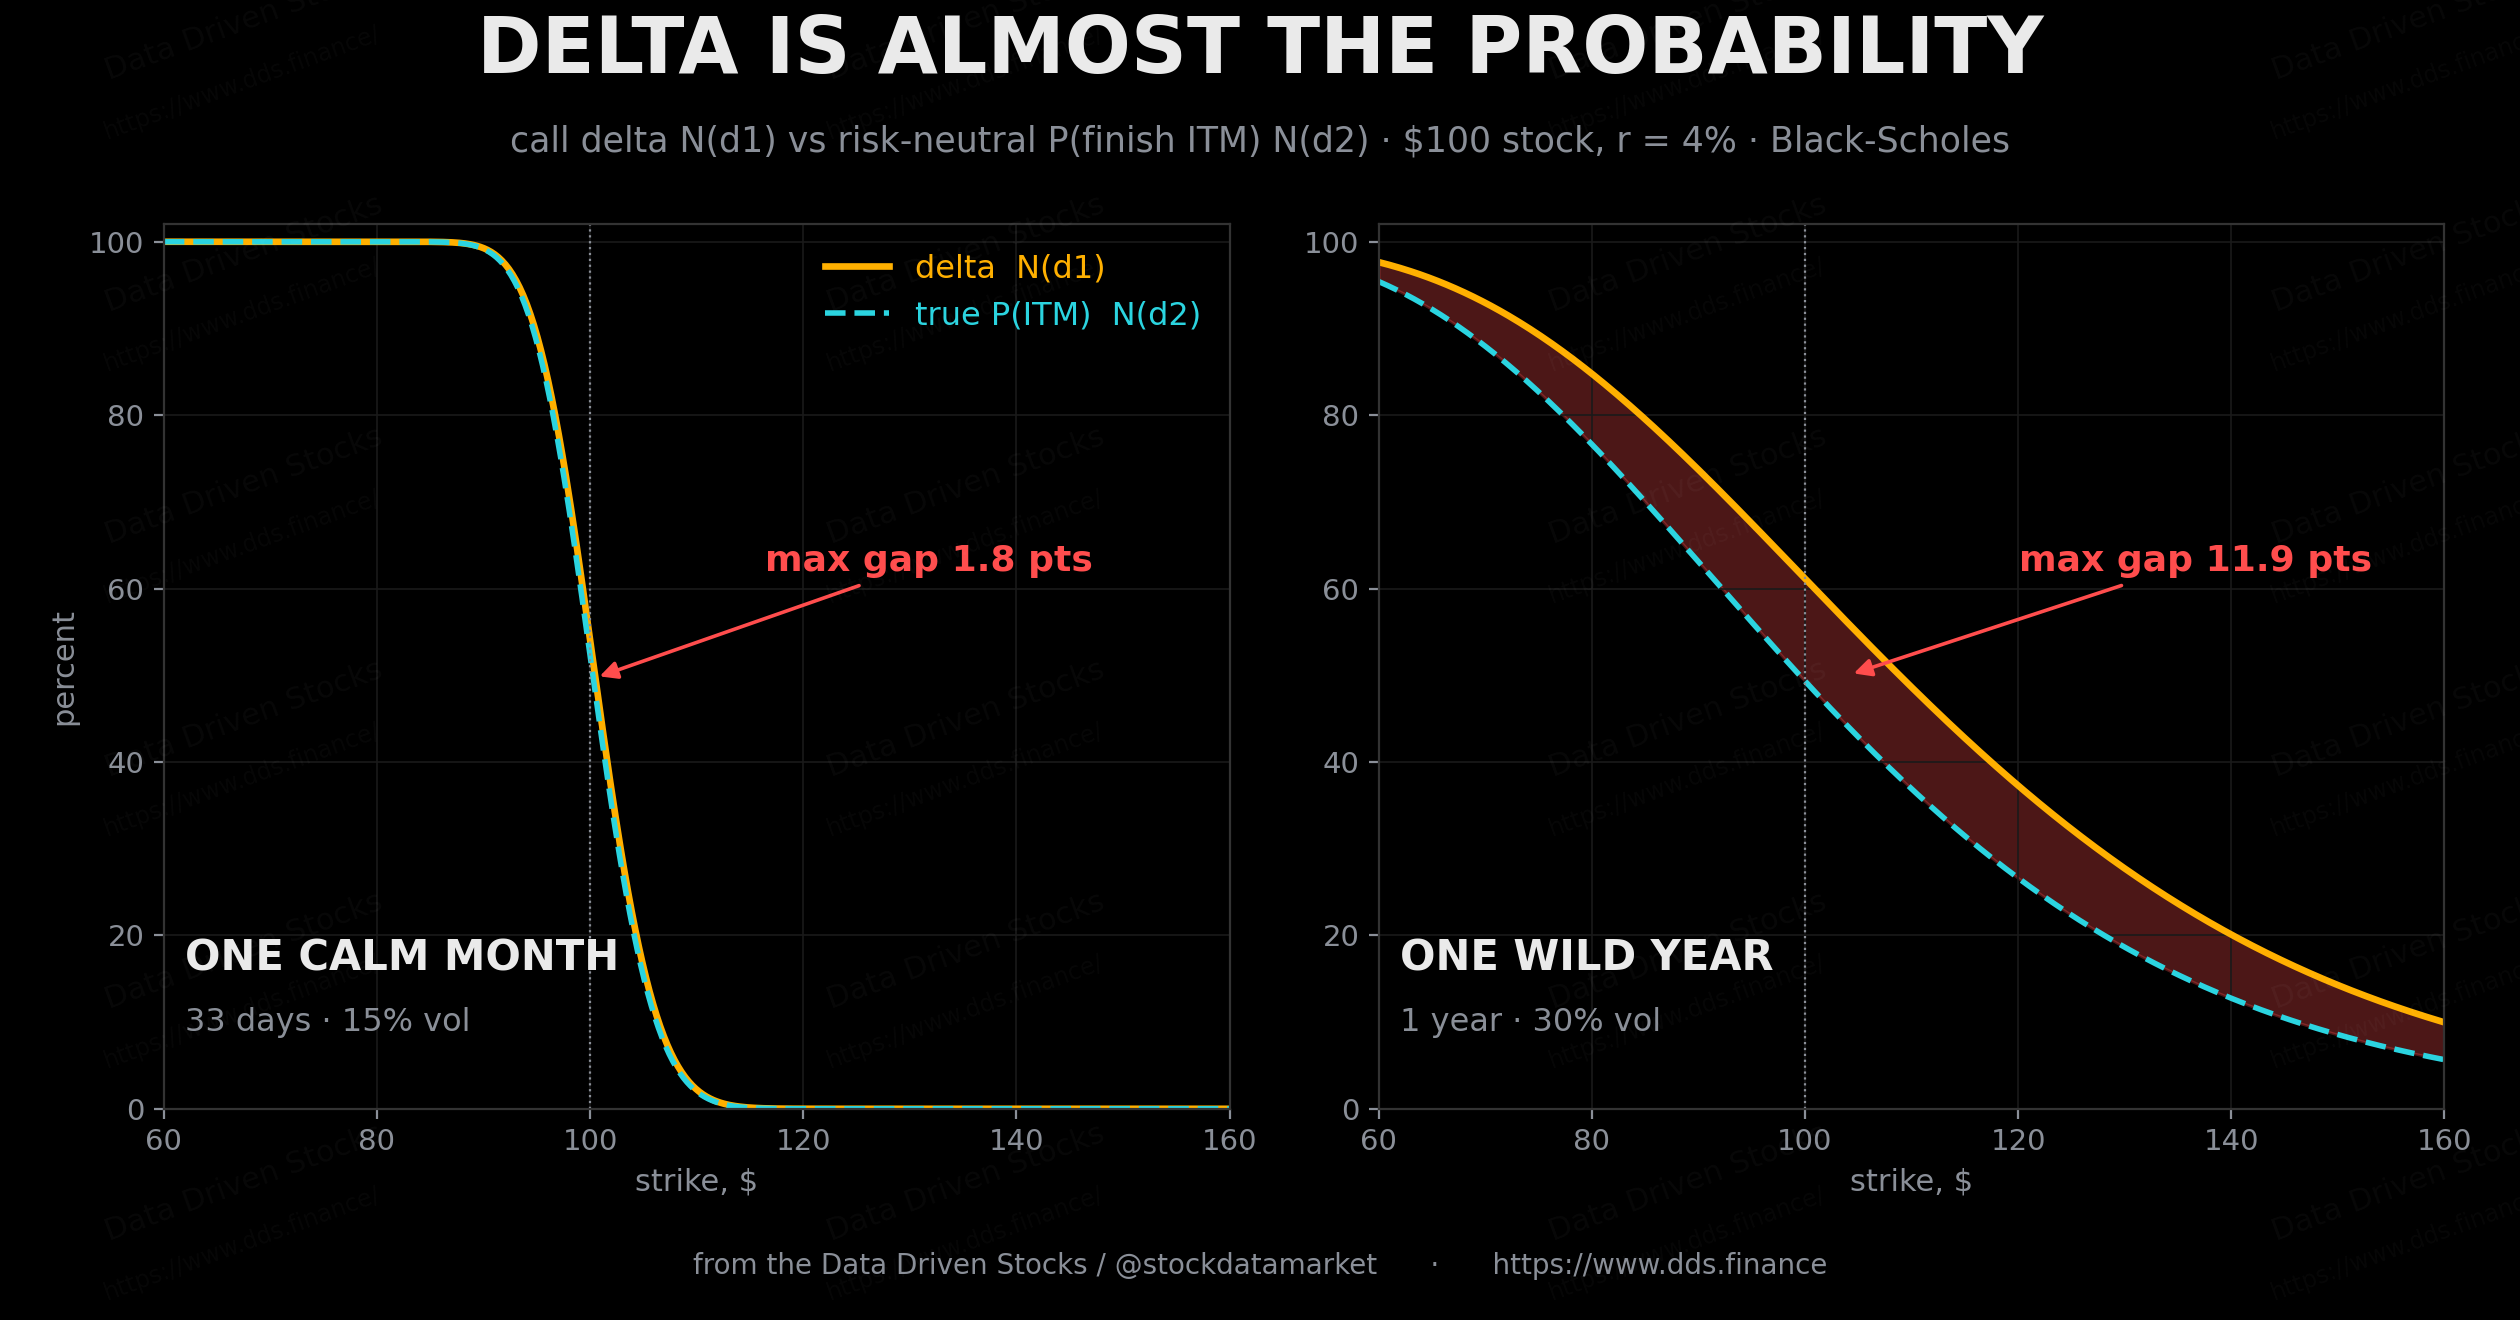
The first is delta. Every platform prints it, and traders have always used it as a shortcut: a 30-delta option has roughly a 30% chance of expiring in the money, a 10-delta roughly 10%. Cboe’s chain shows our 8090 call at a delta of 0.0125. Call it a 1% shot and you are basically done.
The shortcut has a known bias. Delta is N(d1) in the formula above, while the actual risk-neutral probability of finishing in the money is N(d2), and N(d1) is always the larger of the two. For short-dated options the gap is noise. Stretch time and volatility and it stops being noise.
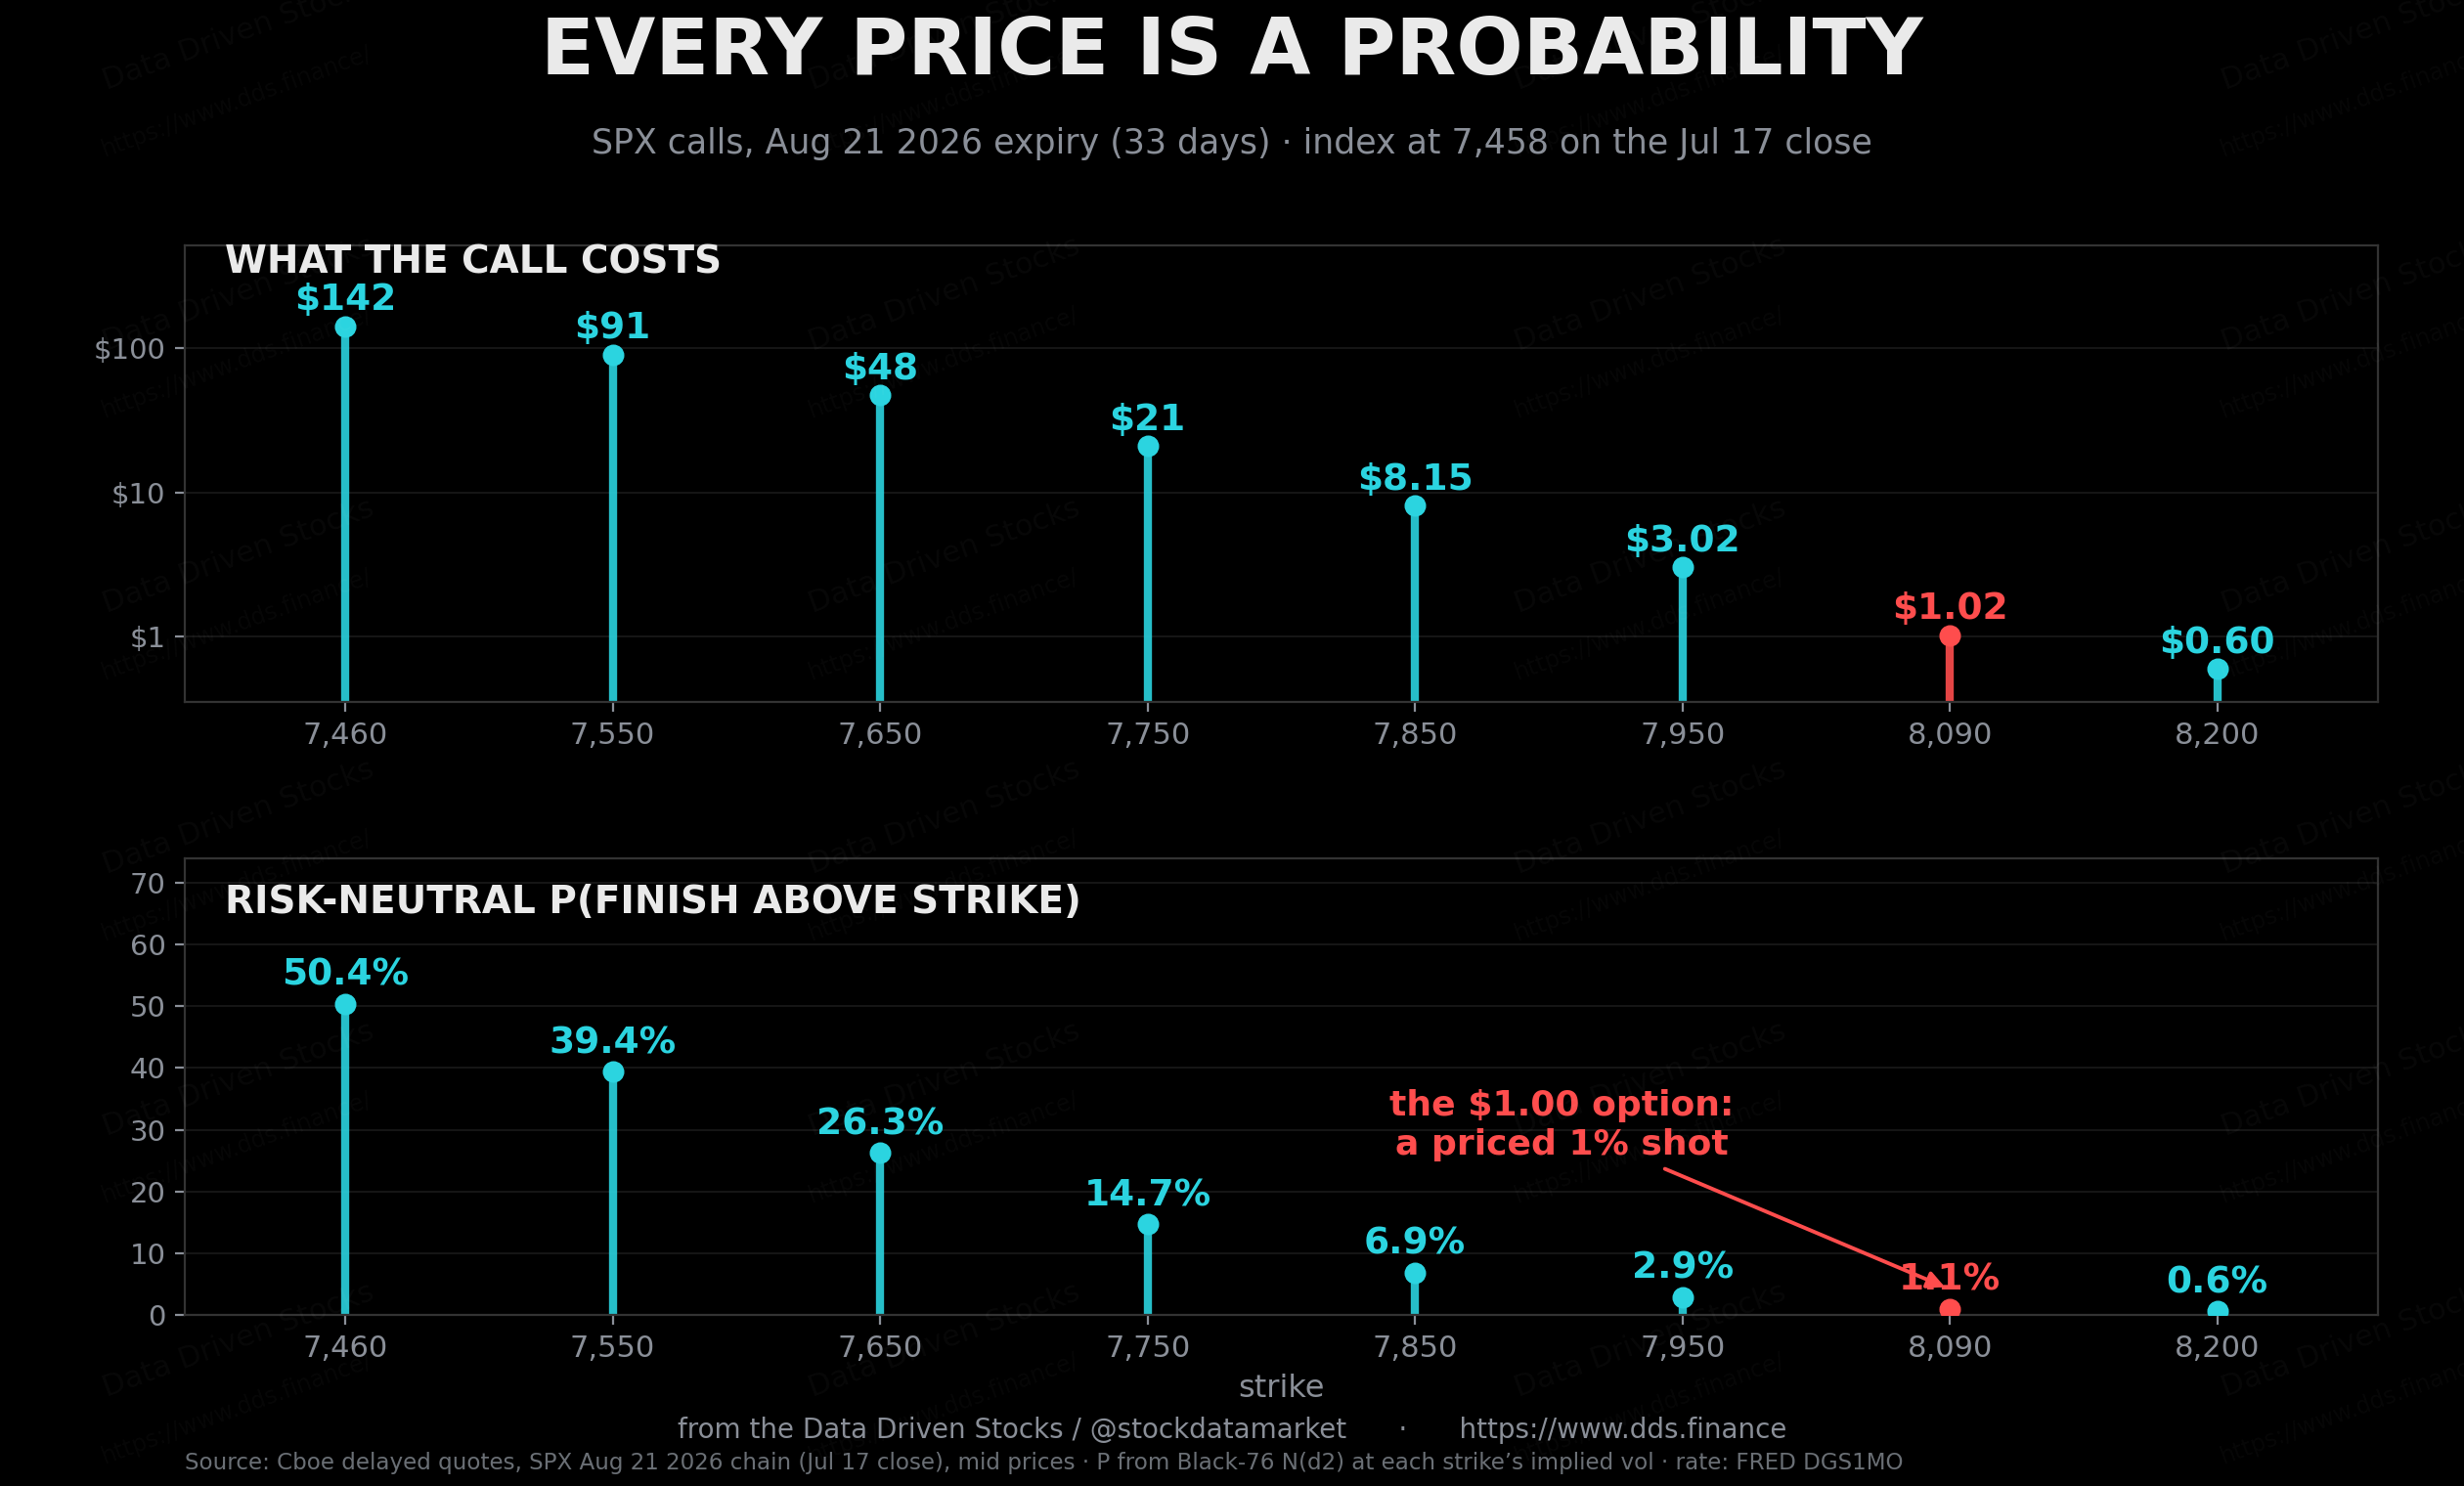
The second read is the price ladder itself. Line up one expiry’s calls and the mapping from dollars to probabilities is just sitting there. On the August SPX chain: $142 at the money buys a coin flip. $21 buys a 15% shot. $3 buys 3%. Our $1 option buys 1%. Once you see a chain this way, you never quite see it the old way again.
If you want the probability with fewer model assumptions, price a tight vertical spread and divide by its width. A spread that pays $20 if the index ends above 7720 costs what a $20 bet on that outcome is worth, so cost over width is the market’s own probability, smile and all. On July 17 the 7700/7720 call spread ran about $4.90, which is 24.5 cents per dollar of width, a 24.5% probability of SPX finishing up there. Interesting detail: that is about five points higher than the 19 to 20% you get from a single strike and a single vol assumption, and the difference is the volatility skew talking. The spread is the more honest number because it uses two real prices instead of one vol number.
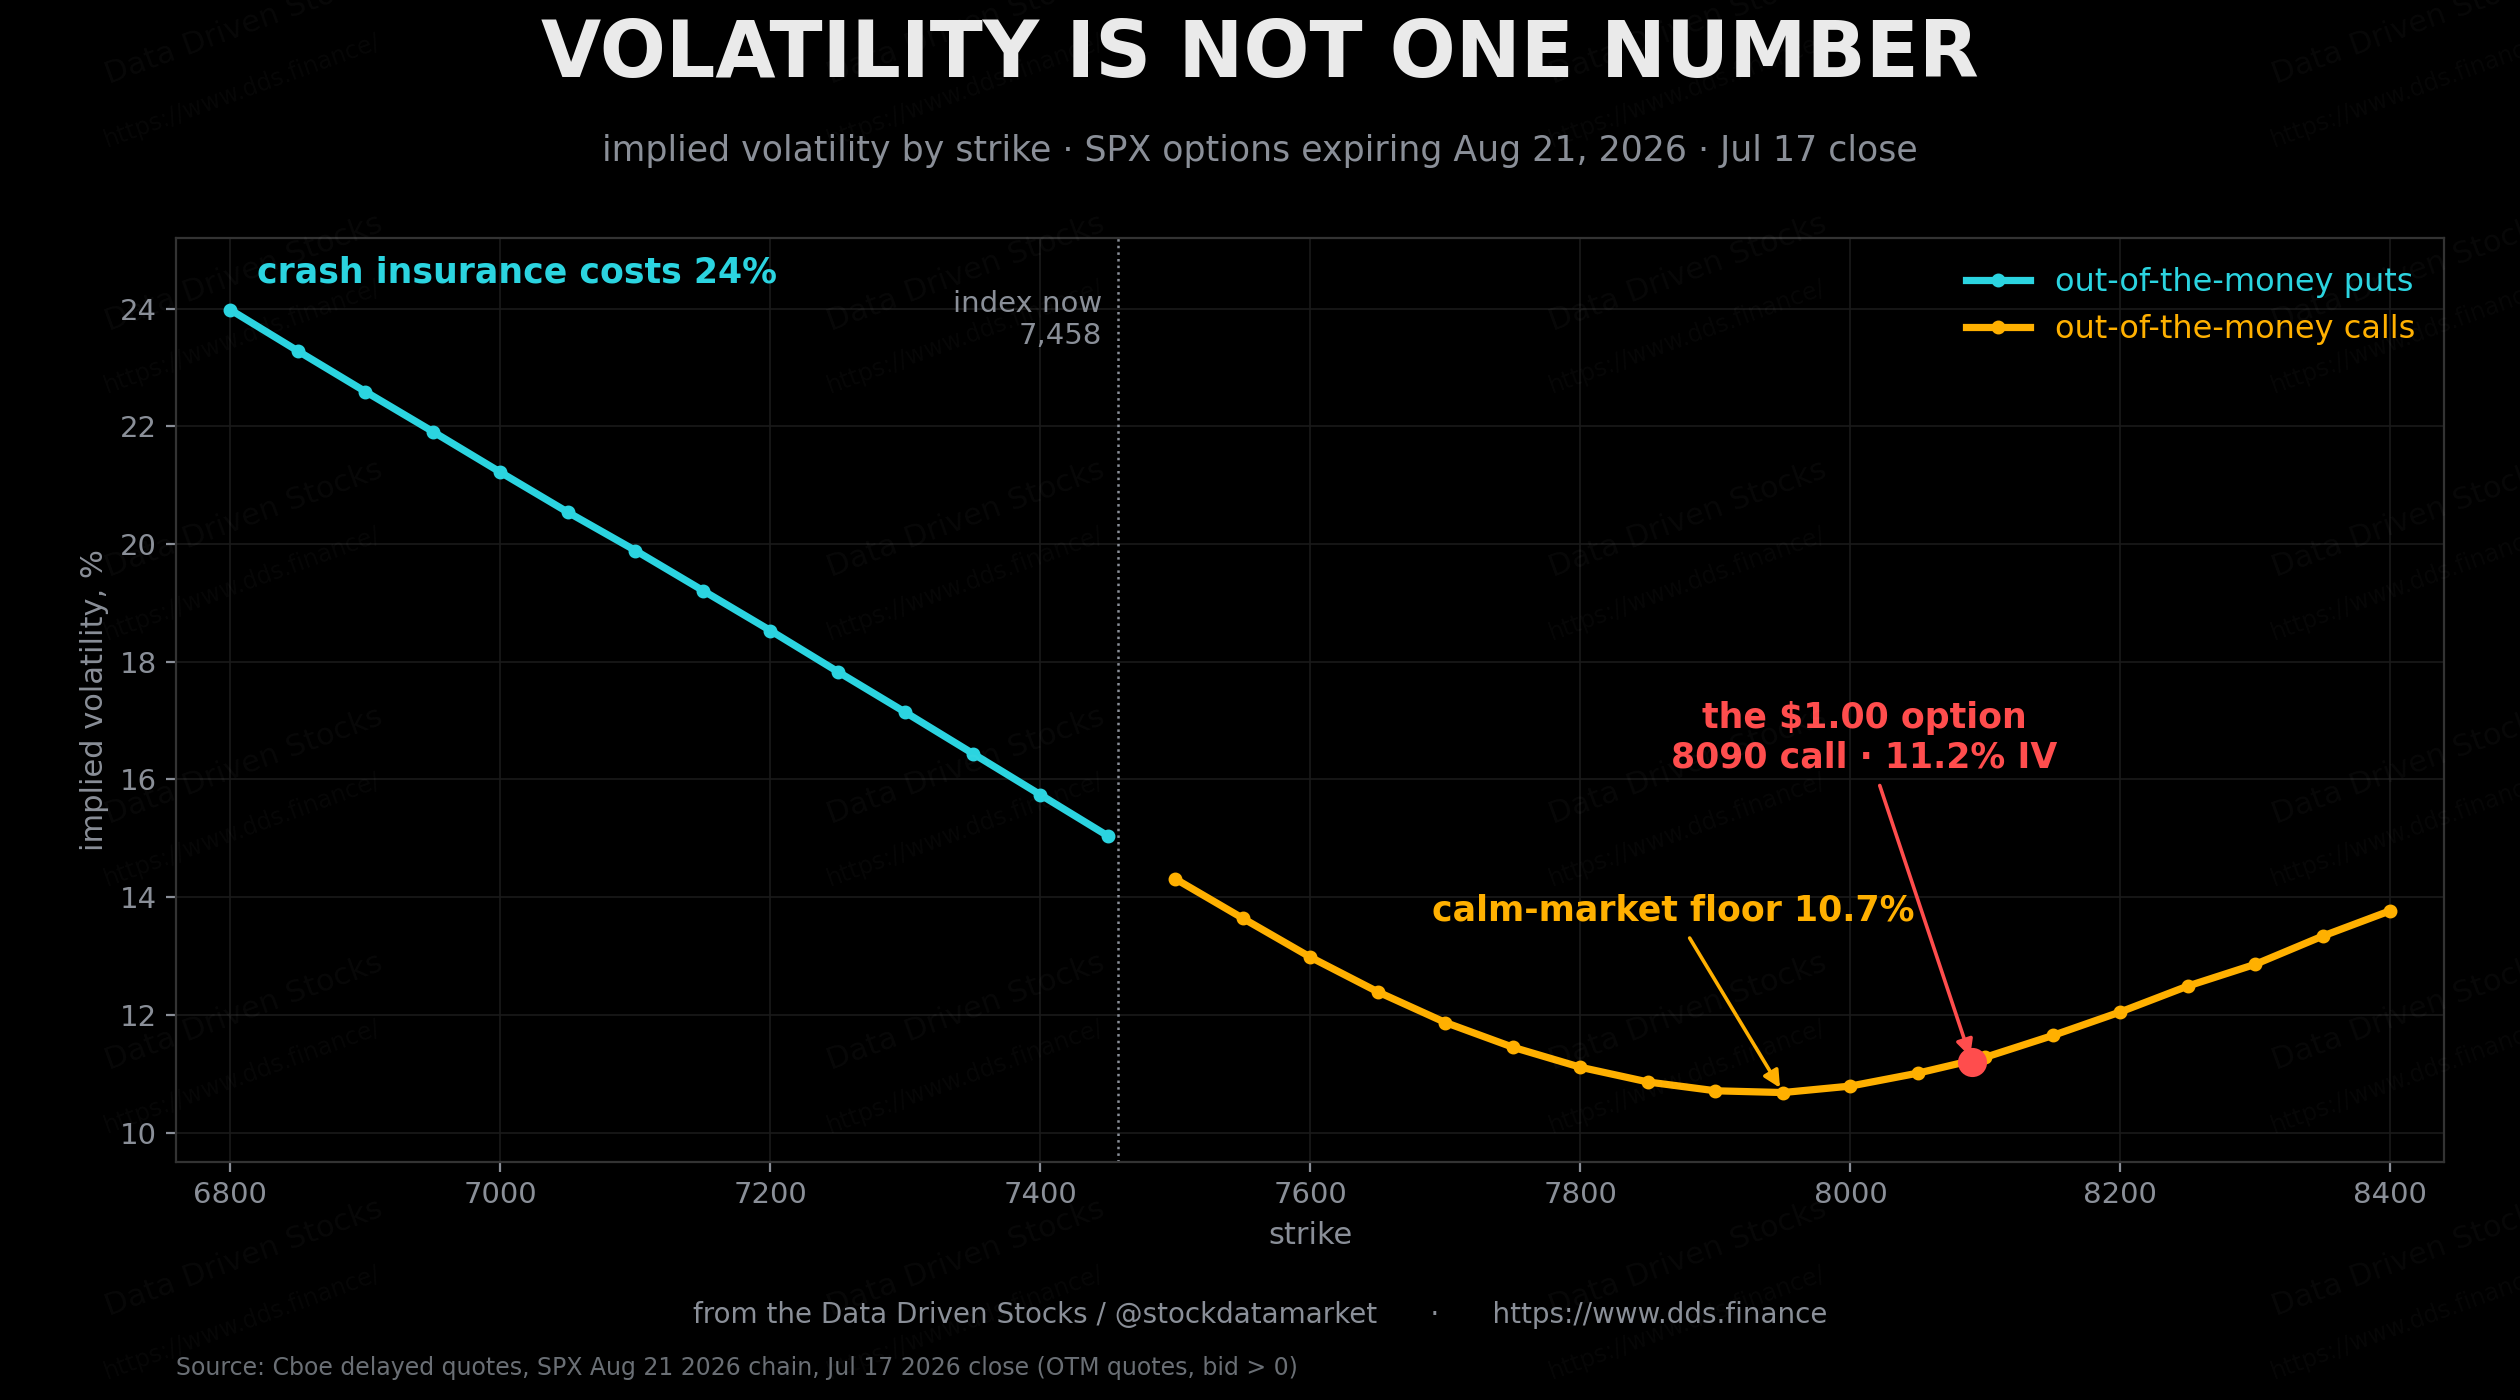
Push this idea across every strike, which is what Breeden and Litzenberger formalized back in 1978 with butterfly spreads, and you can recover the market’s entire probability distribution from the chain.
The third read is the expected move, and it comes from the at-the-money straddle. Buy the ATM call and the ATM put and you own pure movement. The August 7460 straddle cost $273.50, and theory says that price should sit near 0.8 times the one-standard-deviation move. On this chain the relationship held to within 3%. Two conventions follow from it. Multiply the straddle by 0.85 and you get the popular “expected move” band, here about 232 points, or 3.1% either way. Multiply by 1.25 instead and you get the full theoretical one-sigma range, about 342 points. Brokers overwhelmingly quote the first one, and the reason they can get away with a tighter band is the subject of the next section.
The catch: these are not real-world odds
Everything above is a risk-neutral probability, the odds embedded in prices, not the odds of reality. The two differ for a simple reason. Option sellers are short disaster, and they charge for it.
You can measure the markup. Since January 1990, across 9,178 trading days, the VIX has averaged 19.5% while the volatility the S&P 500 actually delivered over the following month averaged 15.4%. Implied came in above subsequent realized on 85% of all days. Oleg Bondarenko’s study for Cboe pinned the 1990 to 2018 stretch at 19.3% implied against 15.1% realized, a 4.2 point gap, and my own pull of the raw data reproduces his window almost exactly. Whatever probabilities you read out of option prices, the market is systematically paying up for movement it usually does not get.
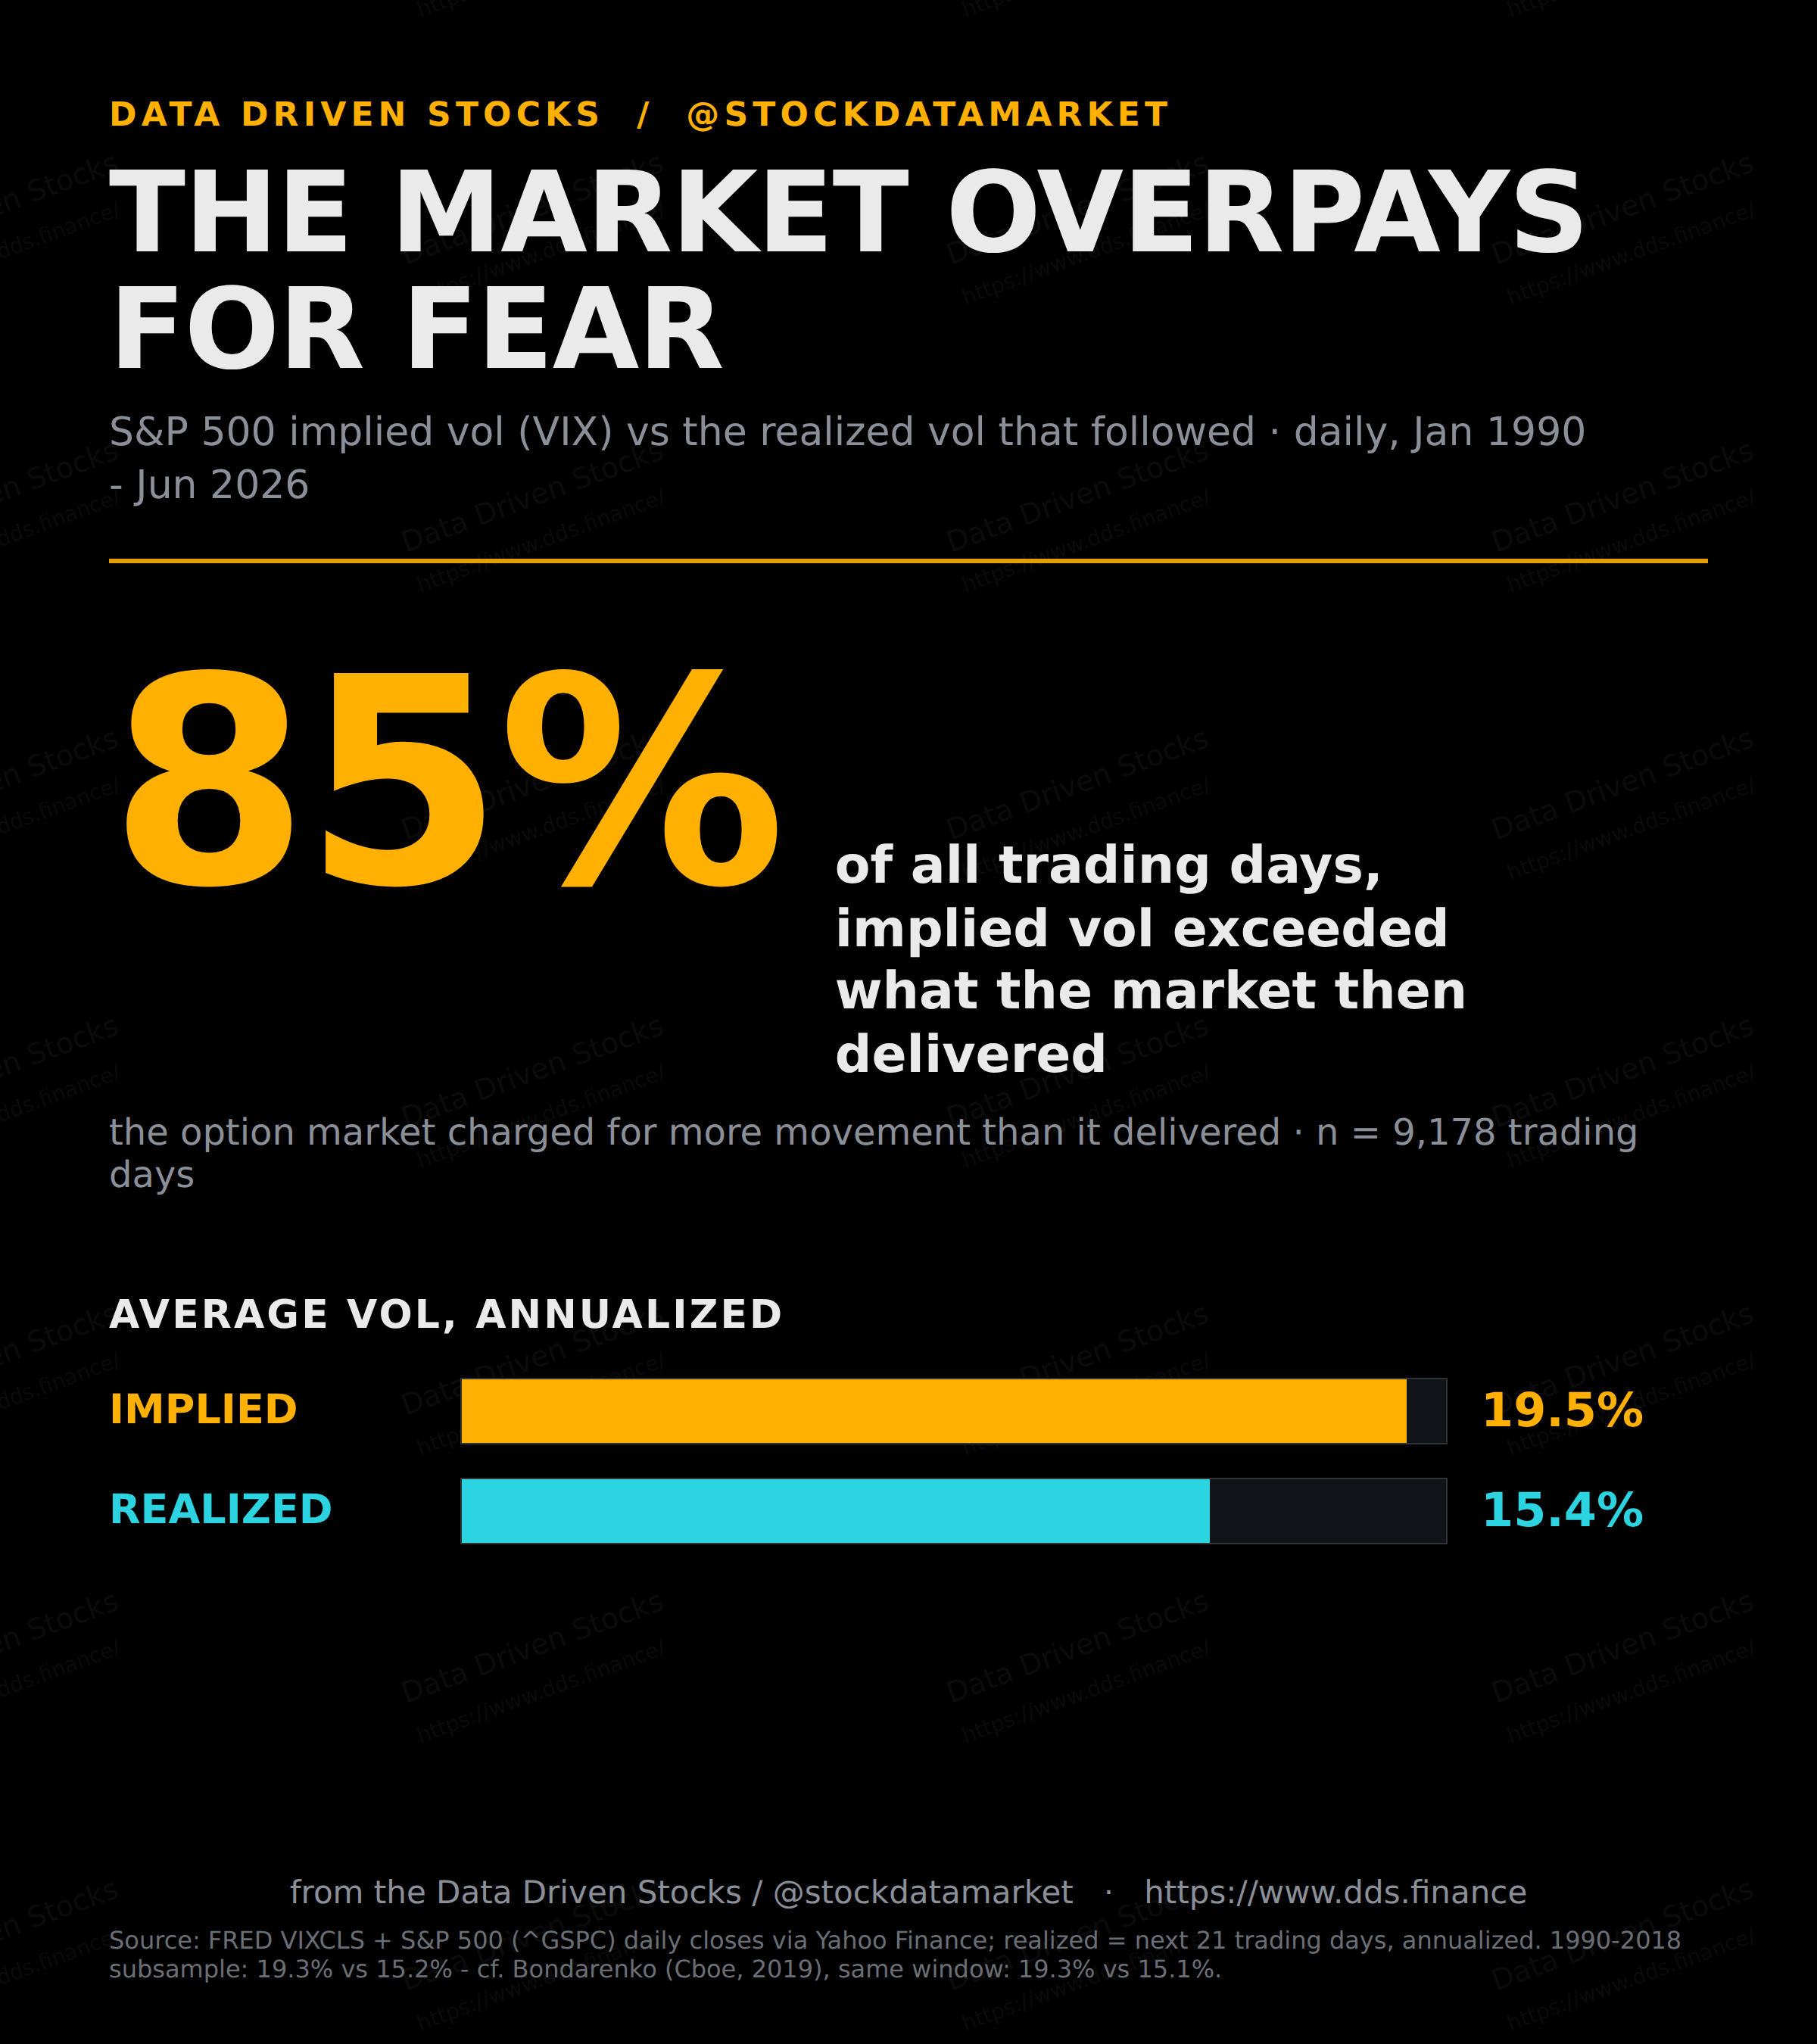
So when the chain says 1%, the honest translation is “the market is charging 1%.” The real-world frequency of that event is probably a touch lower on average, because a slice of every premium is insurance margin, not probability. That wedge is exactly why systematically selling options has historically carried positive expected returns, and why buying them for fun has not.
One warning before anyone gets comfortable selling 1% tail options for a dollar. The model behind these numbers assumes a tidy bell-shaped world of returns, and the real world keeps fatter tails than that. On October 19, 1987 the S&P 500 fell 20.4% in a single day, an event a lognormal model prices as close enough to impossible. Implied probabilities are prices, and prices are opinions with money behind them - the best odds on the board, but not physics.
Read one yourself
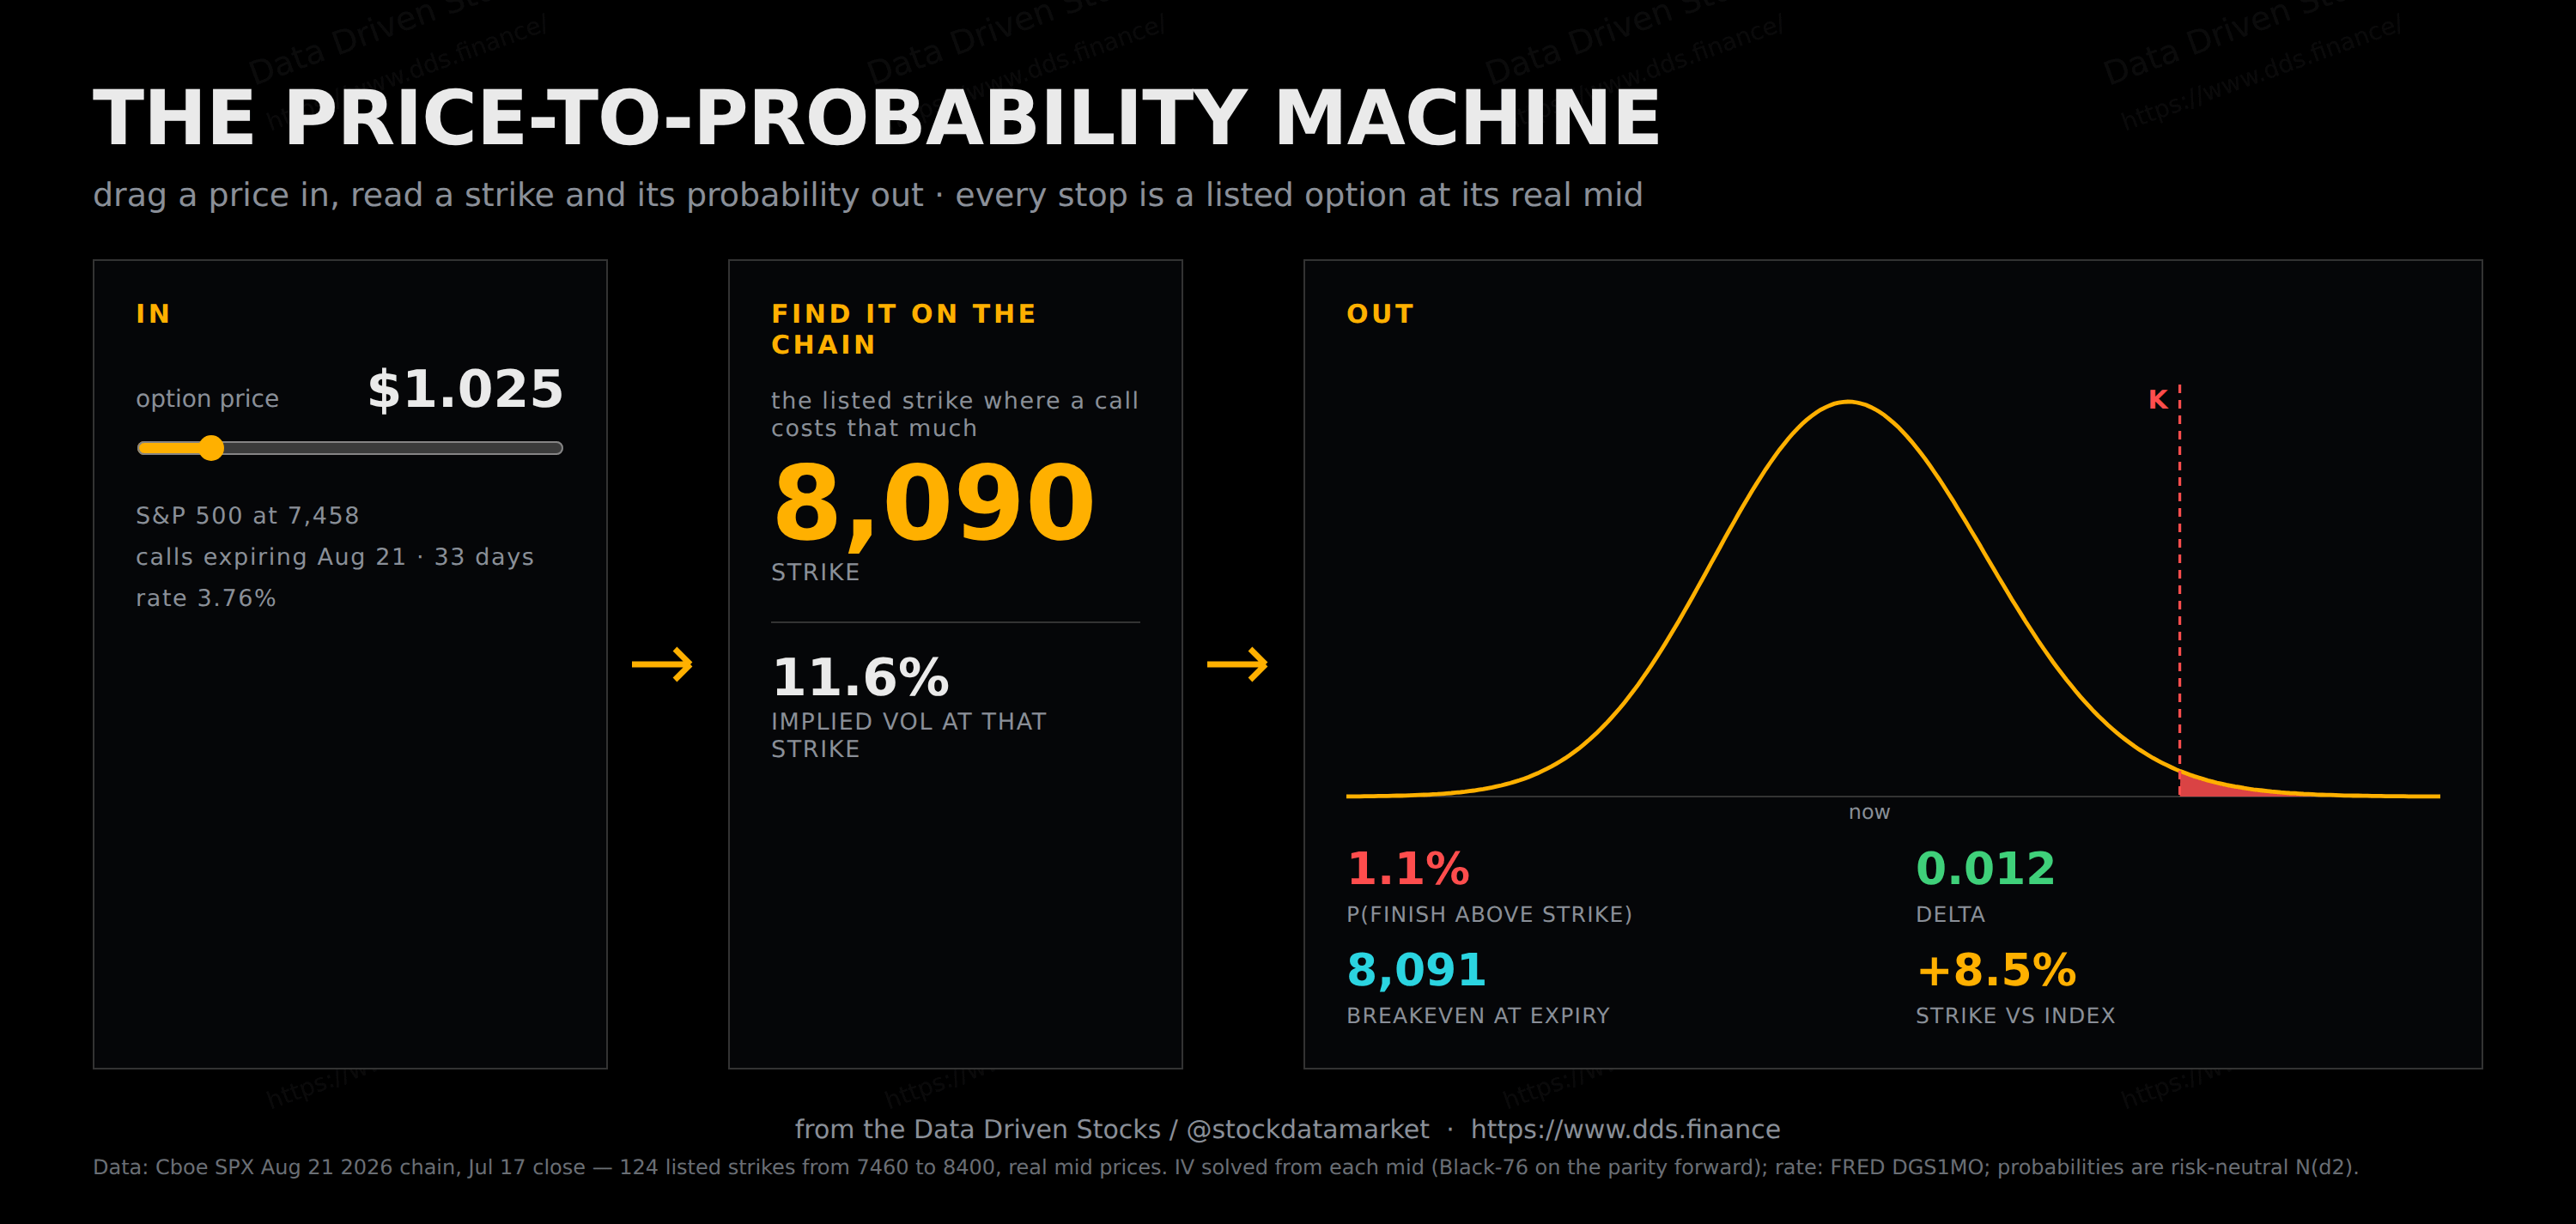
The whole pipeline, price in, probability out, fits in one machine, and it runs on the real chain. A price goes into the left box. The middle box walks the 124 listed August strikes until it finds the one where a call costs that much, and reports that strike along with the implied volatility its price carries. The right box then draws the market’s distribution at that strike and reads out the probability of finishing above it, the delta, the breakeven, and how far the strike sits from the index. Set the dial to $1.025 and the machine lands on 8090, reading 1.1%. Slide it to $142.35 and you are at the money, reading 50.4%. Same day, same market, different strikes: that is the whole trick.
Next time a chain is open in front of you, try the ten-second version. Look at the delta for the fast answer. Divide a tight spread by its width for the honest answer. Multiply the ATM straddle by 0.85 for the expected range. And keep the correction in your pocket: whatever probability you just read, the seller baked a fee into it.
So the $1.00 option turns out to be a full probability distribution compressed into a single number: roughly a 1-in-100 ticket on a big move, sold at a small markup by people who have been collecting that markup for 36 years.
Remember that to get money out of the option market you must bear those probabilities. It’s not only being right, but also beating the odds.
CODE TO DRAW OPTION PROBABILITIES. Copy it and save to the html file (e.g. notepad) and open in a web browser. You don’t need internet connection for the code to work.
<!DOCTYPE html>
<html lang="en">
<head>
<meta charset="utf-8">
<title>The Price-to-Probability Machine</title>
<style>
:root{--bg:#000;--txt:#EAEAEA;--sub:#8A8F98;--mute:#6A6F75;--amber:#FFB000;
--red:#FF4D4D;--cyan:#2BD4E0;--green:#3FD07A;--grid:#1A1A1A;--spine:#333}
*{margin:0;padding:0;box-sizing:border-box}
body{background:#000;color:var(--txt);font-family:'DejaVu Sans','Helvetica Neue',Arial,sans-serif;
display:flex;justify-content:center;padding:18px}
.panel{position:relative;width:1500px;background:var(--bg);overflow:hidden;padding:44px 54px 26px}
.panel::before{content:"";position:absolute;inset:-40%;z-index:0;
background-image:url("data:image/svg+xml;utf8,<svg xmlns='http://www.w3.org/2000/svg' width='360' height='190'><g transform='rotate(-20 180 95)' fill='white' font-family='DejaVu Sans,Arial'><text x='20' y='90' font-size='19' opacity='0.045'>Data Driven Stocks</text><text x='20' y='118' font-size='14' opacity='0.038'>https://www.dds.finance/</text></g></svg>");
background-size:360px 190px;pointer-events:none}
.panel>*{position:relative;z-index:1}
h1{font-size:44px;font-weight:800;letter-spacing:-.01em}
.sub{color:var(--sub);font-size:19px;margin:8px 0 26px}
.machine{display:grid;grid-template-columns:300px 70px 265px 70px 1fr;align-items:stretch;gap:0}
.box{border:1px solid var(--spine);padding:22px 24px;background:#050608}
.box .cap{color:var(--amber);font-weight:800;font-size:15px;letter-spacing:.12em;margin-bottom:16px}
.ctrl{margin:18px 0 8px}
.ctrl label{display:flex;justify-content:space-between;align-items:baseline;color:var(--sub);font-size:14px;margin-bottom:8px}
.ctrl label b{color:var(--txt);font-size:30px;font-weight:800}
input[type=range]{width:100%;accent-color:#FFB000;background:transparent}
.arrow{display:flex;align-items:center;justify-content:center}
.arrow svg{width:54px;height:54px}
.big{font-size:60px;font-weight:800;color:var(--amber);line-height:1;margin:6px 0 2px}
.mid2{font-size:30px;font-weight:800;color:var(--txt);line-height:1;margin:18px 0 2px}
.lab{color:var(--sub);font-size:13.5px;letter-spacing:.06em}
.divider{height:1px;background:var(--spine);margin:20px 0 14px}
.out{display:grid;grid-template-columns:1fr 1fr;gap:10px 26px;margin-top:14px}
.out div b{display:block;font-size:26px;font-weight:800}
.out div span{color:var(--sub);font-size:12.5px;letter-spacing:.05em}
#dist{width:100%;height:270px;display:block}
.foot{margin-top:26px;text-align:center;color:var(--sub);font-size:15px}
.src{color:var(--mute);font-size:12px;margin-top:6px}
</style>
</head>
<body>
<div class="panel">
<h1>THE PRICE-TO-PROBABILITY MACHINE</h1>
<div class="sub">drag a price in, read a strike and its probability out · every stop is a listed option at its real mid</div>
<div class="machine">
<div class="box">
<div class="cap">IN</div>
<div class="ctrl"><label><span>option price</span><b id="vP">$1.025</b></label>
<input type="range" id="p" min="0" max="123" step="1" value="0"></div>
<div class="lab" style="margin-top:20px">S&P 500 at 7,458</div>
<div class="lab" style="margin-top:8px">calls expiring Aug 21 · 33 days</div>
<div class="lab" style="margin-top:8px">rate 3.76%</div>
</div>
<div class="arrow"><svg viewBox="0 0 54 54"><path d="M6 27h34m0 0l-9-9m9 9l-9 9" stroke="#FFB000" stroke-width="3.4" fill="none"/></svg></div>
<div class="box">
<div class="cap">FIND IT ON THE CHAIN</div>
<div class="lab">the listed strike where a call costs that much</div>
<div class="big" id="vK">8,090</div>
<div class="lab">STRIKE</div>
<div class="divider"></div>
<div class="mid2" id="vIV">11.6%</div>
<div class="lab">IMPLIED VOL AT THAT STRIKE</div>
</div>
<div class="arrow"><svg viewBox="0 0 54 54"><path d="M6 27h34m0 0l-9-9m9 9l-9 9" stroke="#FFB000" stroke-width="3.4" fill="none"/></svg></div>
<div class="box">
<div class="cap">OUT</div>
<svg id="dist" viewBox="0 0 640 270" preserveAspectRatio="none"></svg>
<div class="out">
<div><b id="vPr" style="color:var(--red)">1.1%</b><span>P(FINISH ABOVE STRIKE)</span></div>
<div><b id="vD" style="color:var(--green)">0.012</b><span>DELTA</span></div>
<div><b id="vBE" style="color:var(--cyan)">8,091</b><span>BREAKEVEN AT EXPIRY</span></div>
<div><b id="vOTM" style="color:var(--amber)">+8.5%</b><span>STRIKE VS INDEX</span></div>
</div>
</div>
</div>
<div class="foot">from the Data Driven Stocks / @stockdatamarket · https://www.dds.finance</div>
<div class="src">Data: Cboe SPX Aug 21 2026 chain, Jul 17 close — 124 listed strikes from 7460 to 8400, real mid prices. IV solved from each mid (Black-76 on the parity forward); rate: FRED DGS1MO; probabilities are risk-neutral N(d2).</div>
</div>
<script>const ROWS=[[8400,0.325,0.14274,0.00296,0.0034,12.635],[8375,0.325,0.13949,0.00304,0.0034,12.3],[8350,0.35,0.13725,0.00331,0.0037,11.965],[8325,0.375,0.1349,0.00359,0.004,11.63],[8300,0.425,0.1333,0.00408,0.0046,11.295],[8275,0.45,0.1307,0.00439,0.0049,10.959],[8250,0.5,0.12873,0.00492,0.0055,10.624],[8225,0.55,0.12658,0.00547,0.0061,10.289],[8200,0.6,0.12427,0.00604,0.0067,9.954],[8175,0.675,0.12235,0.00684,0.0075,9.618],[8170,0.7,0.12215,0.00708,0.0078,9.551],[8160,0.7,0.12068,0.00717,0.0079,9.417],[8150,0.75,0.1202,0.00767,0.0084,9.283],[8140,0.8,0.11966,0.00817,0.009,9.149],[8130,0.8,0.11816,0.00827,0.0091,9.015],[8125,0.85,0.1183,0.00874,0.0096,8.948],[8120,0.85,0.11754,0.00879,0.0096,8.881],[8110,0.9,0.11687,0.00932,0.0102,8.747],[8100,0.975,0.11652,0.01006,0.011,8.613],[8090,1.025,0.11573,0.0106,0.0116,8.479],[8080,1.1,0.11524,0.01135,0.0124,8.345],[8075,1.125,0.11479,0.01163,0.0127,8.277],[8070,1.175,0.11467,0.01211,0.0132,8.21],[8060,1.25,0.11404,0.01288,0.014,8.076],[8050,1.325,0.11334,0.01366,0.0148,7.942],[8040,1.4,0.11259,0.01446,0.0157,7.808],[8030,1.525,0.11232,0.01566,0.017,7.674],[8025,1.575,0.11201,0.01616,0.0175,7.607],[8020,1.65,0.11194,0.01687,0.0183,7.54],[8010,1.8,0.1117,0.01828,0.0198,7.406],[8000,1.95,0.11134,0.01971,0.0213,7.272],[7990,2.1,0.11089,0.02115,0.0228,7.138],[7980,2.3,0.11073,0.02298,0.0248,7.004],[7975,2.4,0.11061,0.0239,0.0257,6.937],[7970,2.55,0.11081,0.02519,0.0271,6.87],[7960,2.775,0.11056,0.02722,0.0293,6.735],[7950,3.025,0.11035,0.02944,0.0316,6.601],[7940,3.3,0.11017,0.03186,0.0342,6.467],[7930,3.7,0.11054,0.03514,0.0377,6.333],[7925,3.9,0.11065,0.03678,0.0394,6.266],[7920,4.05,0.11046,0.03809,0.0408,6.199],[7910,4.45,0.11048,0.04137,0.0443,6.065],[7900,5.0,0.11102,0.04562,0.0487,5.931],[7890,5.45,0.11092,0.04923,0.0525,5.797],[7880,6.05,0.11127,0.05377,0.0573,5.663],[7875,6.35,0.11137,0.05603,0.0597,5.596],[7870,6.65,0.11143,0.0583,0.0621,5.529],[7860,7.35,0.11176,0.0634,0.0675,5.395],[7850,8.15,0.11222,0.06904,0.0734,5.26],[7840,9.05,0.11278,0.0752,0.0799,5.126],[7830,10.05,0.11342,0.08183,0.0868,4.992],[7825,10.45,0.11338,0.08462,0.0897,4.925],[7820,11.0,0.1137,0.08817,0.0934,4.858],[7810,12.1,0.11418,0.09522,0.1008,4.724],[7805,12.75,0.1146,0.09921,0.105,4.657],[7800,13.4,0.11495,0.10317,0.1091,4.59],[7795,14.0,0.11513,0.10689,0.113,4.523],[7790,14.7,0.11549,0.11104,0.1174,4.456],[7785,15.35,0.11568,0.11496,0.1214,4.389],[7780,16.1,0.11605,0.1193,0.126,4.322],[7775,16.85,0.11635,0.12361,0.1305,4.255],[7770,17.7,0.11682,0.12832,0.1354,4.188],[7765,18.5,0.11712,0.1328,0.14,4.121],[7760,19.35,0.11747,0.13746,0.1449,4.054],[7755,20.25,0.11786,0.14229,0.1499,3.987],[7750,21.15,0.1182,0.14709,0.1549,3.92],[7745,22.15,0.11867,0.15224,0.1602,3.853],[7740,23.15,0.11908,0.15735,0.1656,3.785],[7735,24.15,0.11944,0.16244,0.1708,3.718],[7730,25.2,0.11984,0.16767,0.1763,3.651],[7725,26.3,0.12027,0.17304,0.1818,3.584],[7720,27.45,0.12073,0.17854,0.1875,3.517],[7715,28.65,0.12121,0.18416,0.1934,3.45],[7710,29.85,0.12164,0.18975,0.1991,3.383],[7705,31.05,0.12202,0.19531,0.2049,3.316],[7700,32.35,0.12251,0.20112,0.2109,3.249],[7695,33.7,0.12302,0.20704,0.217,3.182],[7690,35.05,0.12348,0.21291,0.2231,3.115],[7685,36.45,0.12396,0.21889,0.2293,3.048],[7680,37.95,0.12453,0.22507,0.2357,2.981],[7675,39.45,0.12506,0.23121,0.242,2.914],[7670,41.0,0.1256,0.23743,0.2484,2.847],[7665,42.6,0.12616,0.24372,0.2549,2.78],[7660,44.2,0.12667,0.24996,0.2613,2.713],[7655,45.85,0.1272,0.25627,0.2678,2.646],[7650,47.6,0.12781,0.26274,0.2745,2.579],[7645,49.4,0.12844,0.26926,0.2812,2.512],[7640,51.1,0.12889,0.27553,0.2876,2.445],[7635,53.0,0.12956,0.28214,0.2944,2.378],[7630,54.9,0.13017,0.28868,0.3012,2.311],[7625,56.85,0.1308,0.29526,0.3079,2.243],[7620,58.75,0.13133,0.30171,0.3145,2.176],[7615,60.75,0.13193,0.30827,0.3213,2.109],[7610,62.8,0.13254,0.31486,0.328,2.042],[7605,64.85,0.13311,0.32139,0.3347,1.975],[7600,67.1,0.13388,0.32815,0.3417,1.908],[7595,69.25,0.13449,0.33471,0.3484,1.841],[7590,71.45,0.13511,0.34129,0.3551,1.774],[7585,73.75,0.1358,0.34793,0.3619,1.707],[7580,76.05,0.13646,0.35451,0.3686,1.64],[7575,78.35,0.13707,0.36103,0.3753,1.573],[7570,80.75,0.13775,0.36761,0.382,1.506],[7565,83.15,0.1384,0.37413,0.3887,1.439],[7560,85.65,0.13912,0.38069,0.3954,1.372],[7555,88.1,0.13974,0.38714,0.402,1.305],[7550,90.65,0.14043,0.39363,0.4086,1.238],[7545,93.25,0.14115,0.40009,0.4152,1.171],[7540,95.75,0.14171,0.40643,0.4216,1.104],[7535,98.45,0.14246,0.41285,0.4281,1.037],[7530,101.15,0.14317,0.41921,0.4346,0.97],[7525,103.85,0.14384,0.42551,0.441,0.903],[7520,106.65,0.14459,0.43181,0.4474,0.836],[7515,109.4,0.14525,0.43803,0.4538,0.768],[7510,112.2,0.14593,0.44422,0.46,0.701],[7505,115.15,0.14674,0.4504,0.4663,0.634],[7500,118.05,0.14746,0.45651,0.4725,0.567],[7495,120.95,0.14814,0.46257,0.4787,0.5],[7490,123.9,0.14885,0.46859,0.4848,0.433],[7485,126.9,0.14958,0.47457,0.4908,0.366],[7480,129.95,0.15033,0.48049,0.4968,0.299],[7475,132.95,0.15099,0.48637,0.5028,0.232],[7470,136.1,0.15179,0.49219,0.5087,0.165],[7465,139.2,0.1525,0.49797,0.5145,0.098],[7460,142.35,0.15323,0.50369,0.5203,0.031]];const DEF=19;</script>
<script>
// ROWS: [K, mid, iv, p, delta, otm] per listed strike, sorted by descending K
// (slider left -> right = cheaper -> pricier). All values precomputed offline.
const S=7457.69, T=33/365, CARRY=0.01988;
const P=document.getElementById('p');
P.max=ROWS.length-1; P.value=DEF;
function fmtPrice(m){let t=m.toFixed(3);t=t.replace(/0+$/,'').replace(/\.$/,'');return '$'+t;}
function draw(sg,K){
const svg=document.getElementById('dist');const W=640,H=270;
const F=S*Math.exp(CARRY*T);
const sd=sg*Math.sqrt(T), mu=Math.log(F)-0.5*sd*sd;
const lo=F*Math.exp(-4*sd), hi=F*Math.exp(4*sd);
let xs=[],mx=0;
for(let i=0;i<=240;i++){const s=lo+(hi-lo)*i/240;
const d=Math.exp(-0.5*Math.pow((Math.log(s)-mu)/sd,2))/(s*sd);
xs.push([s,d]); if(d>mx)mx=d}
const X=s=>((s-lo)/(hi-lo))*W, Y=d=>H-14-(d/mx)*(H-40);
let path='M'+X(xs[0][0]).toFixed(1)+' '+Y(xs[0][1]).toFixed(1);
let itm='M'+X(Math.min(Math.max(K,lo),hi)).toFixed(1)+' '+(H-14), started=false;
for(const[s,d]of xs){path+=' L'+X(s).toFixed(1)+' '+Y(d).toFixed(1);
if(s>=K){itm+=' L'+X(s).toFixed(1)+' '+Y(d).toFixed(1);started=true}}
itm = started ? itm+' L'+W+' '+(H-14)+' Z' : '';
const kx=X(Math.min(Math.max(K,lo),hi));
svg.innerHTML=
'<line x1="0" y1="'+(H-14)+'" x2="'+W+'" y2="'+(H-14)+'" stroke="#333" stroke-width="1"/>'+
(itm?'<path d="'+itm+'" fill="#FF4D4D" fill-opacity="0.85"/>':'')+
'<path d="'+path+'" stroke="#FFB000" stroke-width="2.4" fill="none"/>'+
'<line x1="'+kx+'" y1="16" x2="'+kx+'" y2="'+(H-14)+'" stroke="#FF4D4D" stroke-dasharray="5 4" stroke-width="1.6"/>'+
'<text x="'+(kx-7)+'" y="30" fill="#FF4D4D" font-size="15" font-weight="700" text-anchor="end">K</text>'+
'<text x="'+(X(F)-4)+'" y="'+(H-1)+'" fill="#8A8F98" font-size="12">now</text>';
}
function upd(){
const r=ROWS[+P.value];
const K=r[0], mid=r[1], iv=r[2], p=r[3], dl=r[4], otm=r[5];
document.getElementById('vP').textContent=fmtPrice(mid);
document.getElementById('vK').textContent=K.toLocaleString('en-US');
document.getElementById('vIV').textContent=(iv*100).toFixed(1)+'%';
const pc=p*100;
document.getElementById('vPr').textContent=pc.toFixed(1)+'%';
document.getElementById('vD').textContent=dl.toFixed(3);
document.getElementById('vBE').textContent=Math.round(K+mid).toLocaleString('en-US');
document.getElementById('vOTM').textContent=(otm>=0?'+':'')+otm.toFixed(1)+'%';
draw(iv,K);
}
P.addEventListener('input',upd); upd();
</script>
</body>
</html>Data pulled and cross-checked July 19, 2026 against the July 17 close. All chart values computed from the cited sources; simulations run under the stated models.
Sources and further reading
Cboe delayed quotes, SPX option chain for Aug 21, 2026 expiry (July 17, 2026 close): https://www.cboe.com/delayed_quotes/spx
Federal Reserve Bank of St. Louis, FRED series VIXCLS (CBOE Volatility Index) and DGS1MO (1-month Treasury constant maturity): https://fred.stlouisfed.org/series/VIXCLS and https://fred.stlouisfed.org/series/DGS1MO
Yahoo Finance, S&P 500 (^GSPC) daily history, 1990-2026: https://finance.yahoo.com/quote/%5EGSPC
Bondarenko, O., “Historical Performance of Put-Writing Strategies,” Cboe white paper, 2019 (VIX 19.3% vs realized 15.1%, 1990-2018): https://cdn.cboe.com/resources/education/research_publications/PutWriteCBOE19_v14_by_Prof_Oleg_Bondarenko_as_of_June_14.pdf and summary at https://www.cboe.com/insights/posts/white-paper-shows-volatility-risk-premium-facilitated-higher-risk-adjusted-returns-for-put-index/
Breeden, D.T. and Litzenberger, R.H., “Prices of State-Contingent Claims Implicit in Option Prices,” The Journal of Business, Vol. 51, No. 4 (1978), pp. 621-651.
Brenner, M. and Subrahmanyam, M.G., “A Simple Formula to Compute the Implied Standard Deviation,” Financial Analysts Journal, Vol. 44, No. 5 (1988), pp. 80-83 (the 0.4·S·σ·√T at-the-money approximation).
Hull, J.C., Options, Futures, and Other Derivatives, Pearson (N(d2) as the risk-neutral exercise probability; risk-neutral valuation chapter).
CME Group, “Introduction to Options: Theoretical Pricing Models” (the premium as the sum of probability-weighted payoffs): https://www.cmegroup.com/education/courses/introduction-to-options/options-theoretical-pricing-models
CME Group, “Using Options Prices to Assess Oil Market Opportunities” (2024; delta as the implied probability of finishing in the money, and option prices as an implied probability-weighted distribution): https://www.cmegroup.com/articles/whitepapers/using-options-prices-to-assess-oil-market-opportunities.html
PowerOptions, “Expected Move Calculator” and OptionsHawk, “Calculating Expected Moves Using Options” (the ATM straddle × 0.85 convention): https://www.poweropt.com/expected_move.asp and https://optionshawk.com/calculating-expected-moves-using-options/
Ryan O’Connell, CFA, “Option Delta” (delta as an ITM-probability proxy and its N(d1) vs N(d2) bias): https://ryanoconnellfinance.com/option-delta/
Worrall, T., “The Black-Scholes Formula,” FIN-40008 lecture notes (N(d2) as the probability the call finishes in the money): http://www.timworrall.com/fin-40008/bscholes.pdf
Federal Reserve History, “Stock Market Crash of 1987”; Corporate Finance Institute, “Black Monday” (S&P 500 -20.4% on Oct 19, 1987): https://www.federalreservehistory.org/essays/stock-market-crash-of-1987
Very clear and educational. Many thanks.
An article on the real-life of characteristics of 0dte SPXW options would no doubt be of interest to many readers and highly welcome.