

VIX strategies to actually make money
If you trade VIX - you must read it. Some setups are two times per year - but they are low effort. Also explanation why we see VIX reversals and S&P 500 V-recoveries.

You looked at a chart of the VIX. You saw it sitting at 13, then 80, then 13 again. And you thought: there has to be a way to stand in the right place and make money.
Everyone who trades volatility thinks this. Everyone. And they are right! But one needs a good setup to actually profit from it. Because everybody did notice it - many trades are often “priced-in”. Also volatility trades do not happen everyday, nor even everyweek. Sometimes there are only good setups three times per year.
P.S. This article is very long and has a lot of graphs comparing different strategies under different conditions. So if you are reading it from the e-mail box - it will get cut.
P.S. 2 All strategies here assume that you hold the contract until the expiration. Of course one can exit it earlier to get the premium back, or not to risk any reversal.
P.S. 3 6M, 1M, 2W - means 6M is month expiry, 1M - 1 month expiry, 2W - 2 weeks expiry
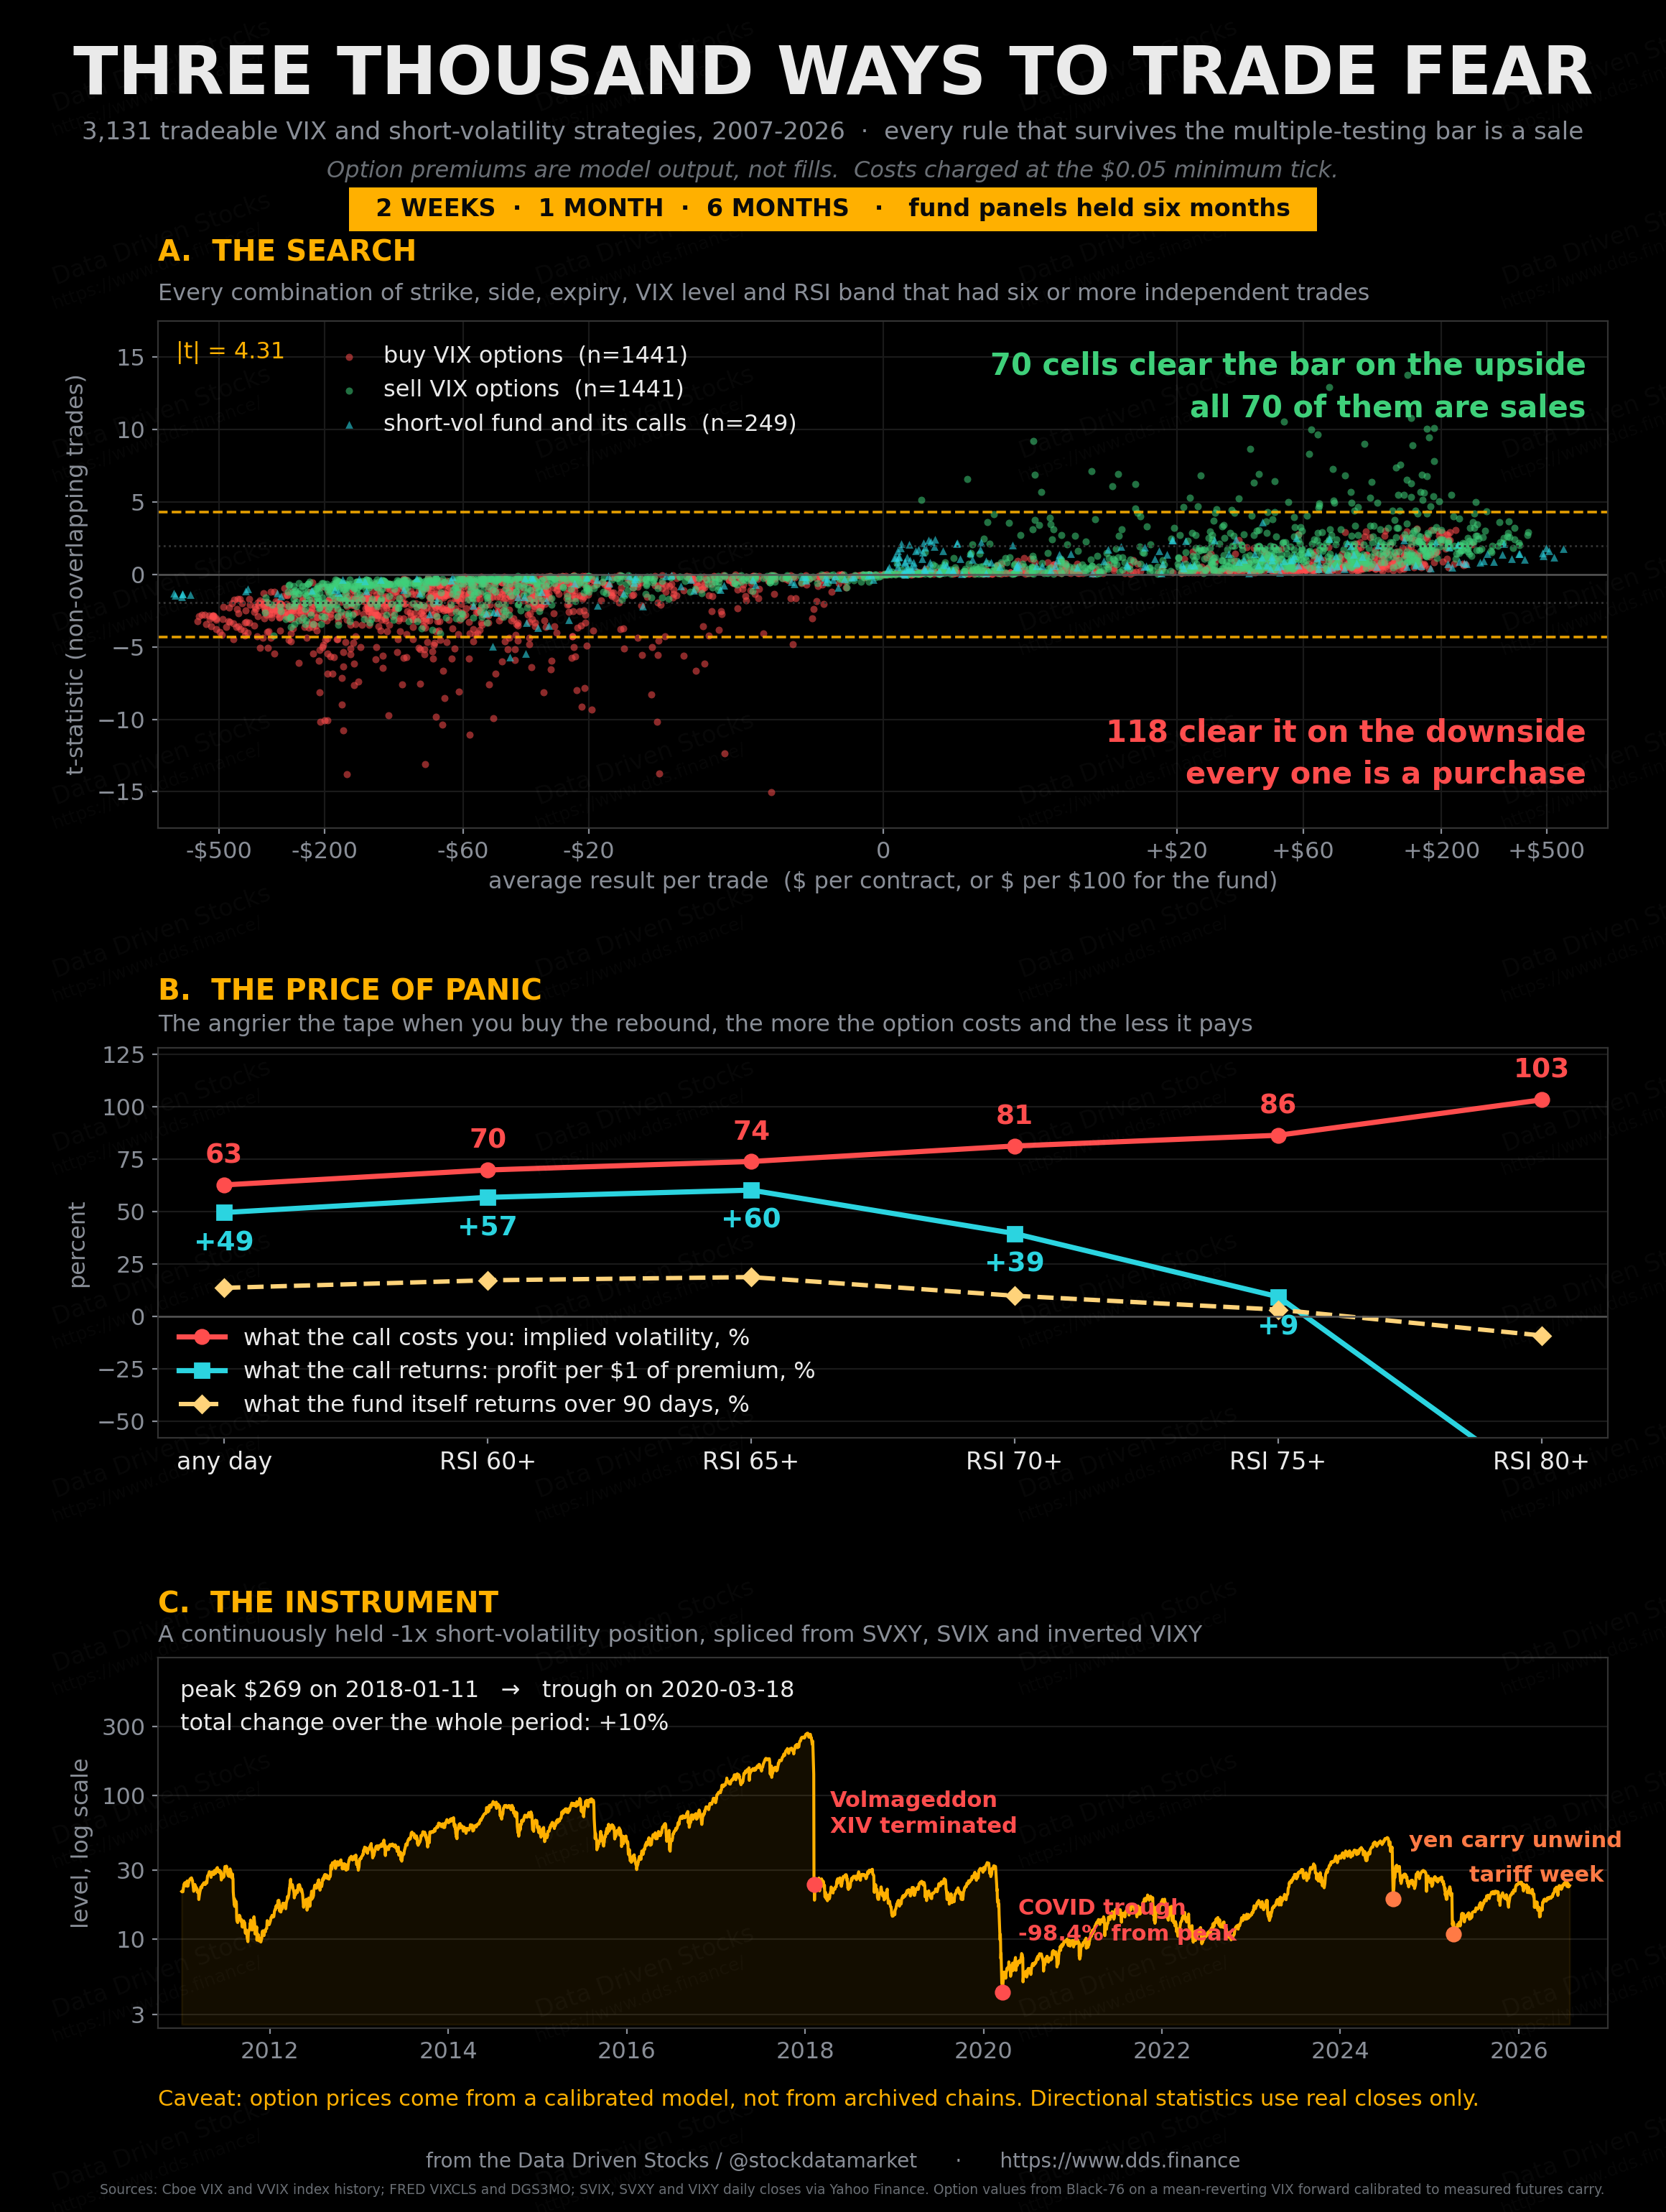
Every strategy below gets tested against two variable - RSI and VIX. In fact there are many more variables that I could add. But that would make the reading much more complicated. So what I did, I did pickup two the most important variables for VIX.
Every contract in this article is one of three lengths and nothing else: two weeks, one month, or six months. Each figure carries an amber tag saying which one it uses, because a result at two weeks and a result at six months are not the same thing. Longer contracts often price-in everything. While shorter are often too short catch the actual move.
Furthermore, all option trades (except the fund one) assume they are being held until expiration! So if one sells them before - they can collect premium or get a better exit point.
Loterry tickets - buying deep OTM VIX calls without a setup
Assume you just discovered VIX calls and think “ohh I will buy it, because VIX always goes up at some point”.
On 5 September 2008 the VIX closed at 23.06. If you buy a 1M (one month expiration) VIX calls, struck fifty percent above spot at 34.50, and it costs you around $10.47 for the whole contract. So around ten cents an option (overall each option contract is sold as a x100 package).
Thirty-one days later, on 6 October, the VIX closed at 52.05. That contract settled at $1,755. So you got 16800% return on each contract. Impressive, no ?
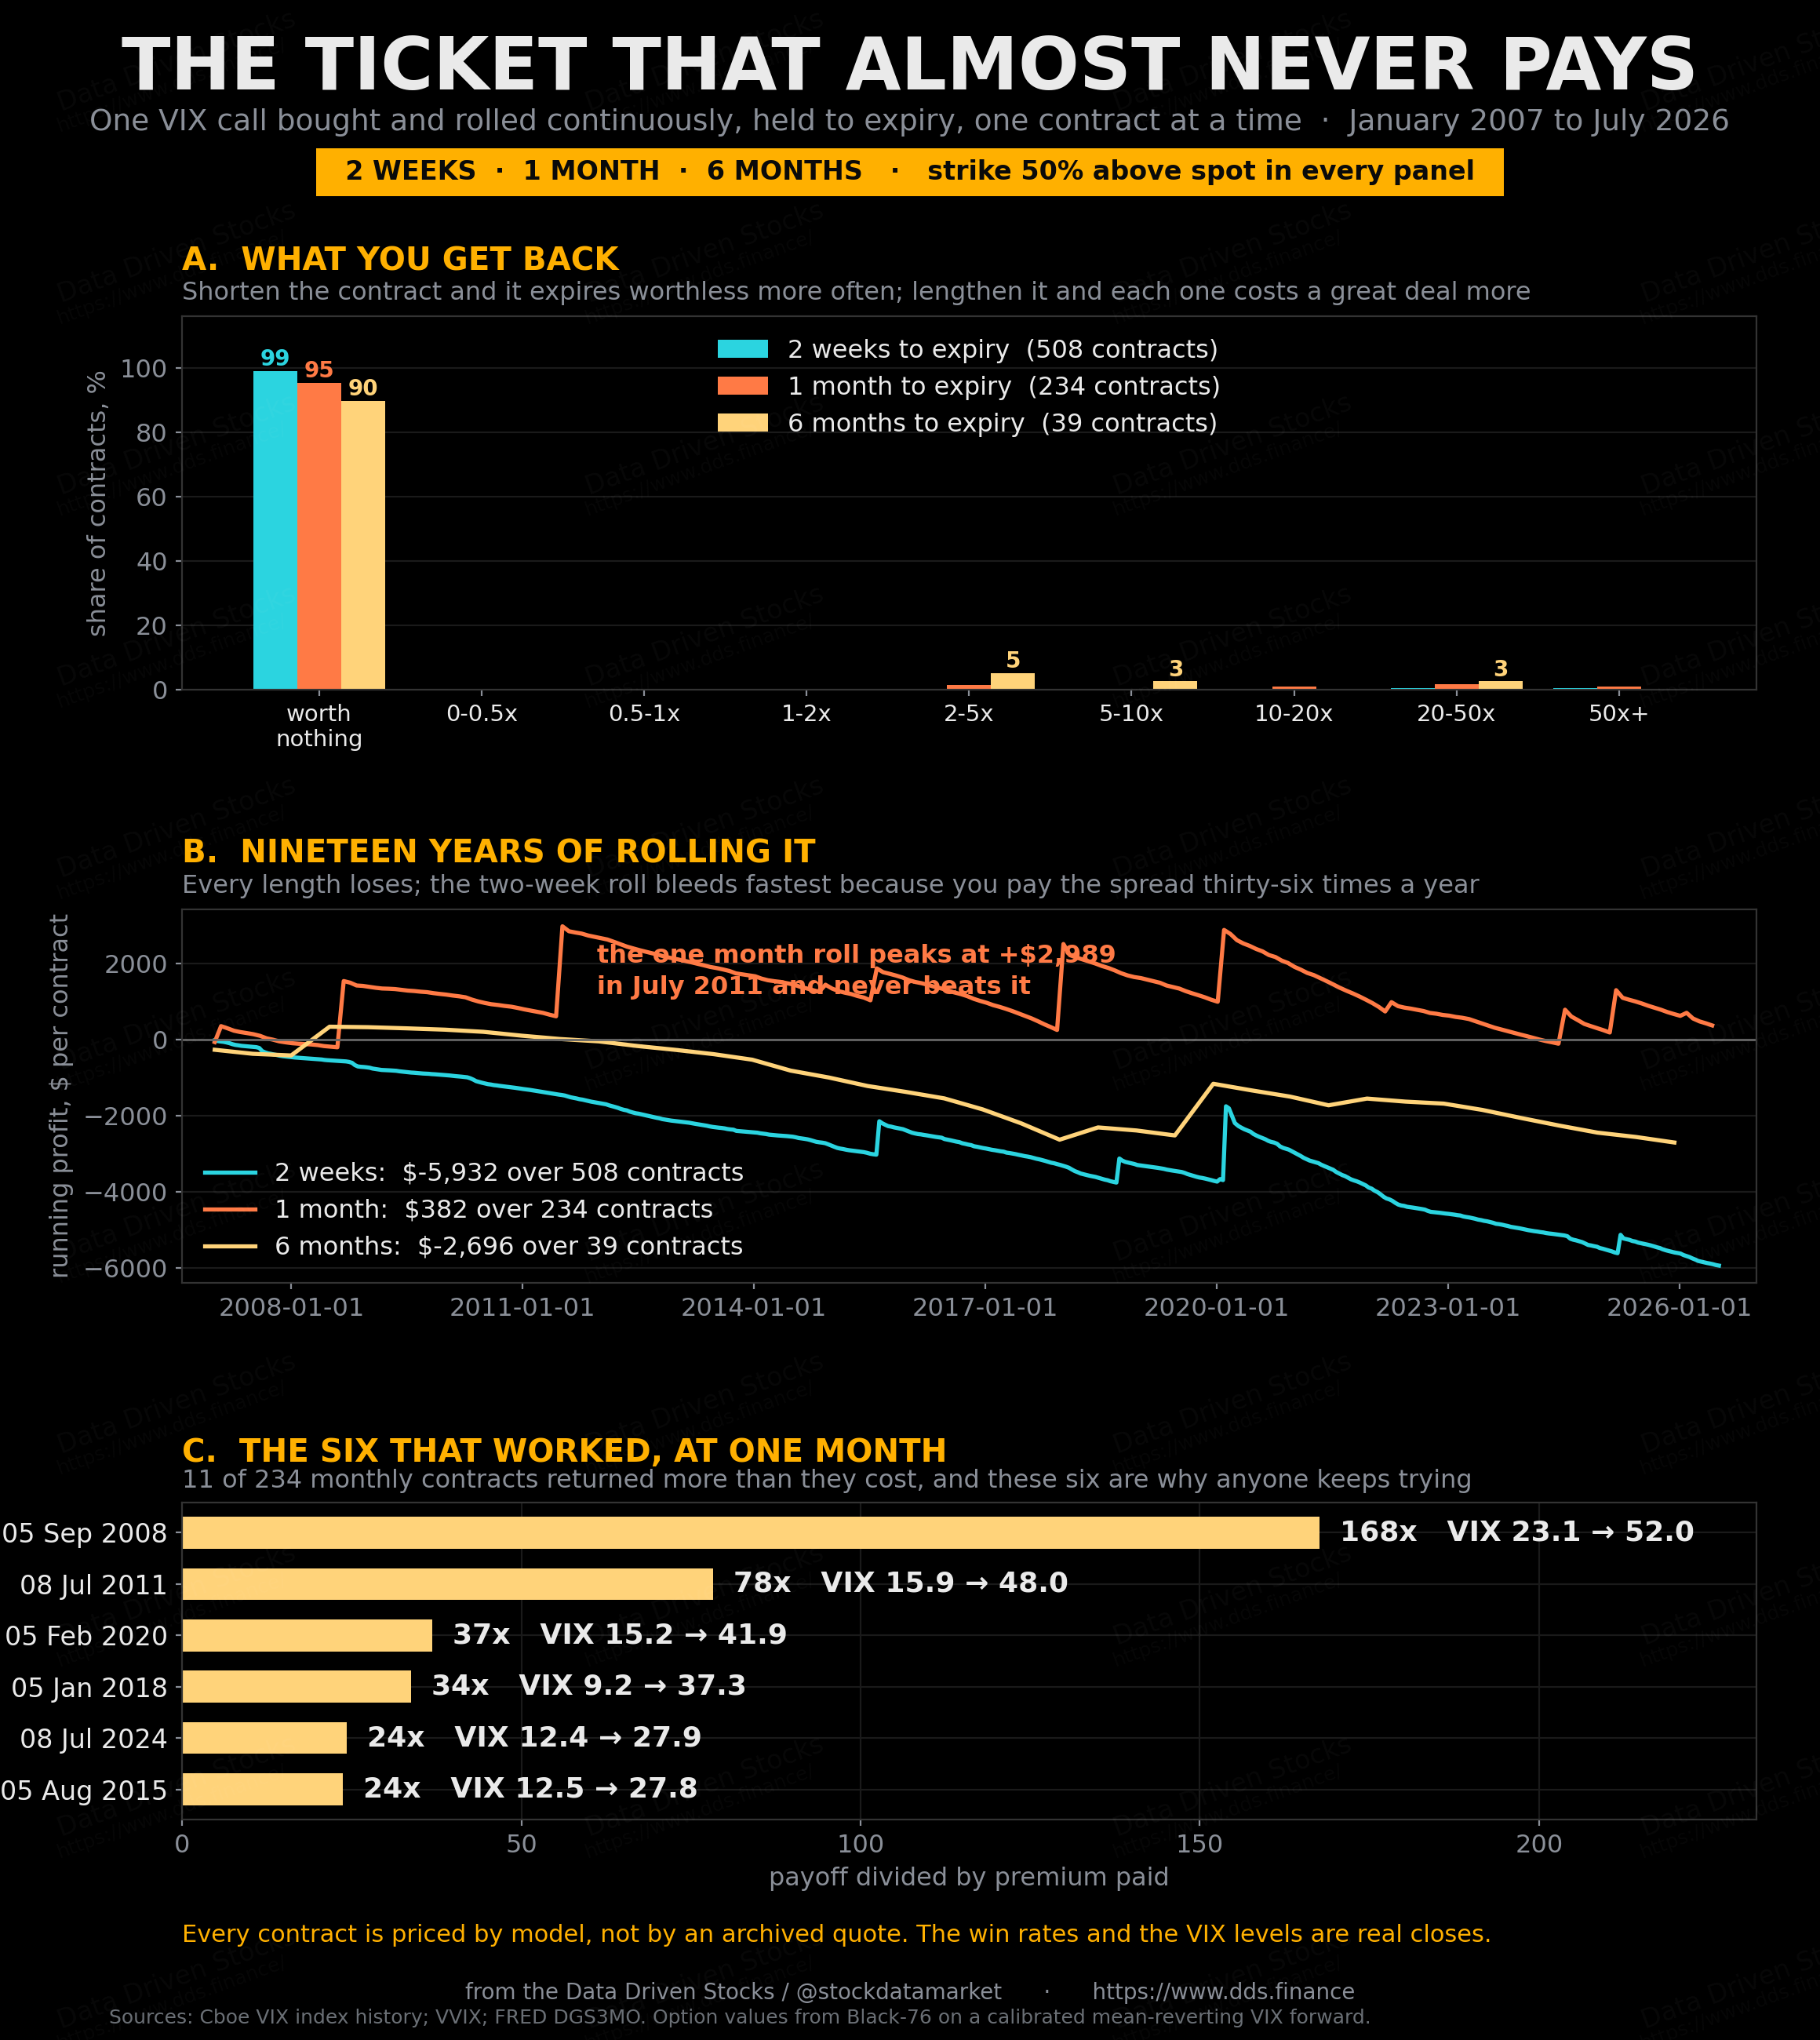
The problem is (panel A) is that most of the time you lose money. And that was a single time where you made a lot. The longer expiry does not save you, and each length fails in its own way.
In the panel B you can see if you repeat buying VIX calls blindly, most of the time you will lose money. Except of the 1M call, which somehow goes between making money, and losing money.
Panel C shows that VIX calls make a lot money in extreme situations. The six trades that carried the monthly version. September 2008. July 2011. February 2020. January 2018. July 2024. August 2015. Every one immediately before a crisis, and not one knowable in advance from anything on the chart. But it shows also one important thing: If you expect a crisis to unfold, and the market does not price-in it yet. You can get a great return! But probability of making a trade like this is close to zero. If you do predict - it’s a feat beyond most of the market gurus.
Let’s dig-in further. Let’s split the same trade across both dials says the same thing in more places, at two lengths.
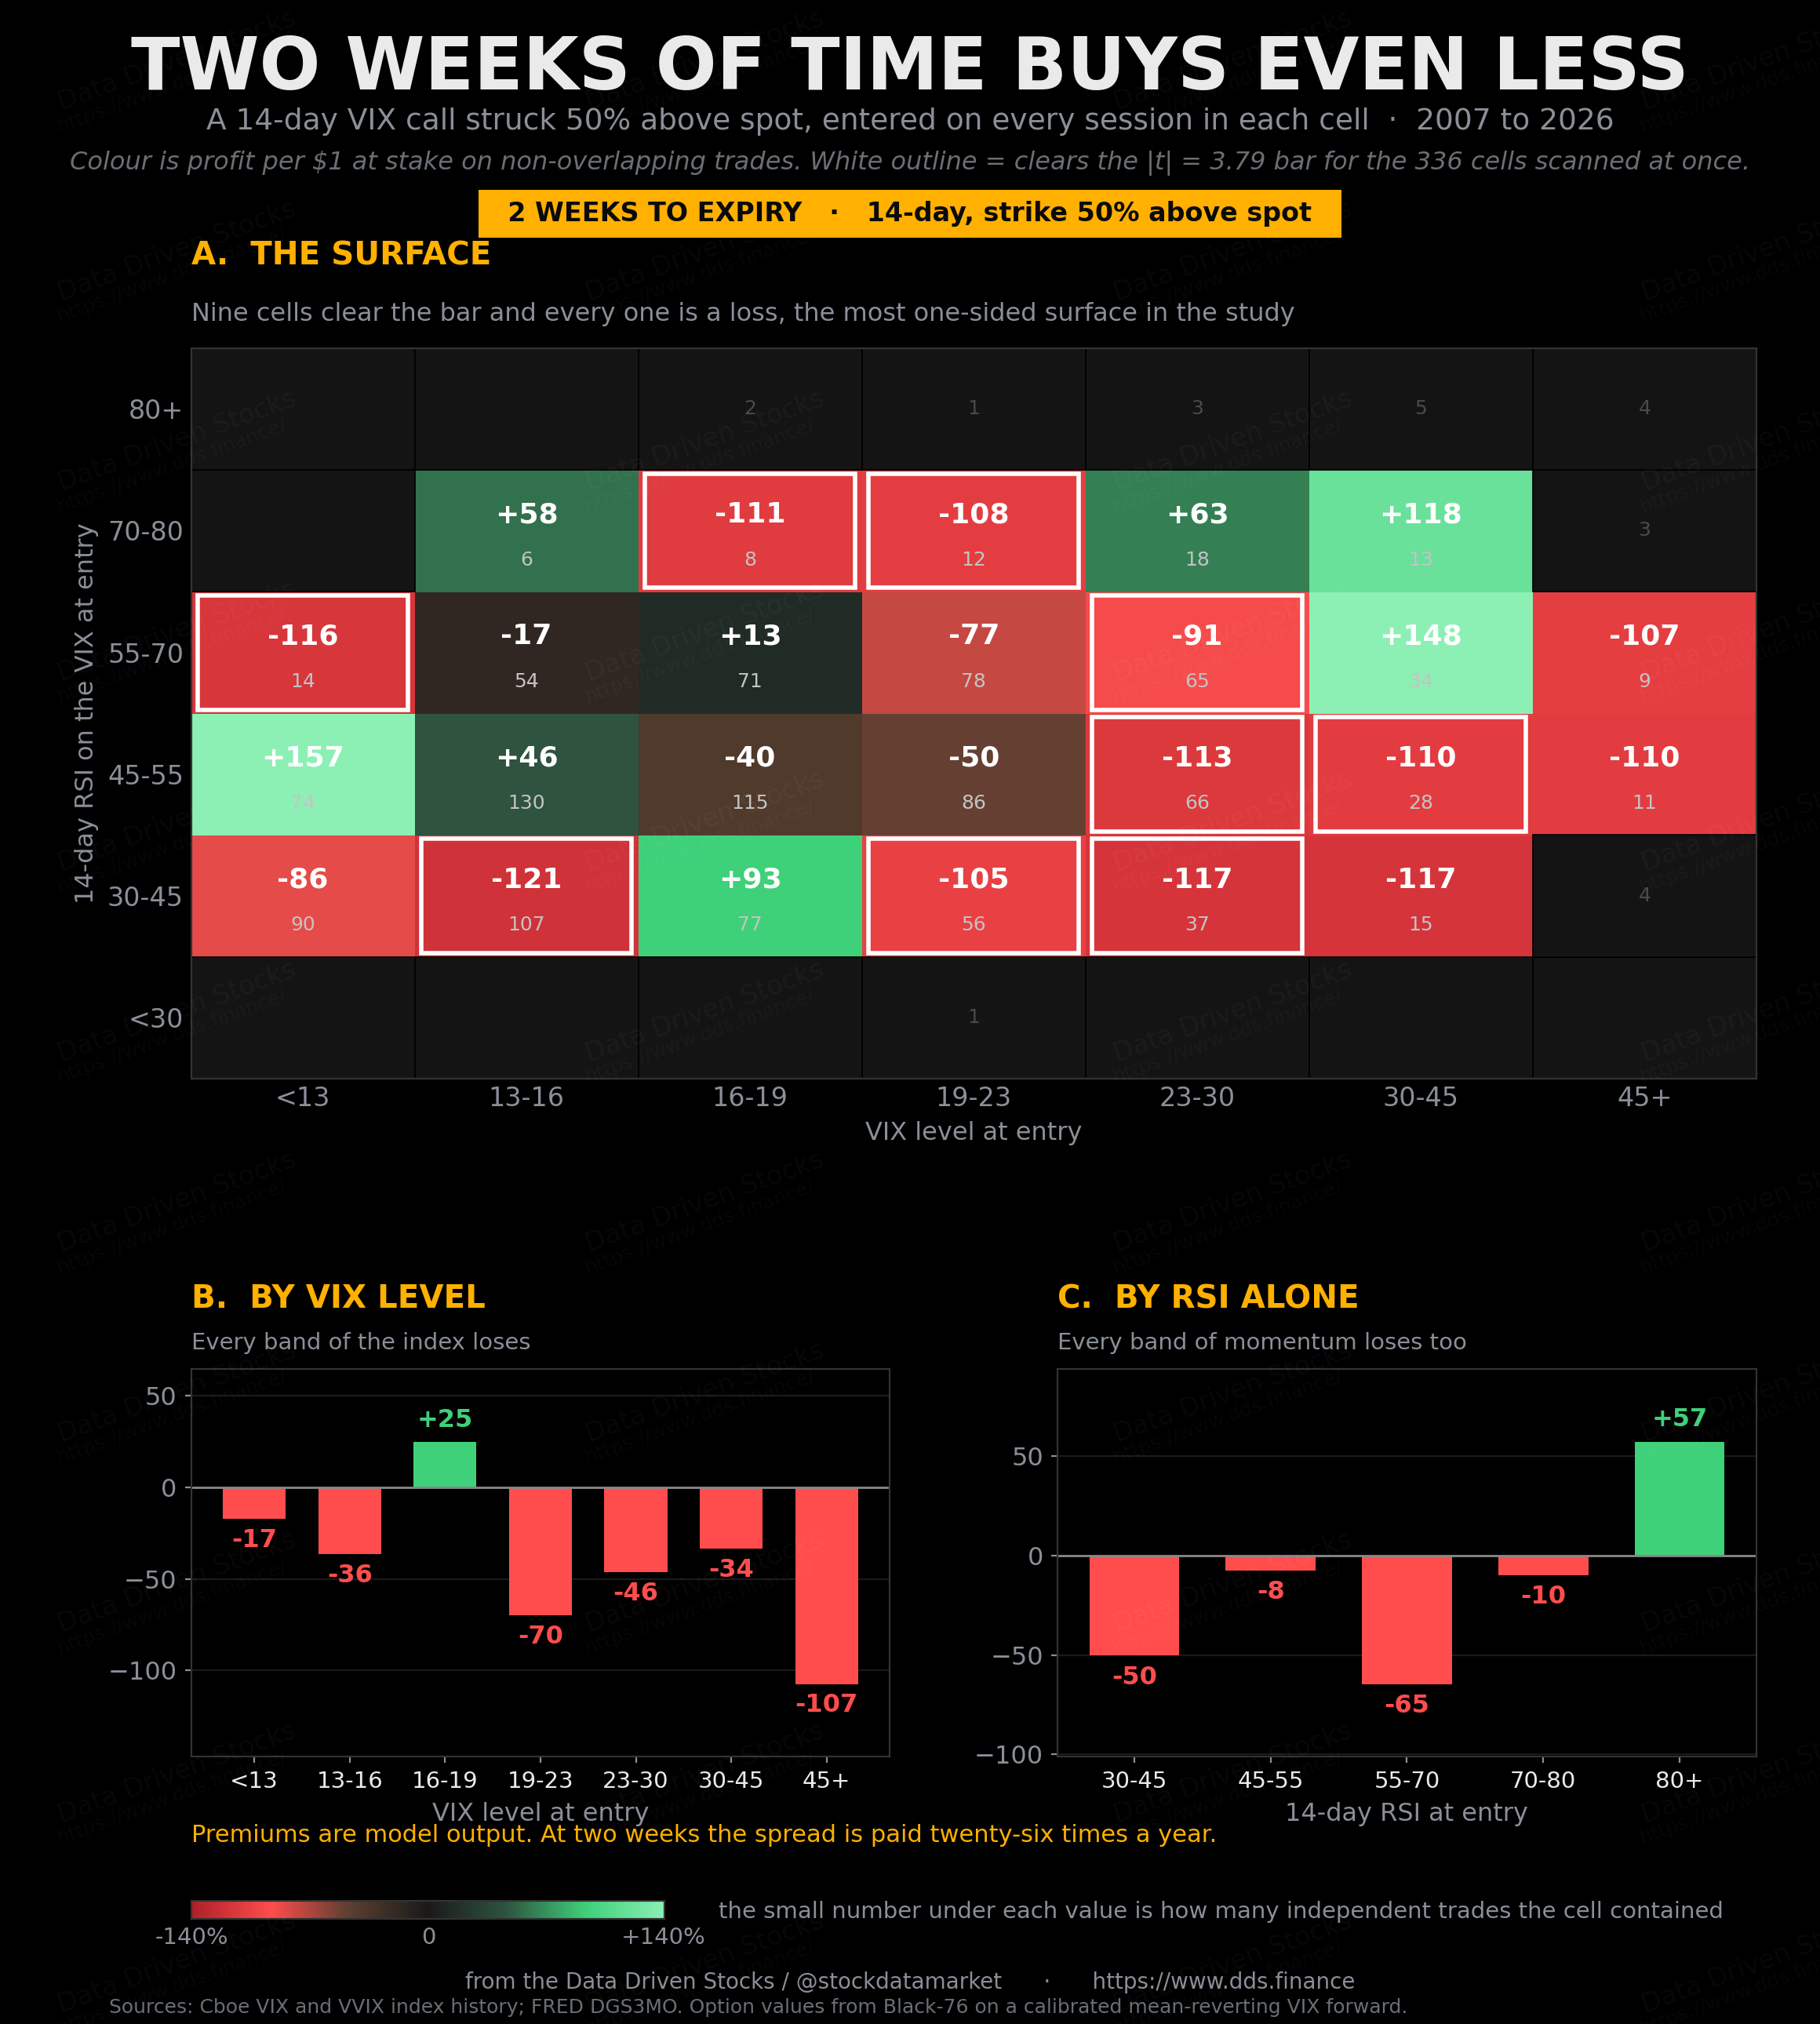
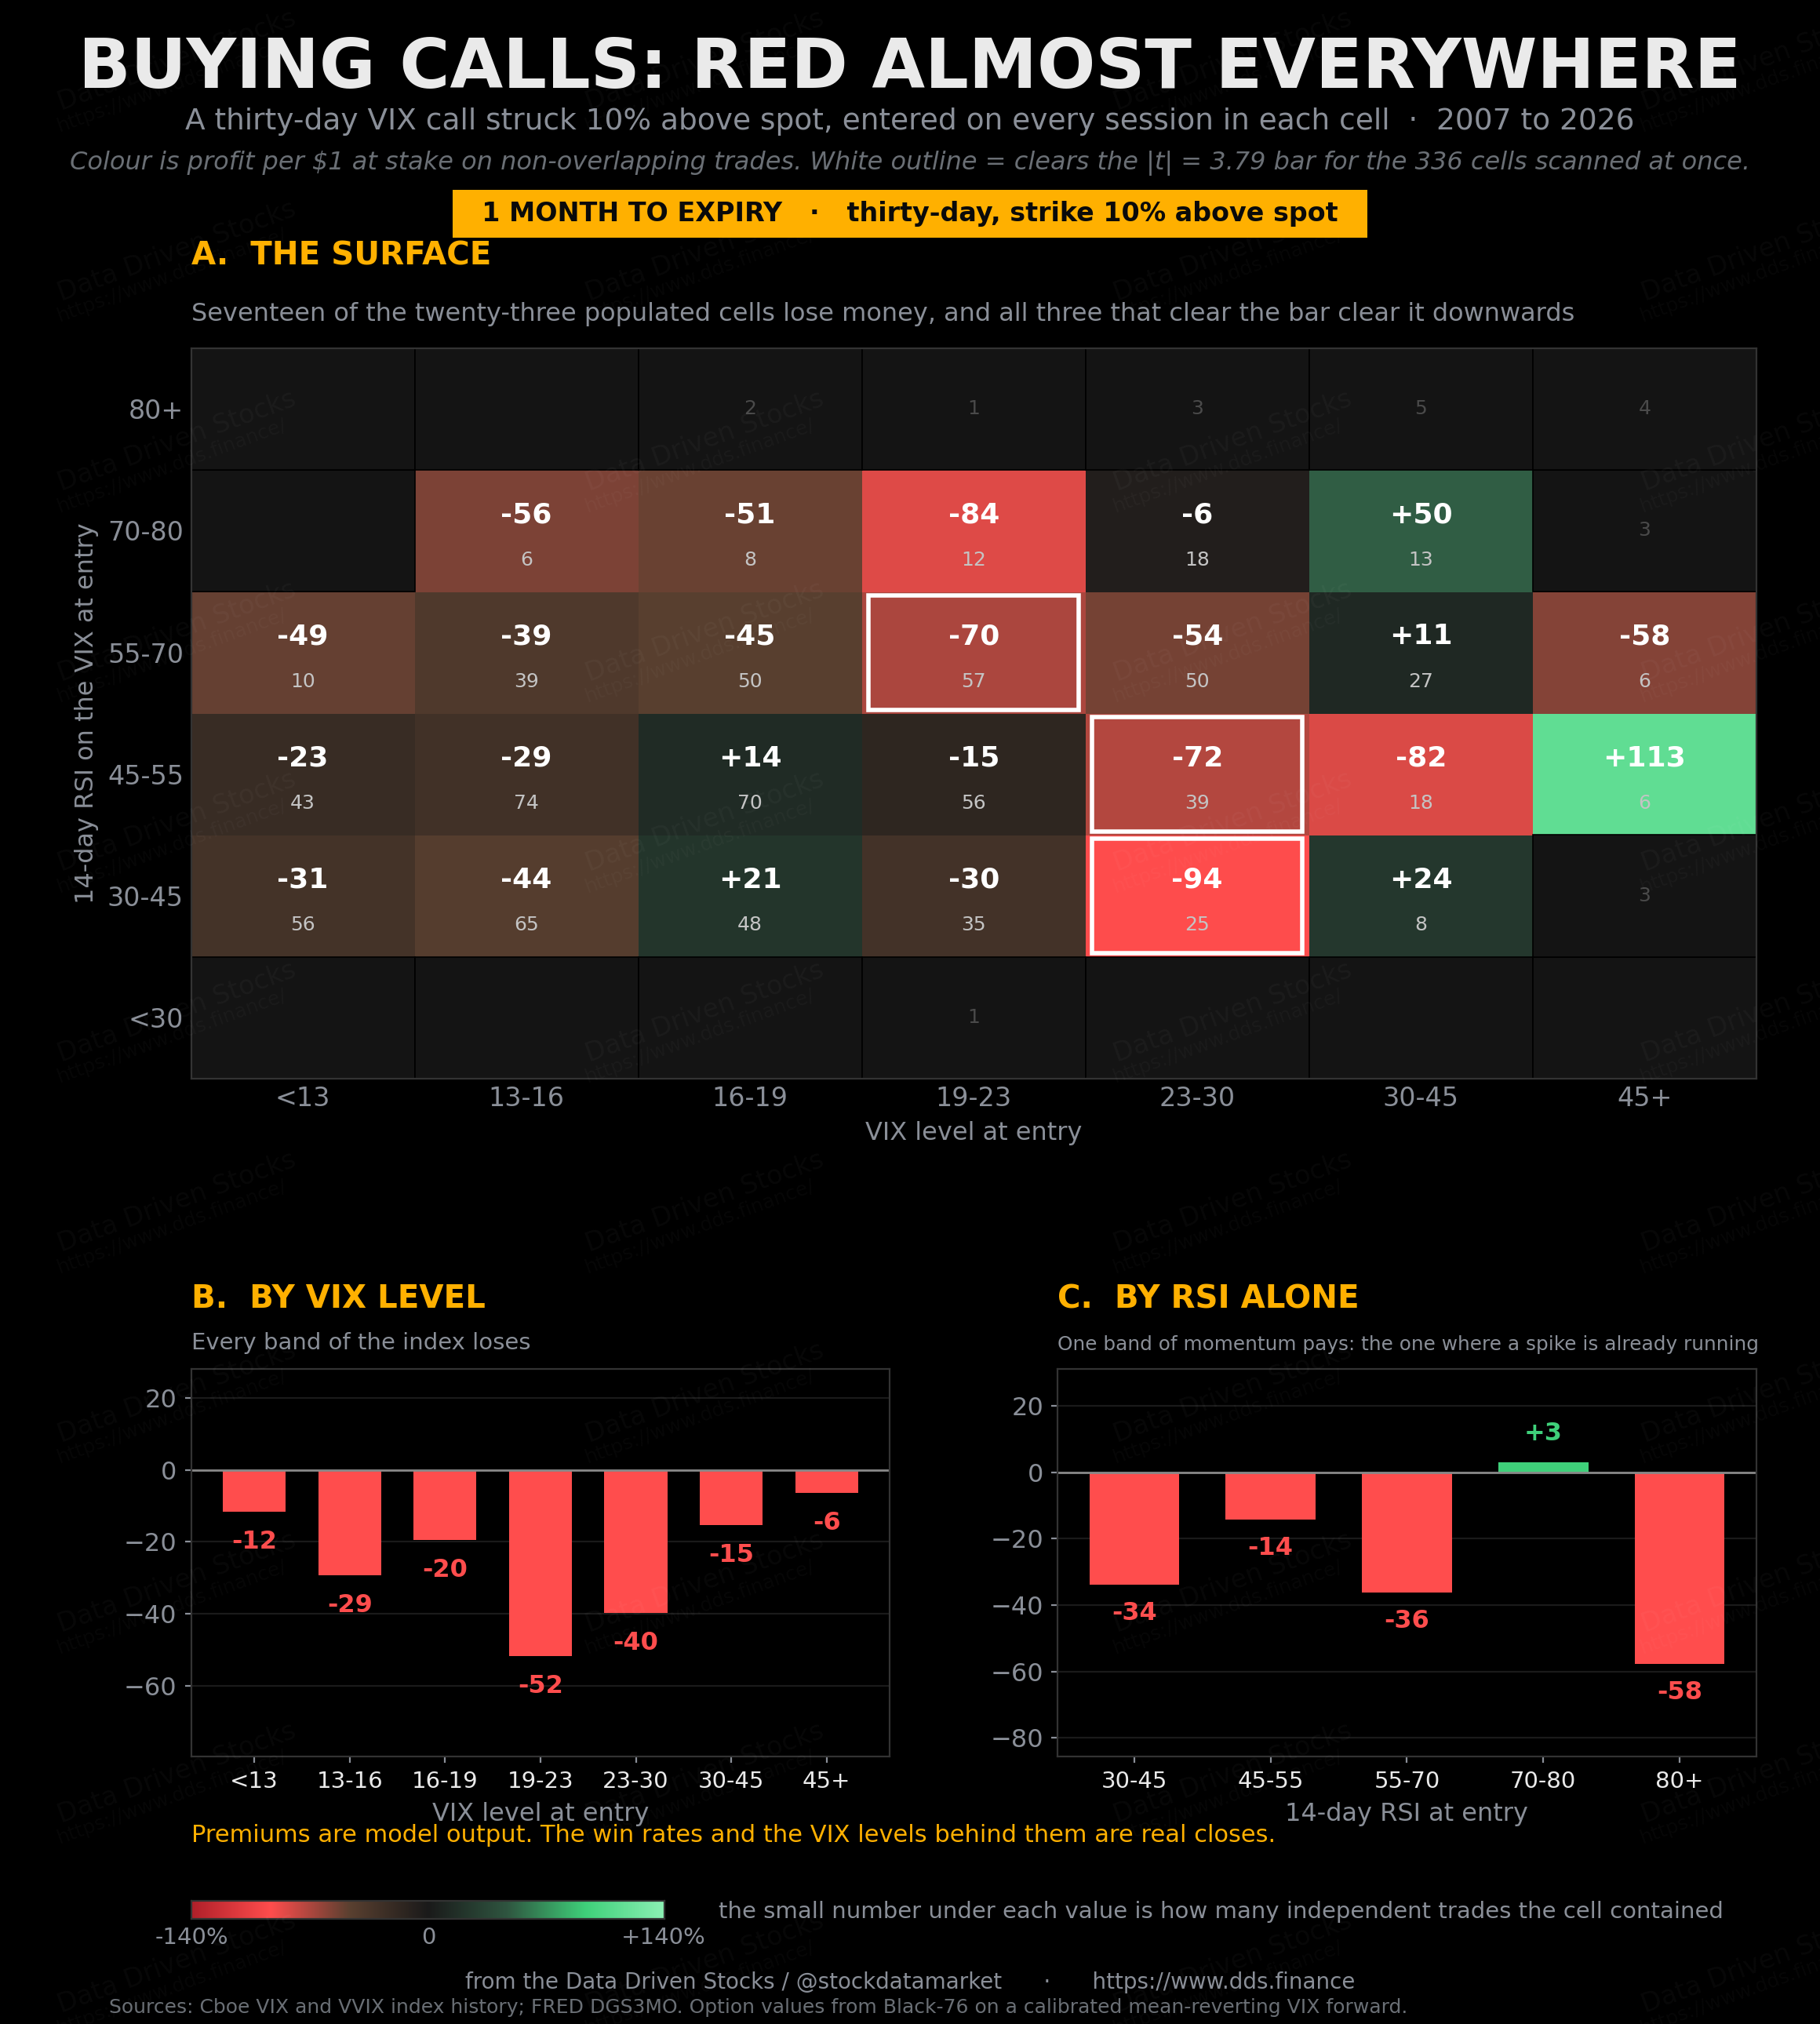
You can see now. That actually 1M VIX calls are not that good. They simply manage to get lower loss than 6M or 2W VIX calls. While what’s interesting are 2W calls (first panel) - they give often a great profit when VIX is oversold (low RSI) or when VIX is on the rise. Those are times when VIX is oversold in times, when VIX should rise, but doesn’t rise. But timing here is the most important factor! Remember those simulations count “until the expiration”. One can sell them on a single spike and get a great profit. This strategy can’t show it.
Buying six-month calls when the VIX is asleep
The first refinement everyone reaches for is patience. Stop buying thirty-day calls into nothing. Wait until the VIX is asleep, under 13 or under 14, then buy six months of time and let the reversion come to you.
The read is correct. From a close under 13, the VIX six months later has a median gain of 19.1%. It is up more than twenty percent on 49.5% of those starts and up more than fifty percent on 29.2% of them. Calm does not last, and the data says so plainly.
Now look at the amber line in panel A, because that is the whole problem.
When the VIX closes under 13 it averages 11.75. The six-month forward on that day averages 18.25. The market is already charging you a 56.4% rise before you have bought anything. The index then delivers a median 19.1%.
You are buying a ticket on a horse that everybody has already backed. The reversion is not a secret. It is the single most documented property the index has, and the futures curve prices it into the strike before you get there.
The surface confirms it and adds one detail I did not expect.
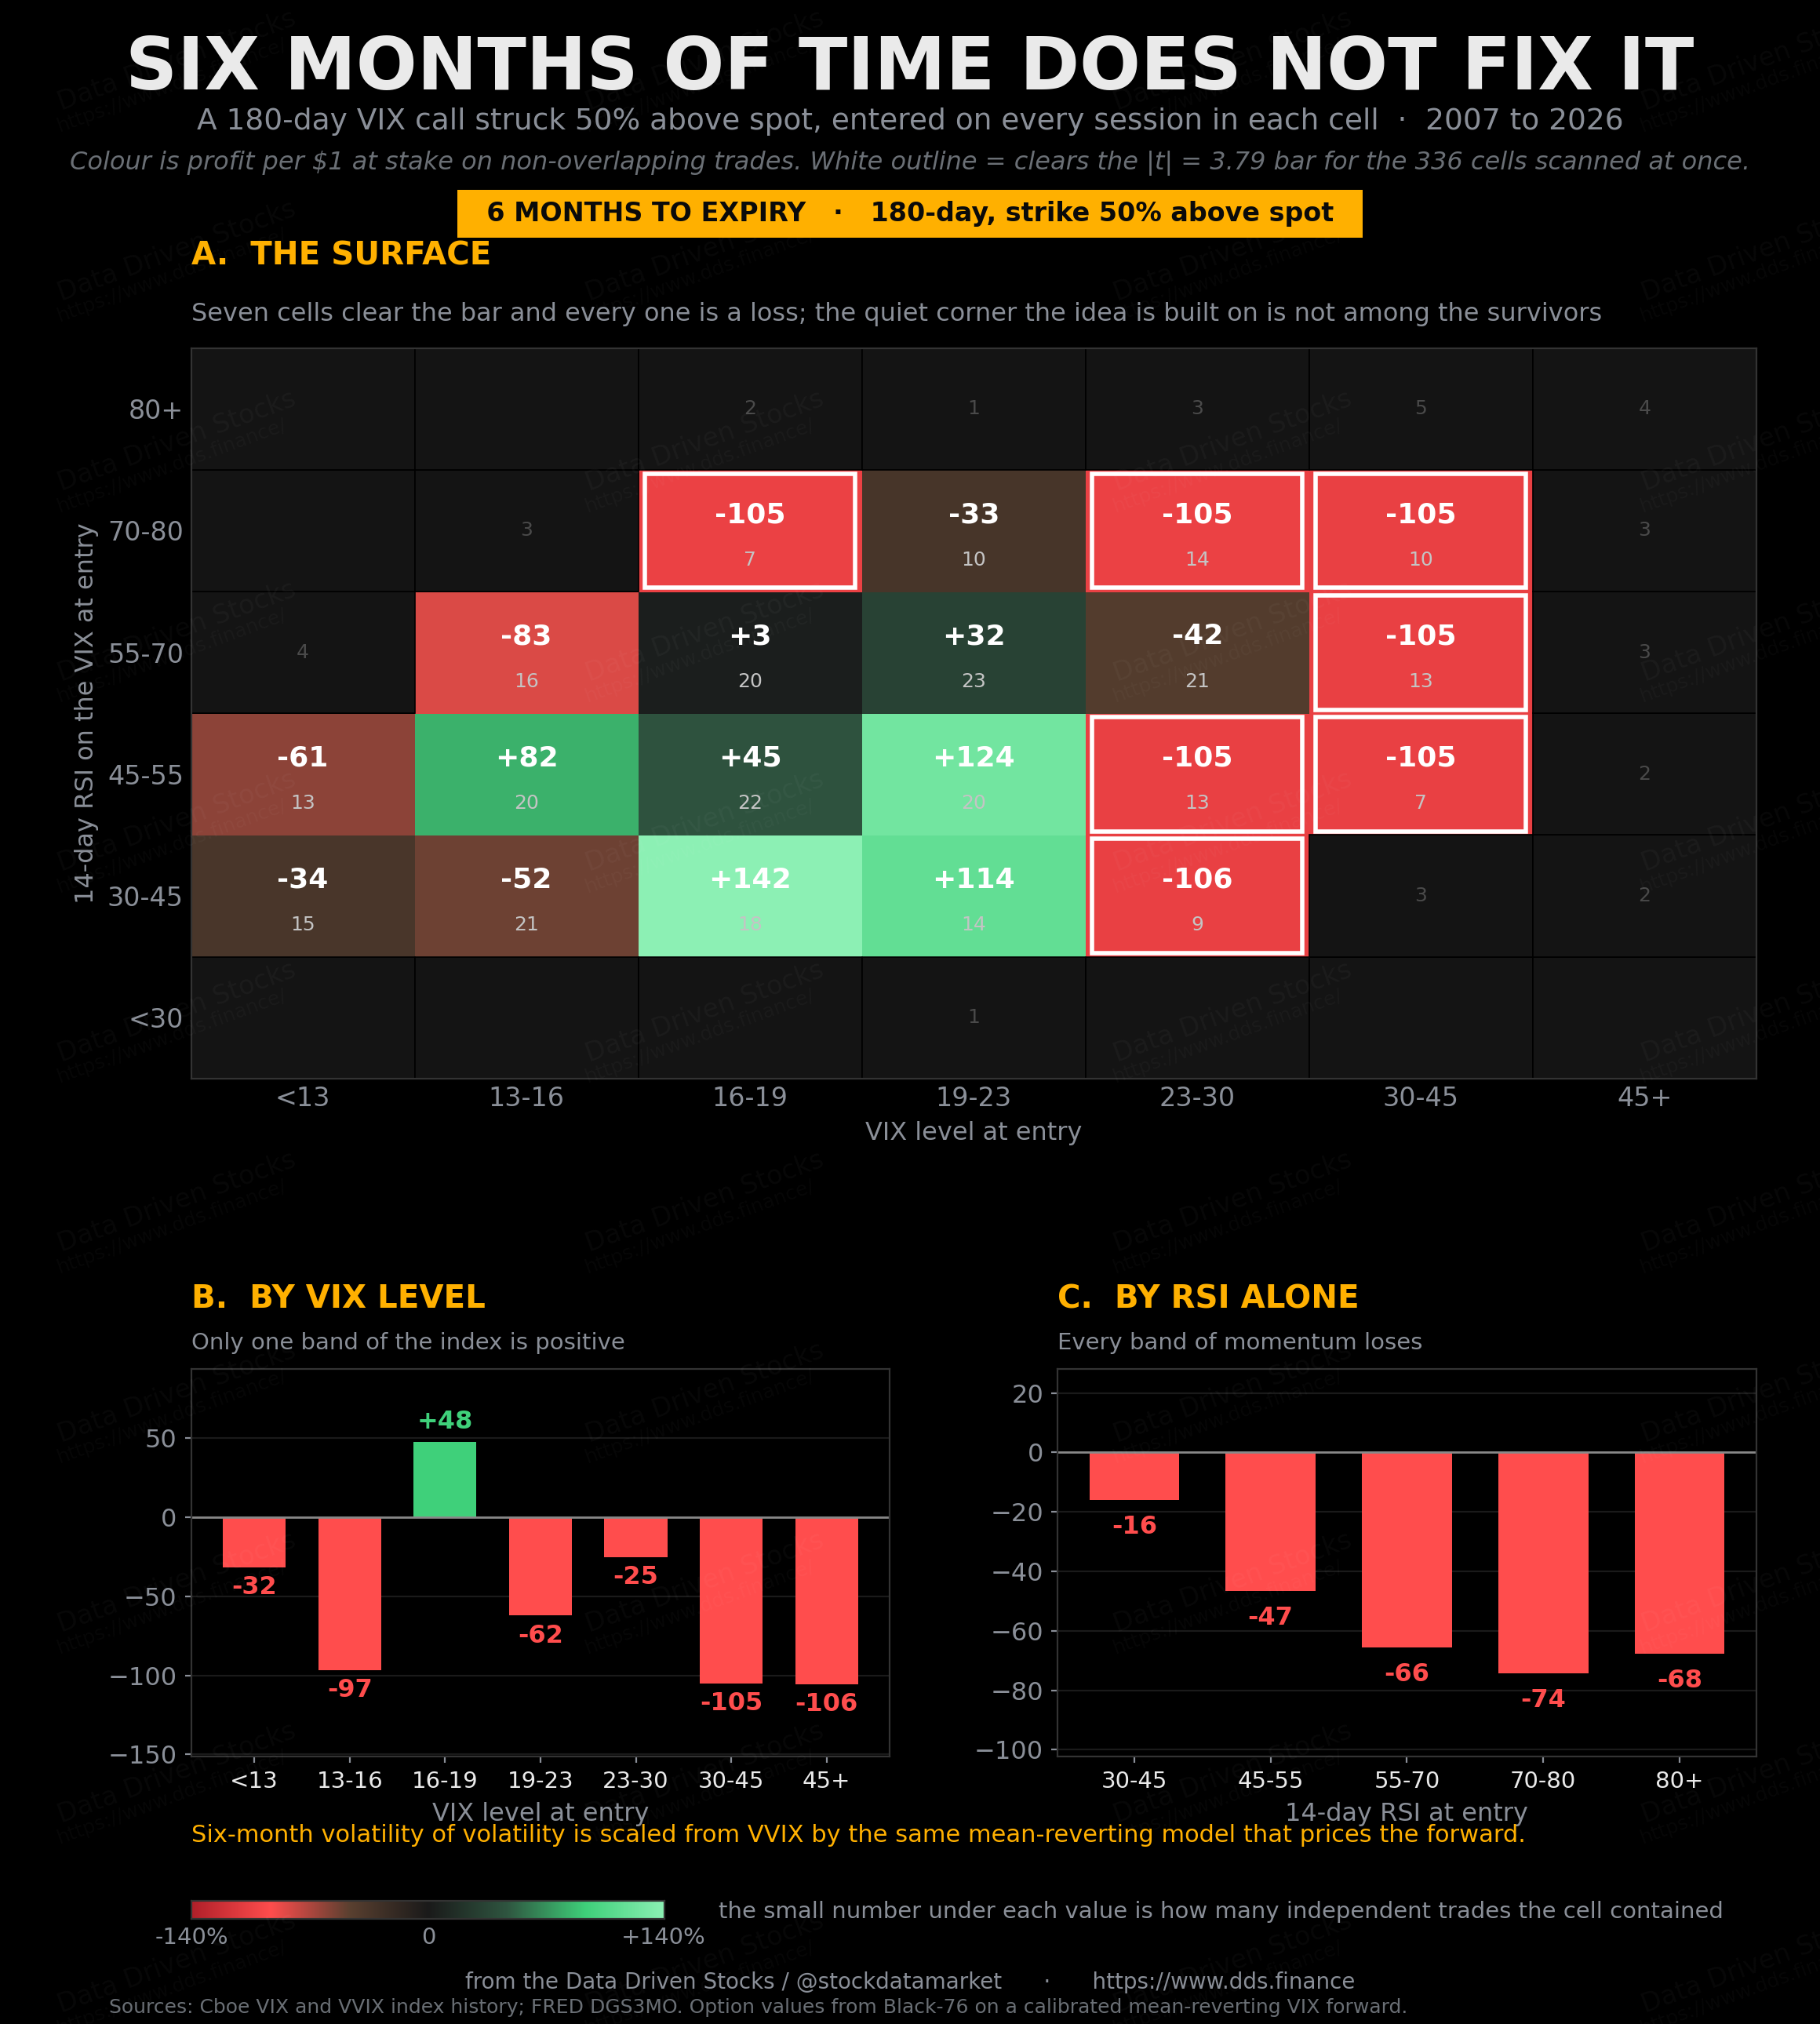
The best single cell on that surface is VIX 16 to 19 with RSI 30 to 45, at plus 142 cents on the dollar over eighteen independent trades. It does not clear the bar. But the location is the lesson. Long convexity paid when the index was ordinary and cooling, not when it was asleep. Furthermore - remember those are graphs are “until the expiration”. So if you did buy 6M calls, and next week VIX went +56% up. Your calls are much more expensive and you can simply sell them, instead of waiting.
Selling one-month calls when the VIX is already extreme
Now the trade with the best win rate in this entire article, and it explains why all funds always short VIX! Why you almost see VIX reversals (and S&P 500 V-recoveries)!
The VIX is above 30. Fear is already priced. Sell a one-month call struck fifty percent above the index, which at VIX 30 means a strike of 45, and collect for the fact that the panic almost never doubles from there.
Almost never.
Those win rates are not a typo. This is the closest thing to free money anywhere in the study.
It holds at the other two lengths as well, which is the first time in this article that a result has survived a change of expiry. At two weeks, selling above VIX 30 makes $13.30 a contract on 67 trades. At six months it makes $114.50 on sixteen trades and never lost once. The direction is the same at every horizon; only the size of the cheque changes.
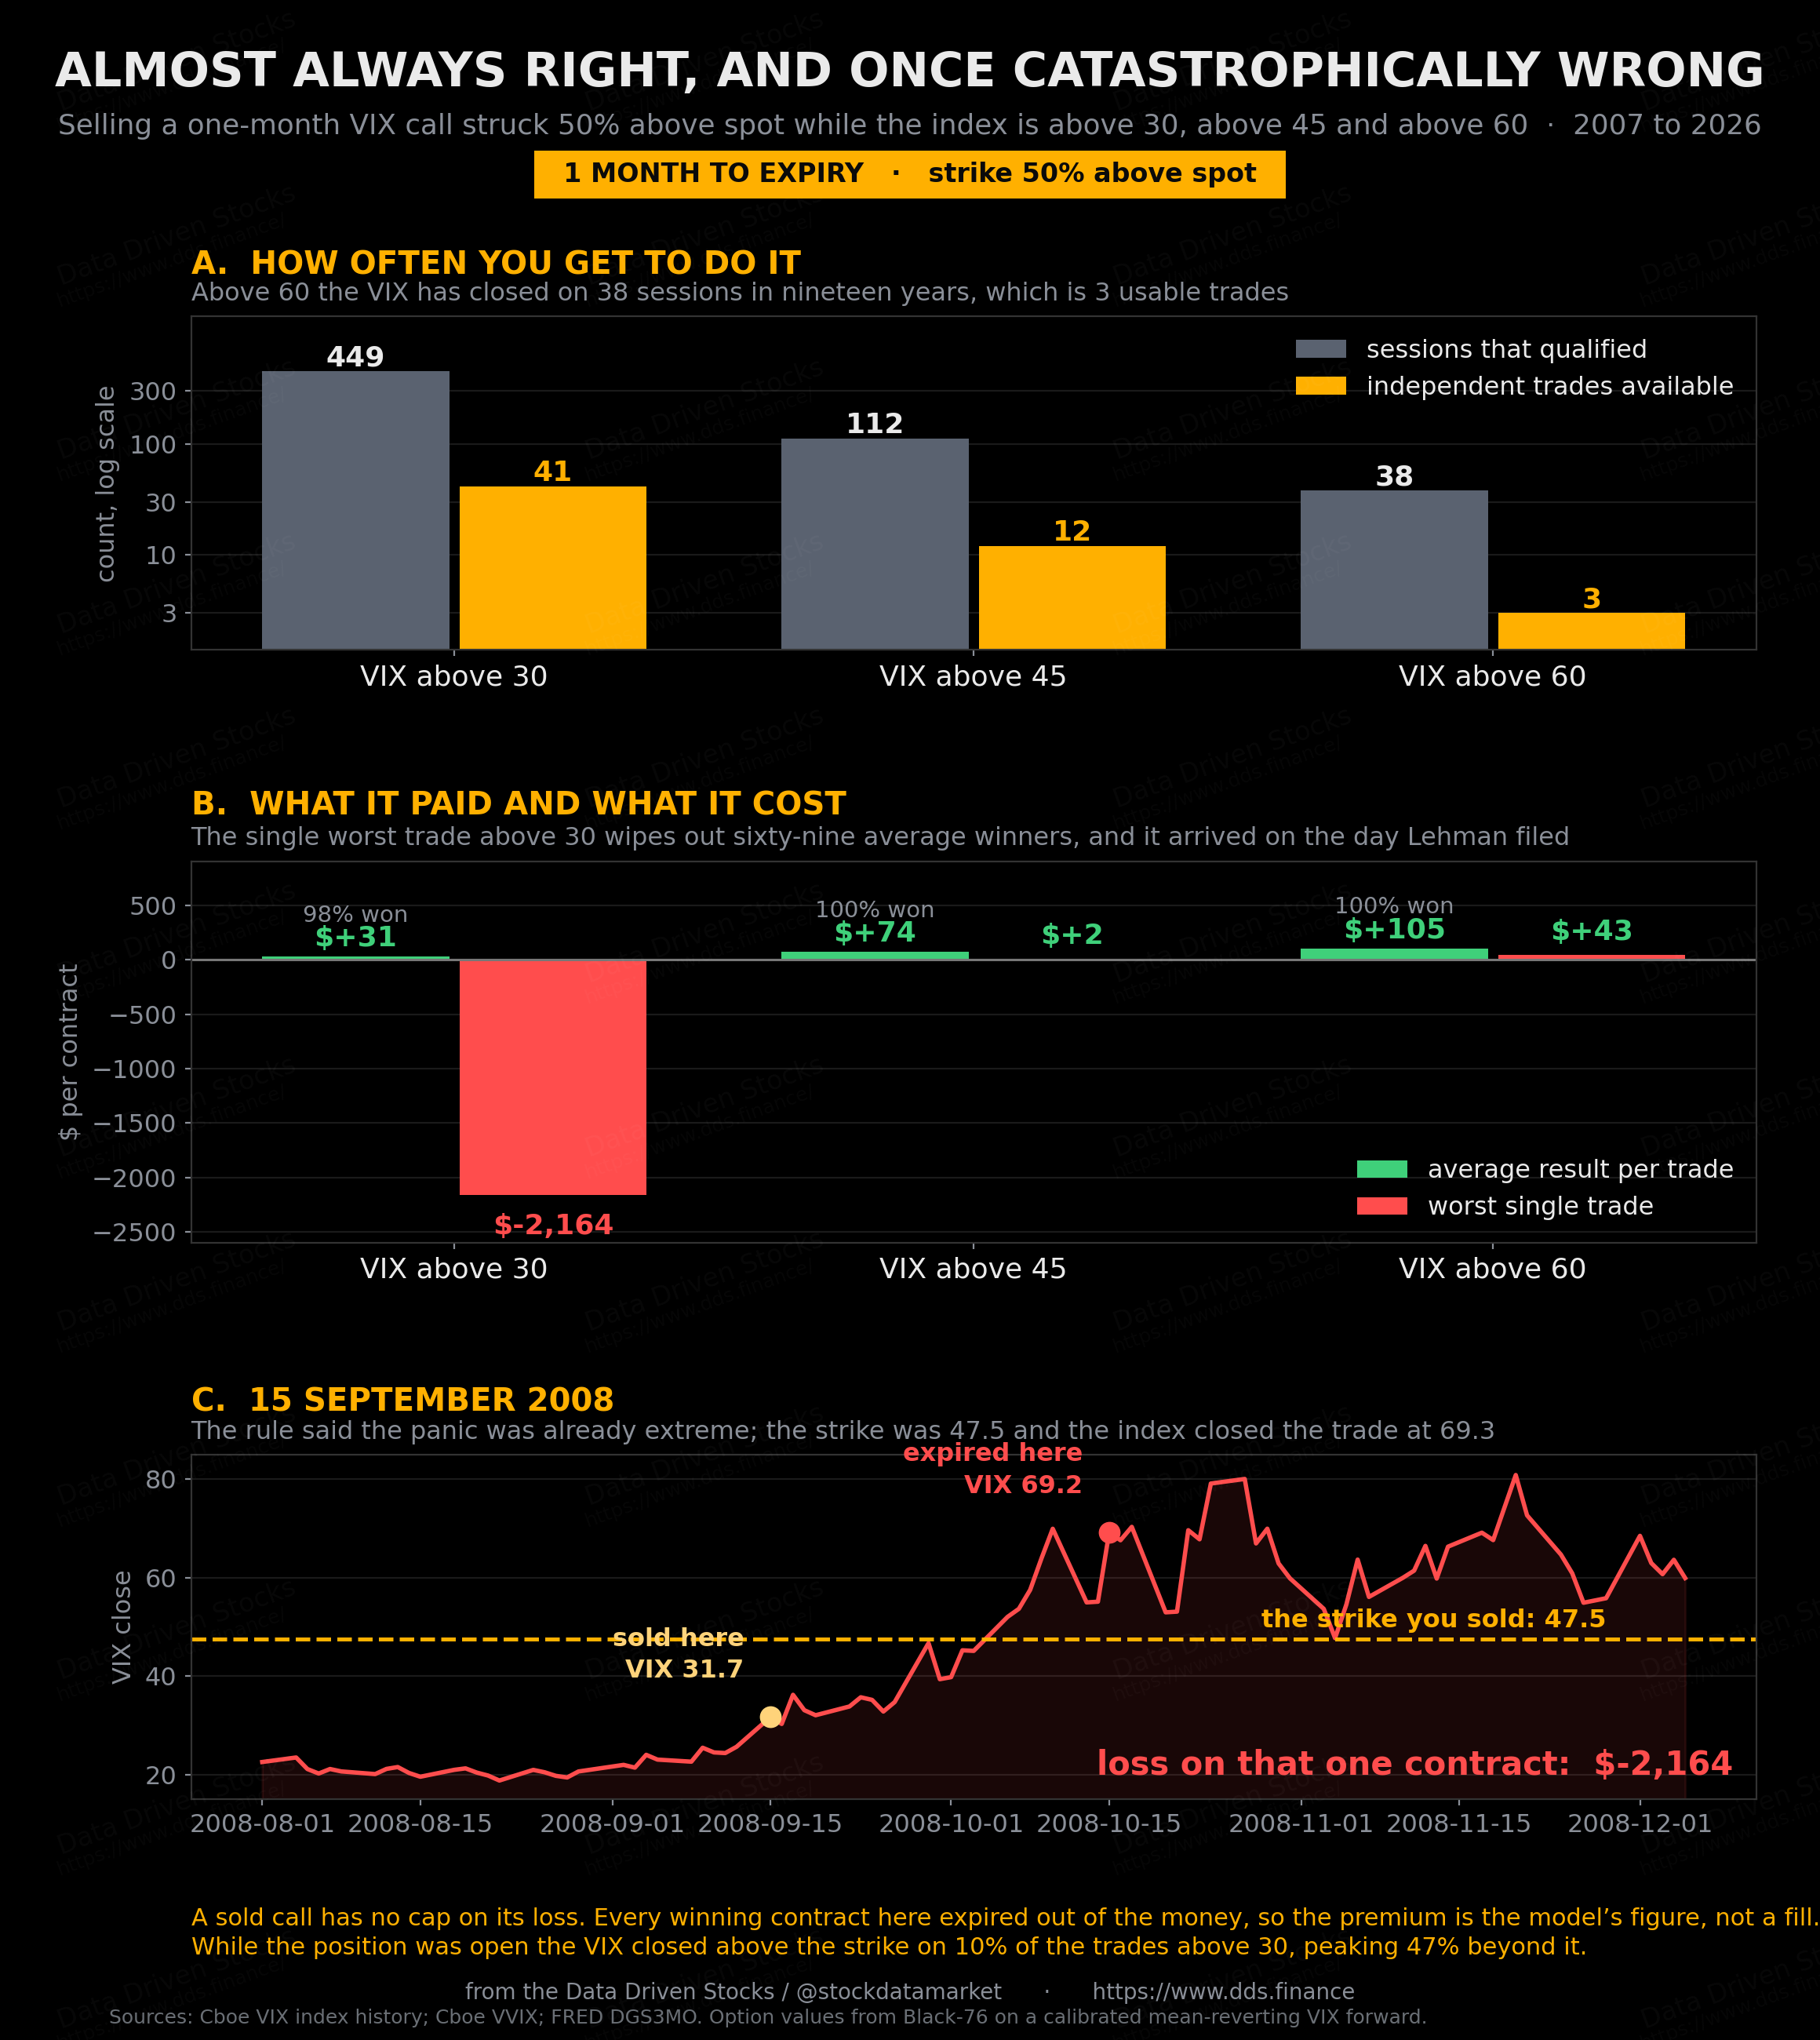
The single losing trade above VIX 30 costs $2,164. The average winner makes $31.30. One loss cancels 19 years of profit here. But that’s only when volmaggedon comes. So the trade should never be automatic!
The date on that trade is 15 September 2008. The morning Lehman filed. But similar loss is going to happen when VIX does explode exponentially.
Panel C draws it. The strike sits as a dashed line across the middle of the chart and the index simply walks through it and keeps going.
Two more things make this worse than the win rate suggests.
A sold call has no ceiling on its loss. The put sales layer in this article are bounded, because the VIX cannot fall below zero. Here the worst case is whatever the index decides to do, and the index has printed 82.69.
And the position hurts long before it settles. On ten percent of the trades above VIX 30 the index closed above the strike at some point while the position was open, reaching 47% beyond it at the worst. Even the trades that finished fine spent time deeply underwater, and a broker looking at that mark does not care that it settles in a month. So you will be forced to buy back shorted VIX calls.
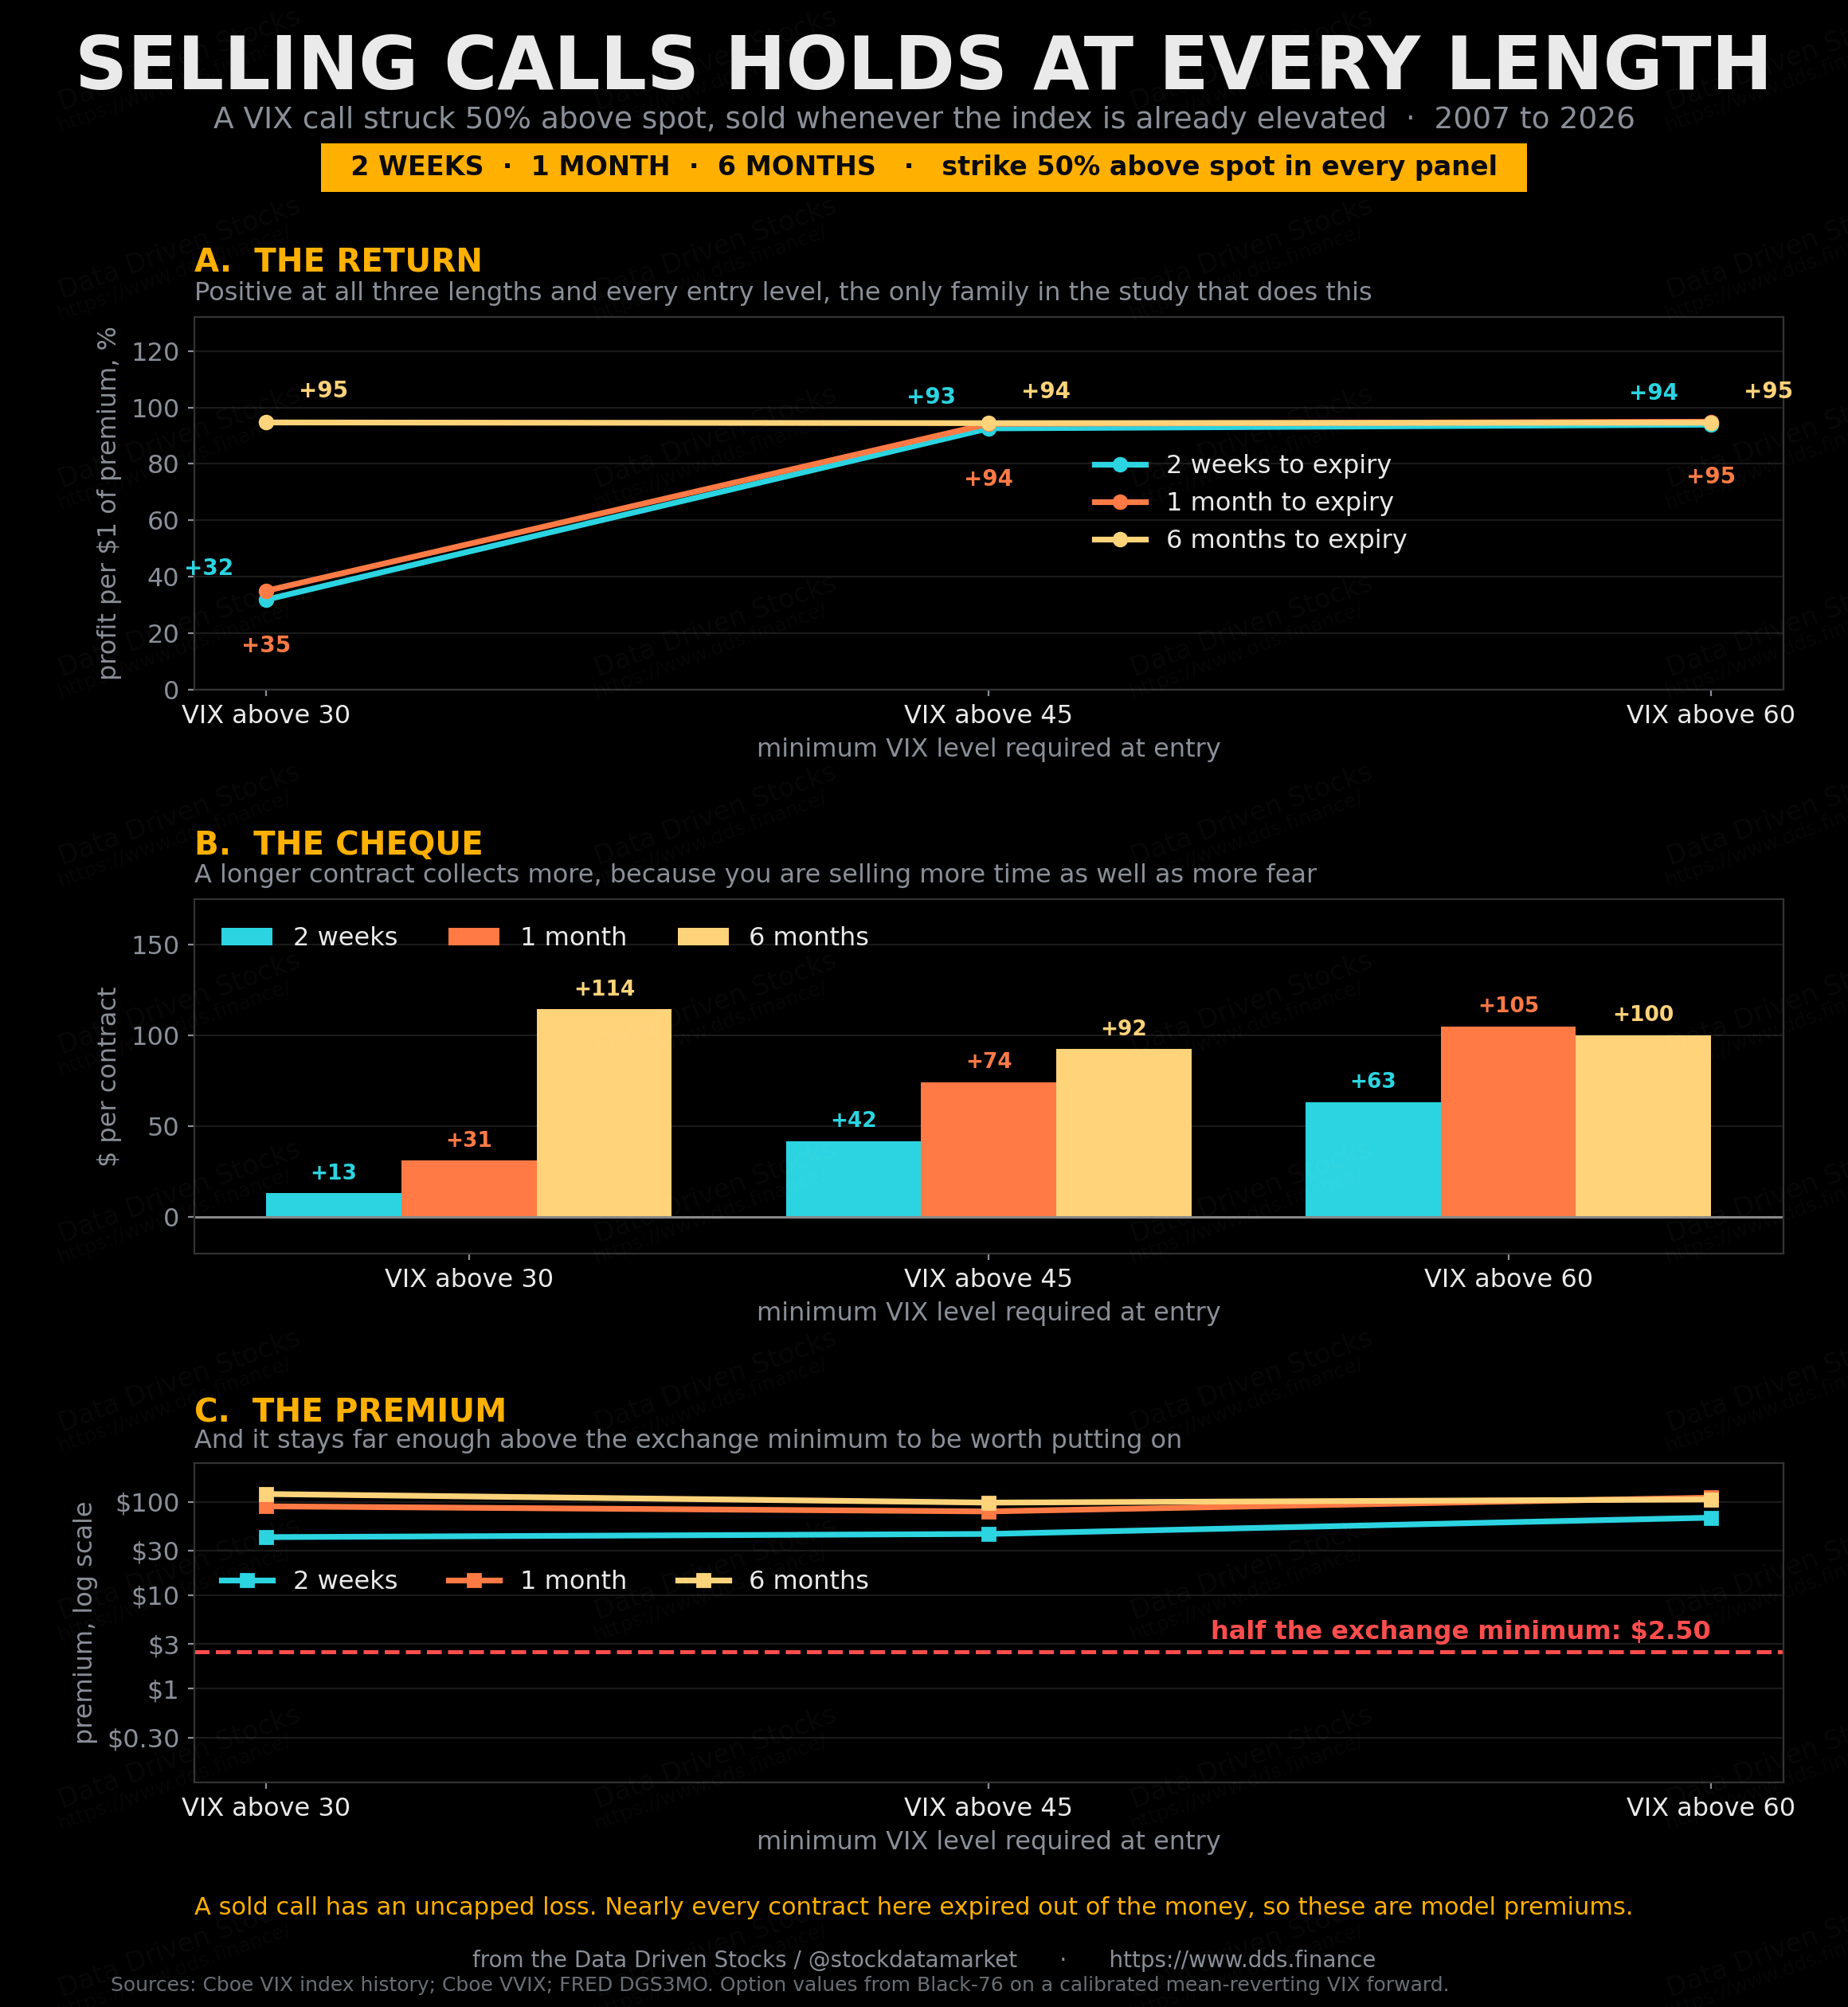
Every point on panel A is positive. Nine combinations of length and entry level, all green, ranging from plus 32 cents on the dollar to plus 95. No other family in this study manages that.
The reason panel C matters is that it rules out the failure mode from the previous sections. These contracts cost between $42 and $121, which is fifteen to fifty times the exchange minimum you have to cross. Whatever kills the low-VIX trades is not operating here.
The setups above 45 and above 60 look cleaner, and that is a sample size artifact rather than a discovery. Above 60, the VIX has closed on 38 sessions in nineteen years, which is 0.77% of the all years when VIX was open, and produces exactly three independent trades: October 2008, November 2008, and 12 March 2020. Three observations from two crises. You cannot build anything on that, and the reason the record is perfect is that there were not enough attempts for it to break.
Every winning contract in this section expired out of the money. Nothing ever paid out. So the money is the premium my model calculated, and I would take that figure less seriously here than anywhere else in the article, because deep out-of-the-money VIX calls during a crisis are exactly where any pricing model is least trustworthy and where the market charges the most.
Across the full surface the sale holds up better than the section above suggests. Almost everything is a win!
