


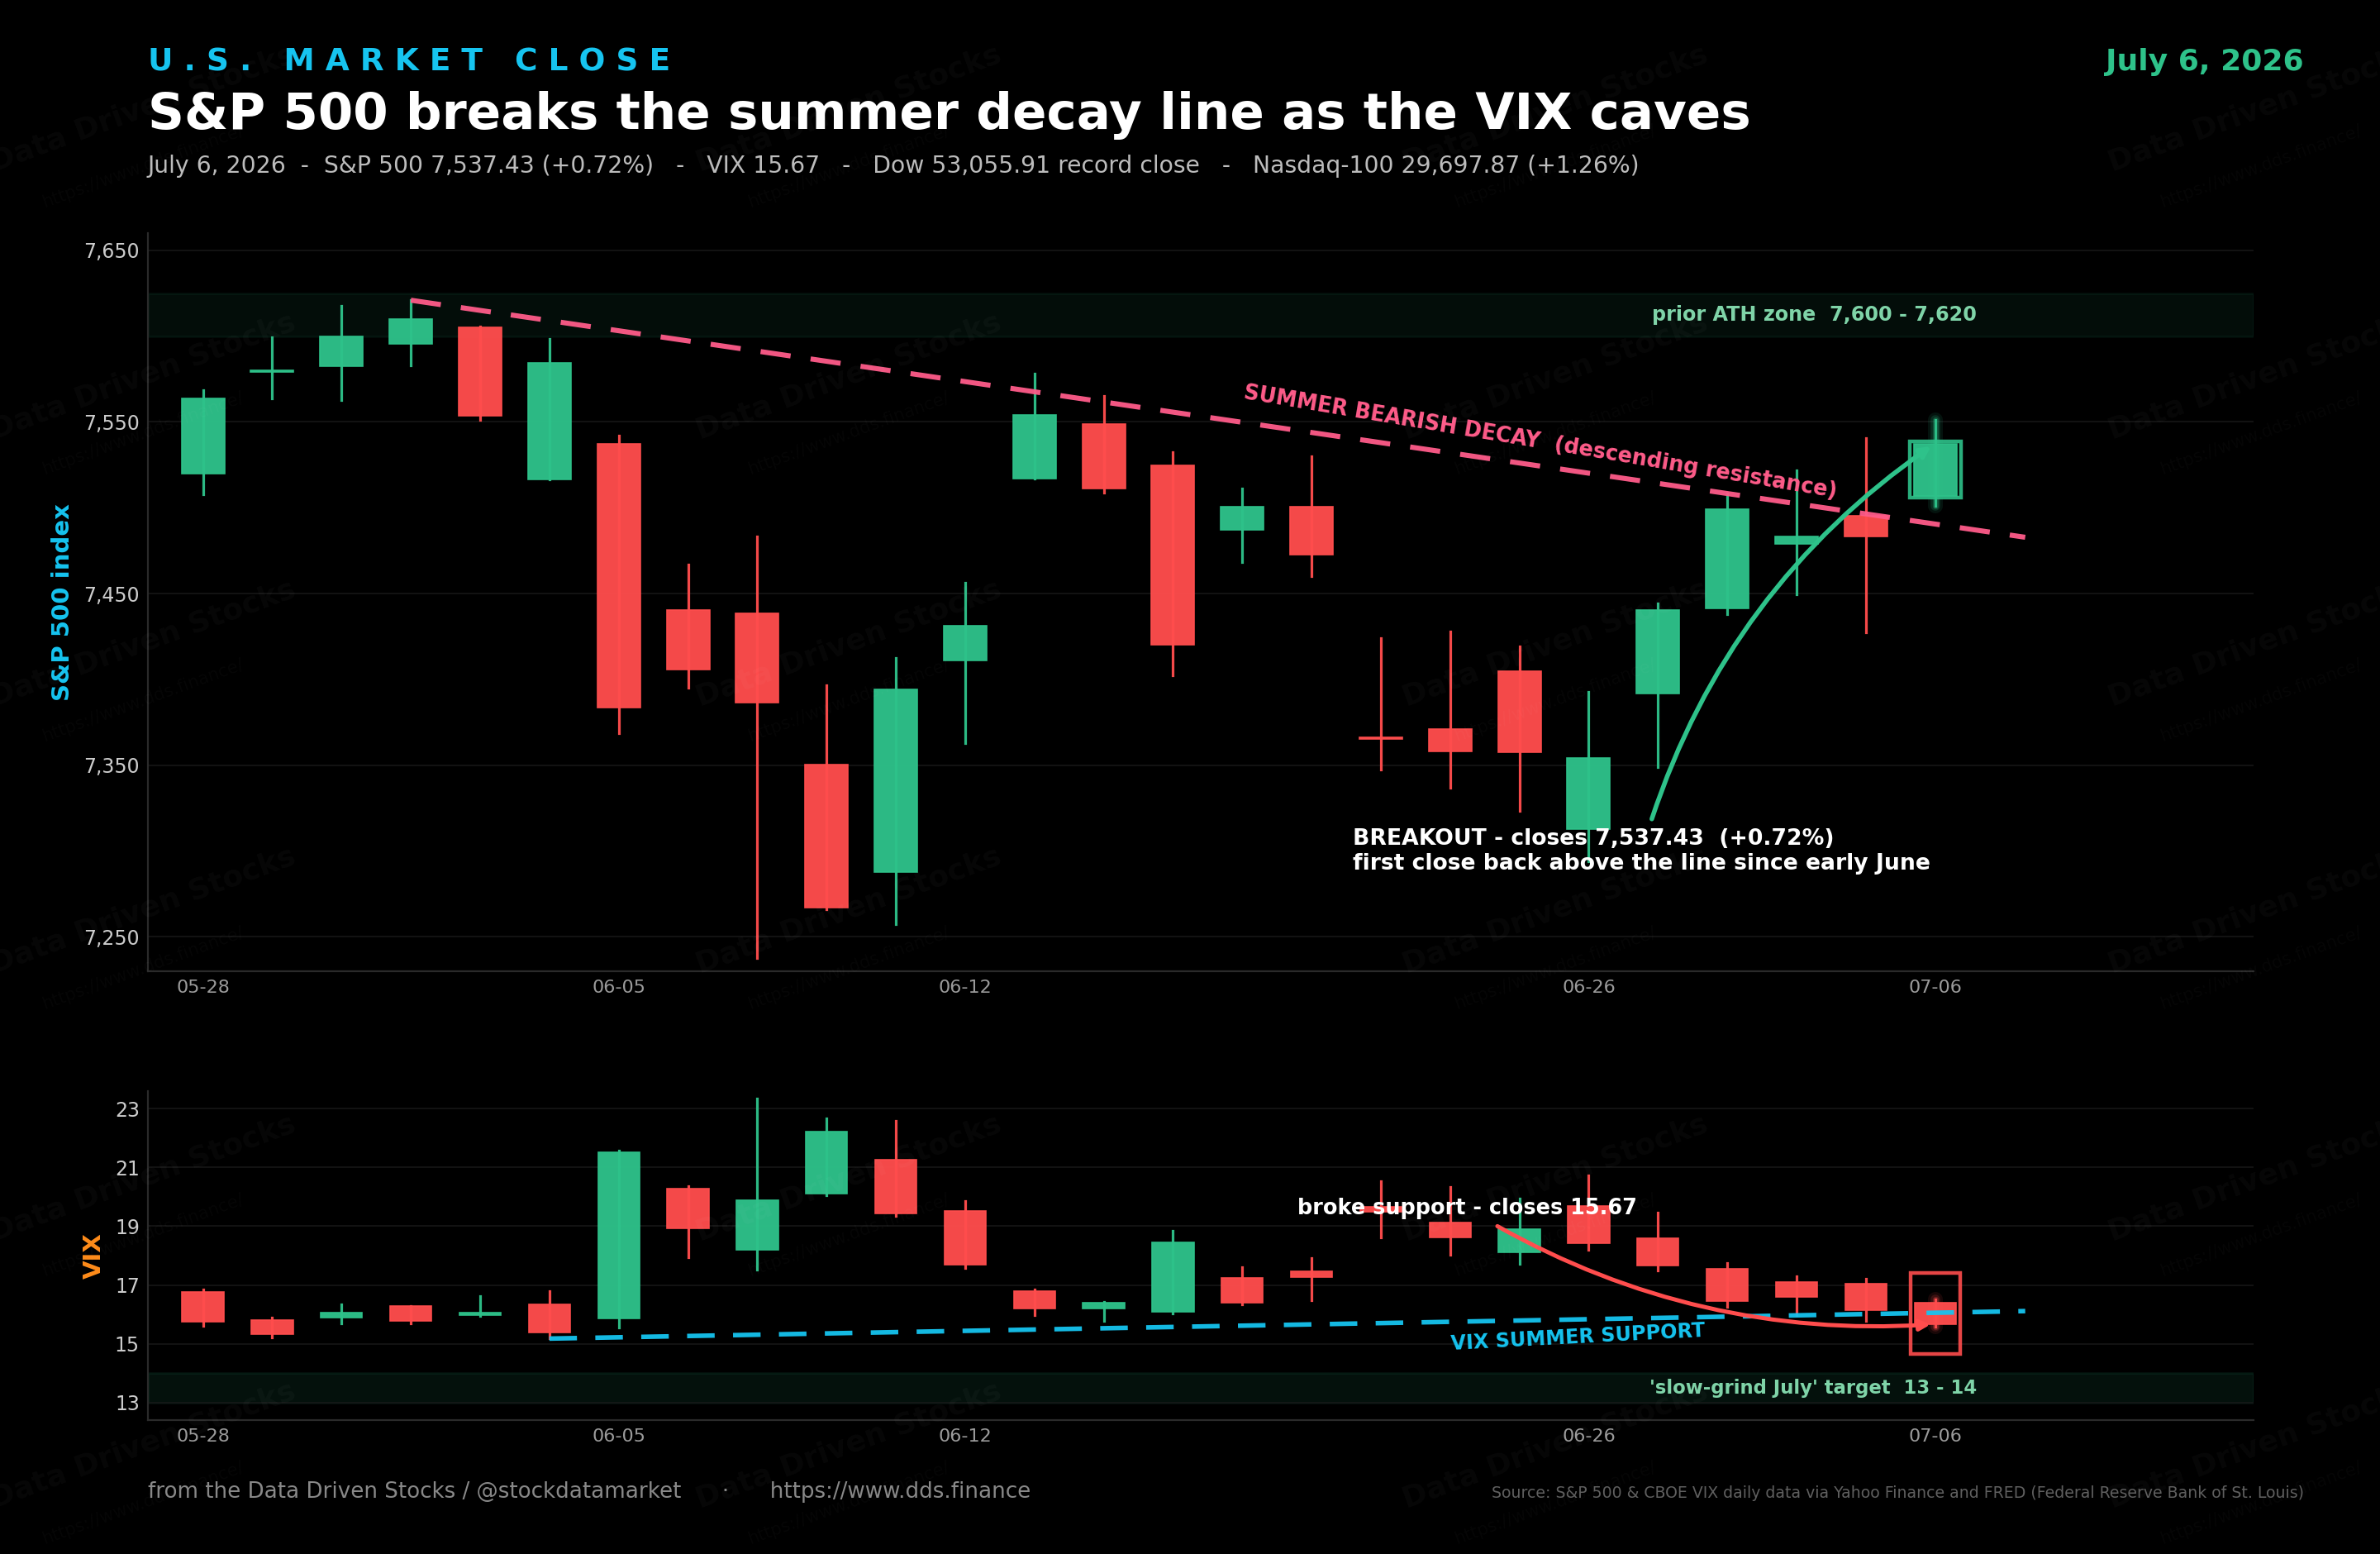
Here it is. After a month of getting rejected at the same spot, the market finally closed above the line.
The S&P 500 finished at 7,537.43, up 54 points, or 0.72% on the day. The Dow ran to a fresh record and closed above 53,000 for the first time. The Nasdaq-100 did the heavy lifting, up 1.26%, and even the small caps joined in, with the Russell 2000 back over 3,000. The part that ties it together is the VIX. It dropped to 15.67, its softest close in weeks. Green everywhere, and for once it happened with the fear gauge falling instead of spiking.
The S&P finally cleared the line
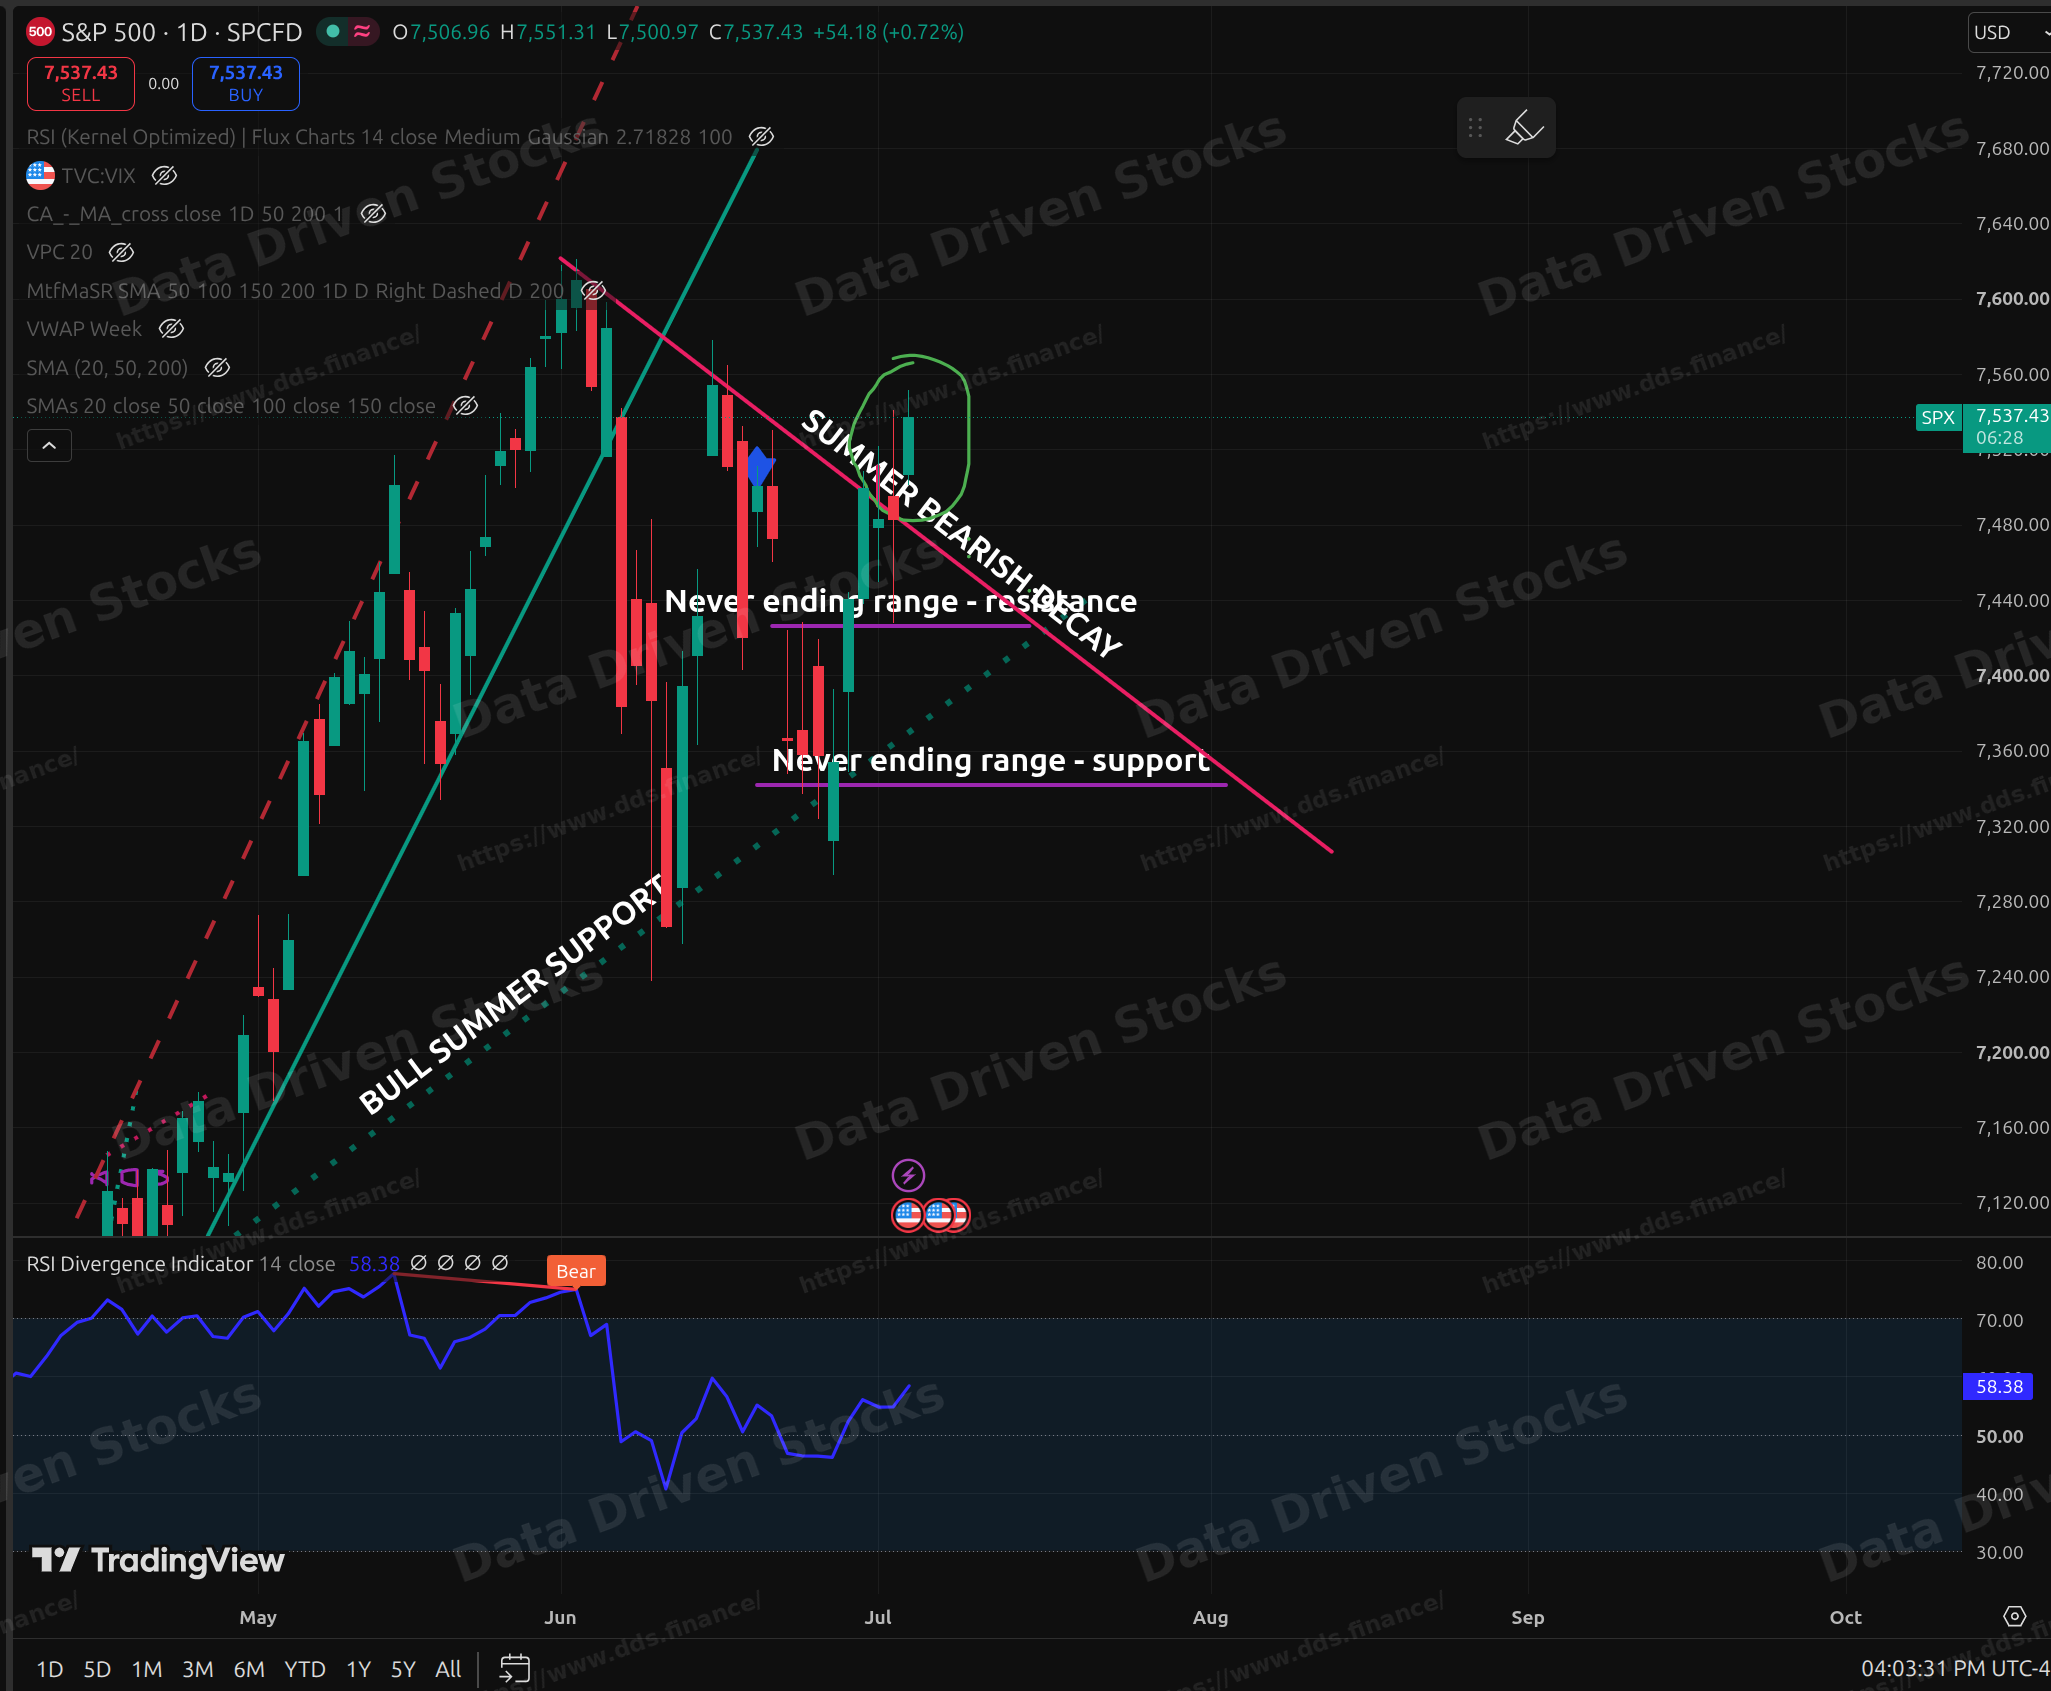
For most of June the S&P kept running into the same downward-sloping ceiling. That is the “summer bearish decay” line, drawn off the early-June top near 7,620. Every push higher hit it and rolled over. Thursday was a good example. Price poked up to 7,540 intraday, then gave it all back and closed at 7,483, right back under the line.
Today was different. The S&P closed at 7,537, and this time it closed above the line, not just tapped it. It is the first close back above that resistance since early June. That is what makes it worth paying attention to.
Now the honest part. One close above a line is a start, not a done deal. Price may well dip tomorrow, and that is fine. What matters is that it holds above the line on a closing basis. As long as it does, this is a bullish setup pointing back toward the old highs, and the old high sits at 7,620.90 from June 2, a little over a percent above where we closed. If it slips back under and closes there, the breakout was a fake and the range is still in charge.
One thing to keep in mind on any of these levels. Price mostly travels between them, not through them in a straight line. When it reaches one, that is usually a sensible spot for a day trader, or anyone holding options near expiration, to take something off rather than press.
Tech led, but the Nasdaq-100 has not confirmed
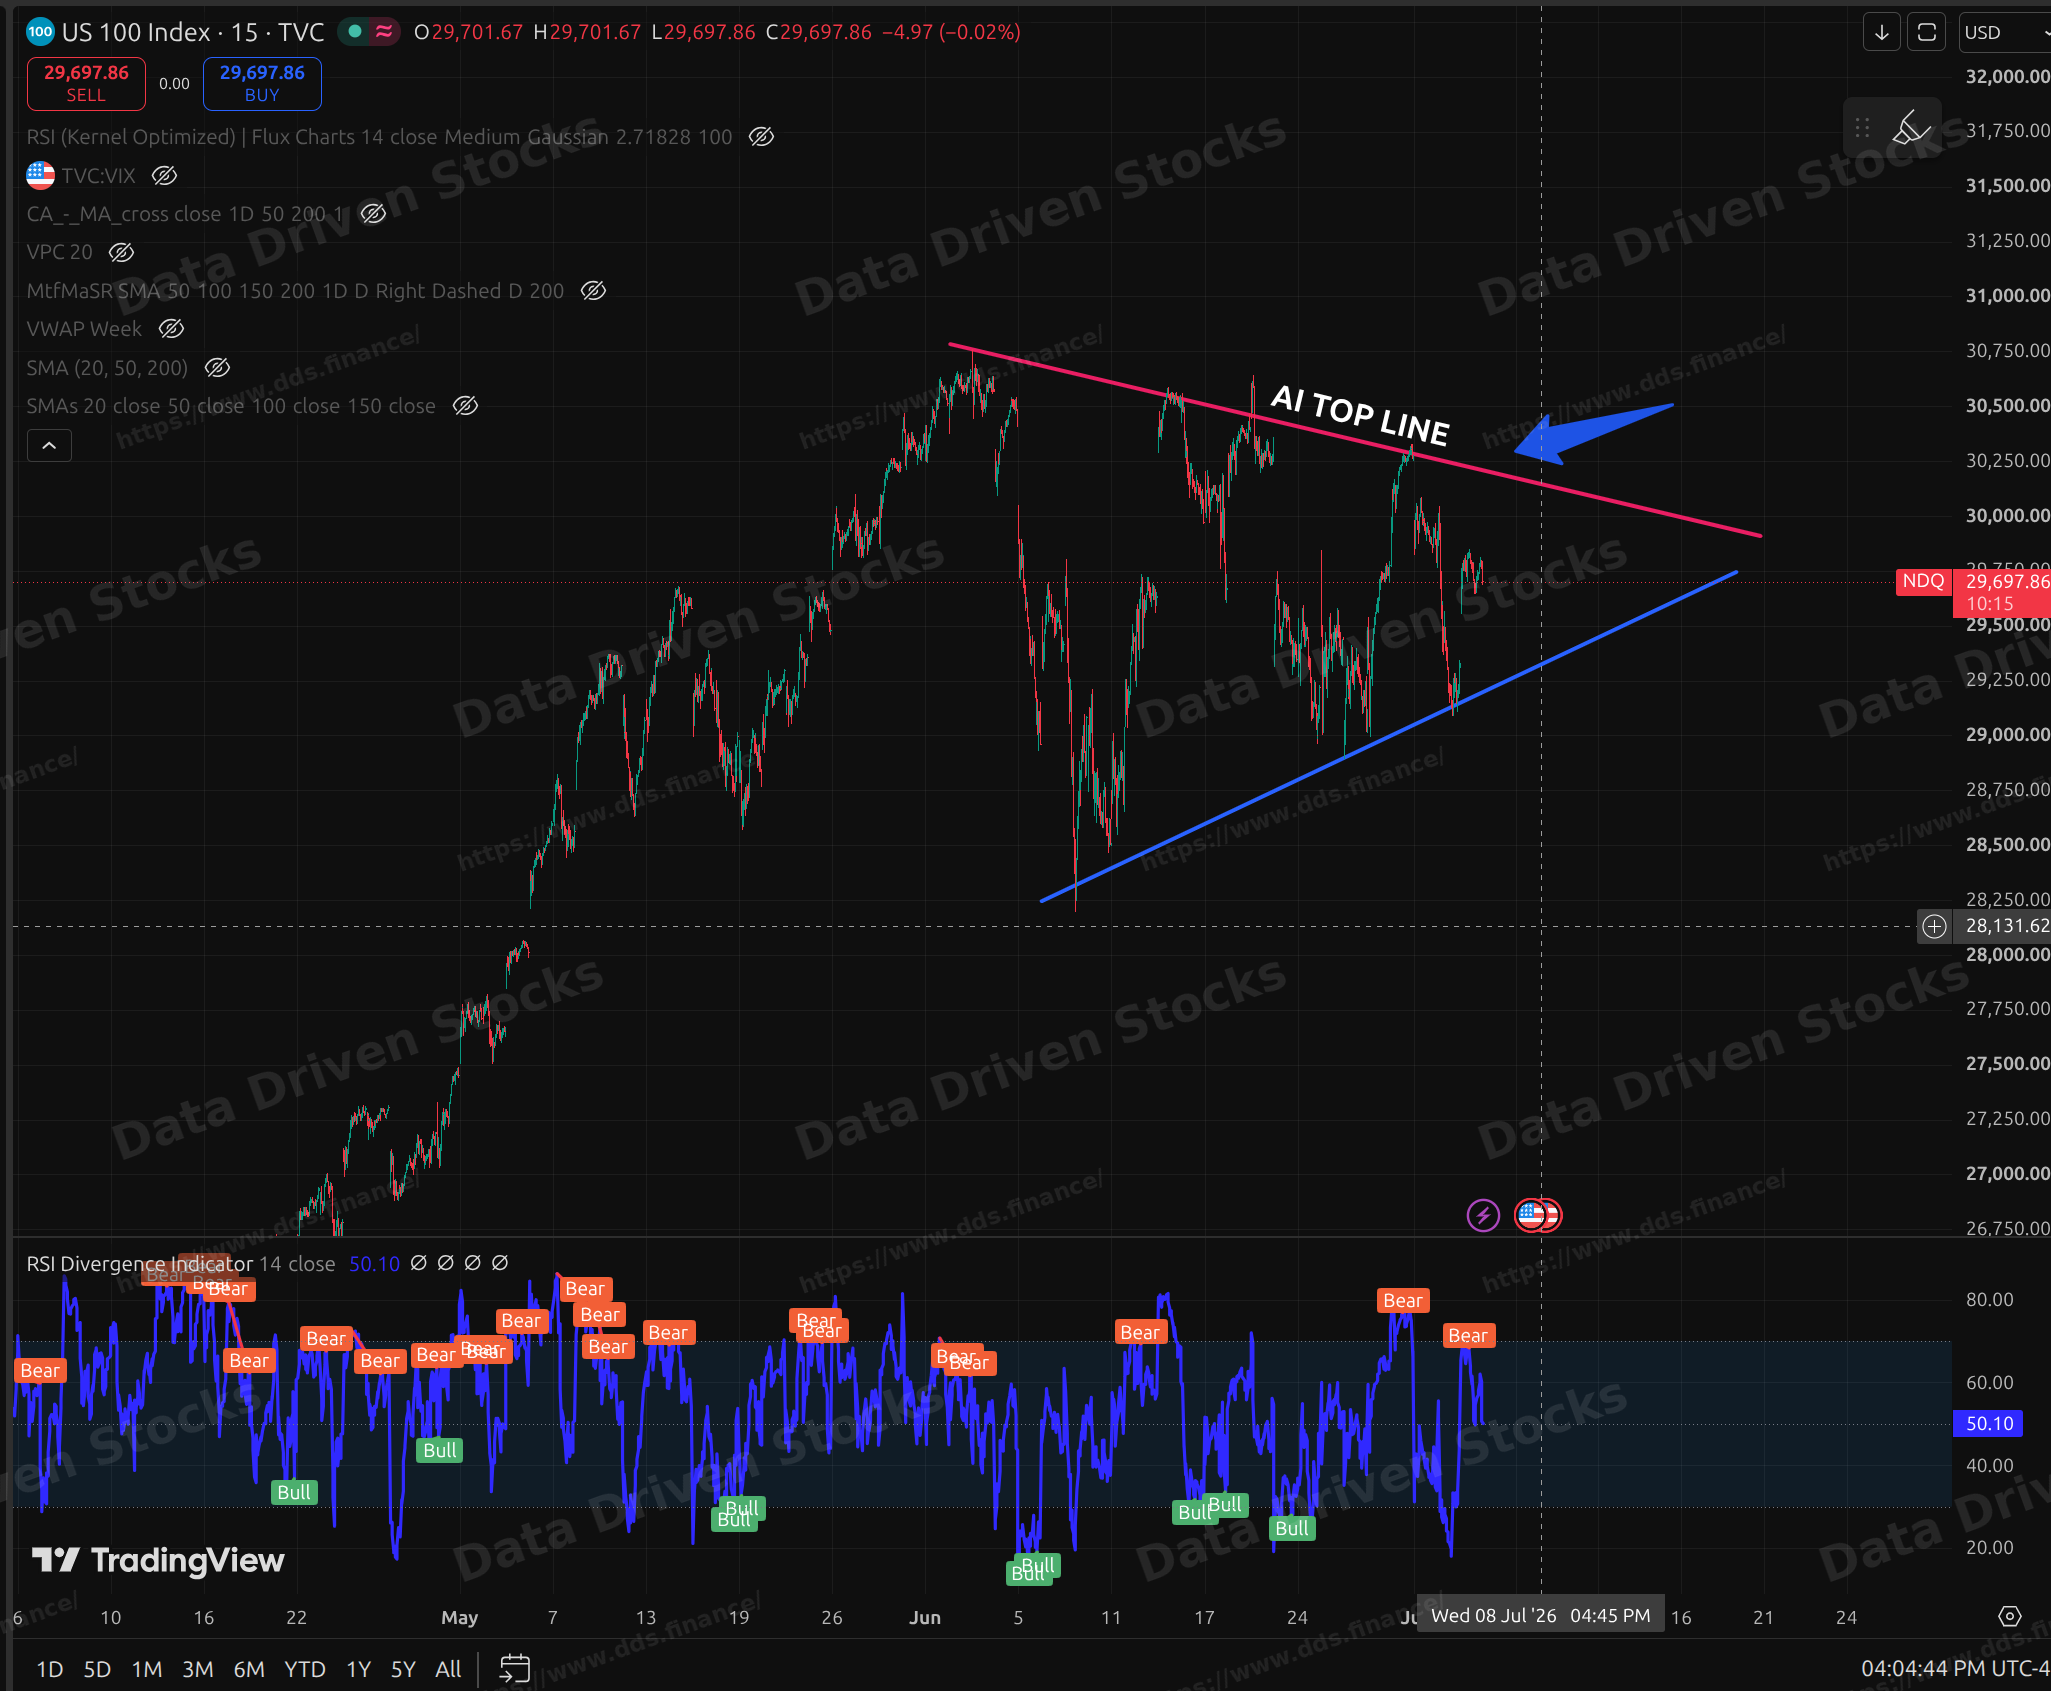
The Nasdaq-100 was the strongest of the majors today, up 1.26%, as chip names and big tech bounced hard. A lot of that was renewed optimism on the AI trade. Strong quarterly sales from Foxconn over the weekend pointed to steady demand for AI hardware, and the semiconductor names that got knocked around late in June shook it off.
Here is the catch. As good as the day looked, the Nasdaq-100 has not actually broken out yet. It is still coiling inside a tightening triangle, pressed right up against its own downward-sloping ceiling, the one I have been calling the “AI top line.” Until it closes above that line, this is a question mark, not a green light. Clear it, and the conversation quickly turns to a run back at the tech highs and a possible new record. For now it is squeezed against resistance with the decision still ahead of it.
NVIDIA is the swing factor
NVIDIA closed at 195.55, up about 0.4%. It is sitting inside a falling wedge, which is the kind of pattern that usually resolves to the upside, and it looks close to breaking out of it. If it goes, it tends to pull the whole tape along with it, simply because so much of the index weight and so much of the AI story runs through this one name.
The caveat matters, and it is worth saying plainly. NVIDIA likes to go quiet. It often chops sideways in a range and does very little until roughly two weeks before it reports, and only then does it really move. Earnings are still weeks out. So even if the wedge breaks, do not be surprised if it grinds more than it rips between now and the report. A clean break here would be a tailwind for everything else. A continued range just means the rest of the market has to carry the load on its own.
