

US Inflation Just Posted Its Biggest Monthly Drop Since 2020. Don’t Get Used To It.
June CPI fell 0.4% as the ceasefire crushed oil. The truce is already dead, gas is back near $4, and the Apple price wave hasn’t even reached the index yet.

US consumer prices fell 0.4% in June. Fell. In a year where every inflation print since March came in hot, the tape finally broke the other way, and it broke hard.
The last time a US CPI print dropped this much in a single month was April 2020, when the world was locked in its apartment and oil futures briefly traded below zero. That is the company June 2026 now keeps.
Before you read - open this article in the app, because it’s going to be truncated. If you like it - reshare and comment!
So this piece does two jobs. First, it takes the print apart: what actually fell, how rare a month like this is, and whether the numbers can still change under your feet. Second, it follows the money into the places most coverage skipped: the Strategic Petroleum Reserve sitting at a 43-year low, and the 20% Apple price hikes that are somehow invisible in the official data. Then we update our projections to the end of 2027, on the same framework we used last month.
The print
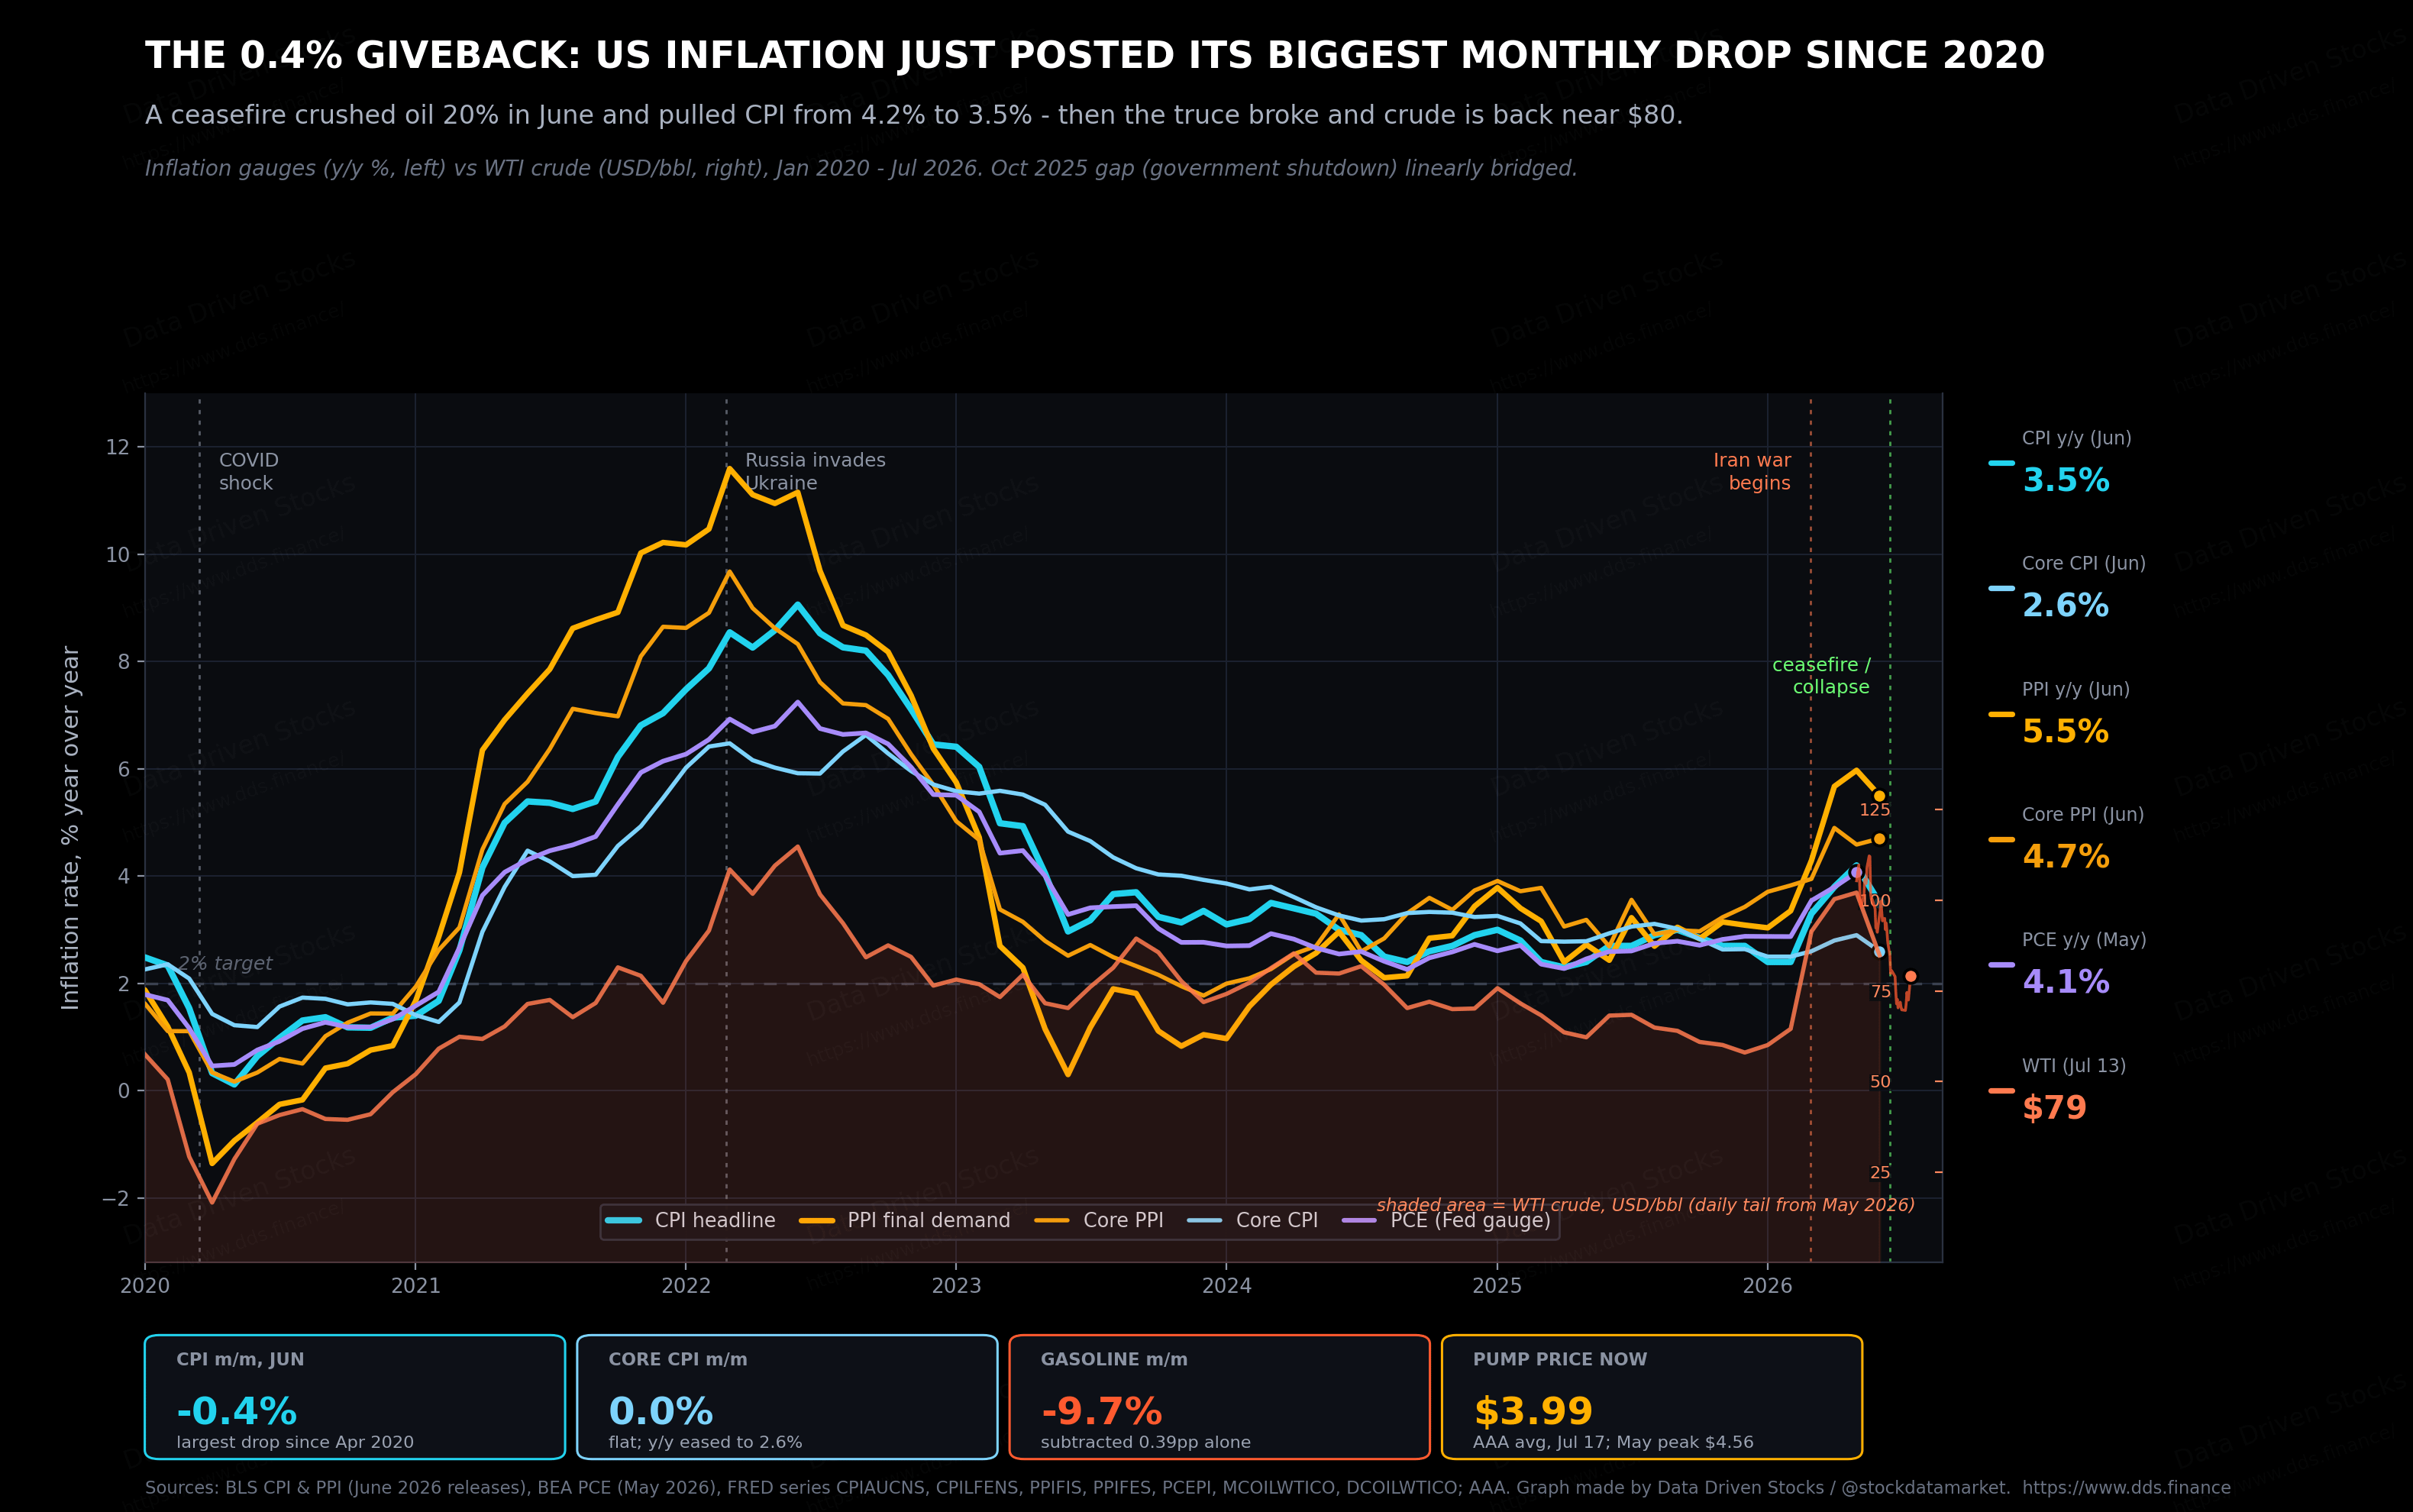
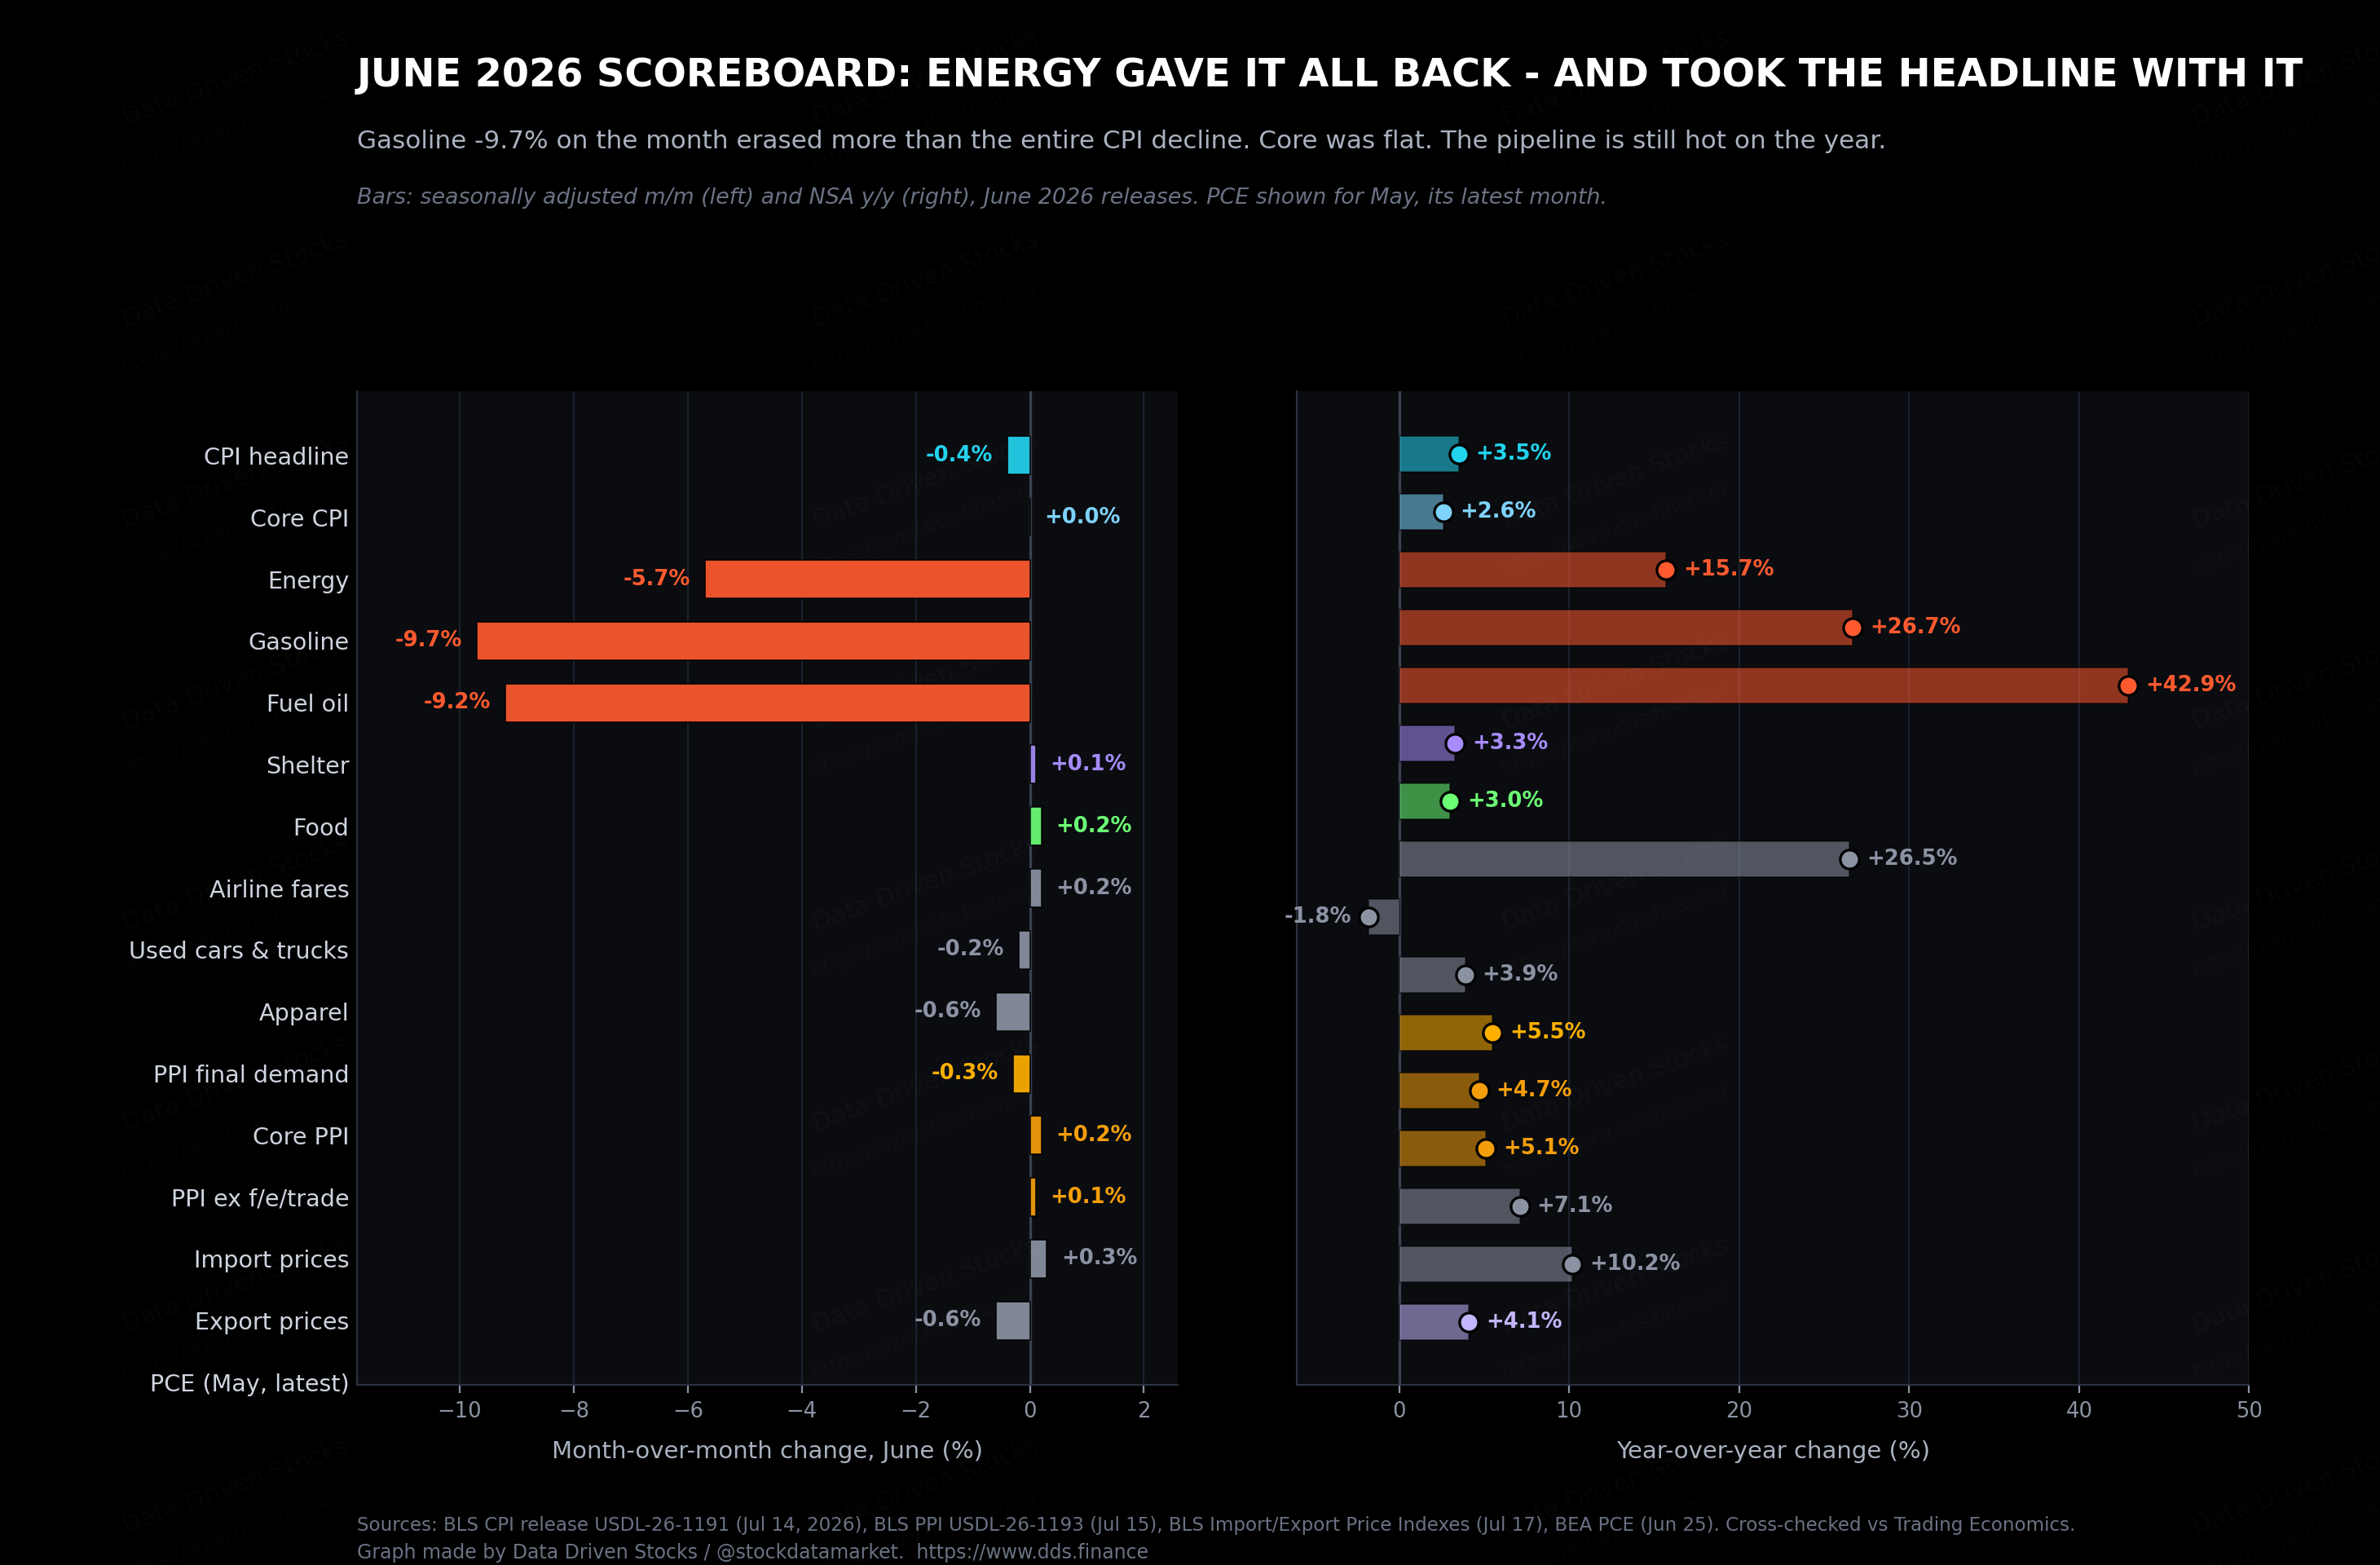
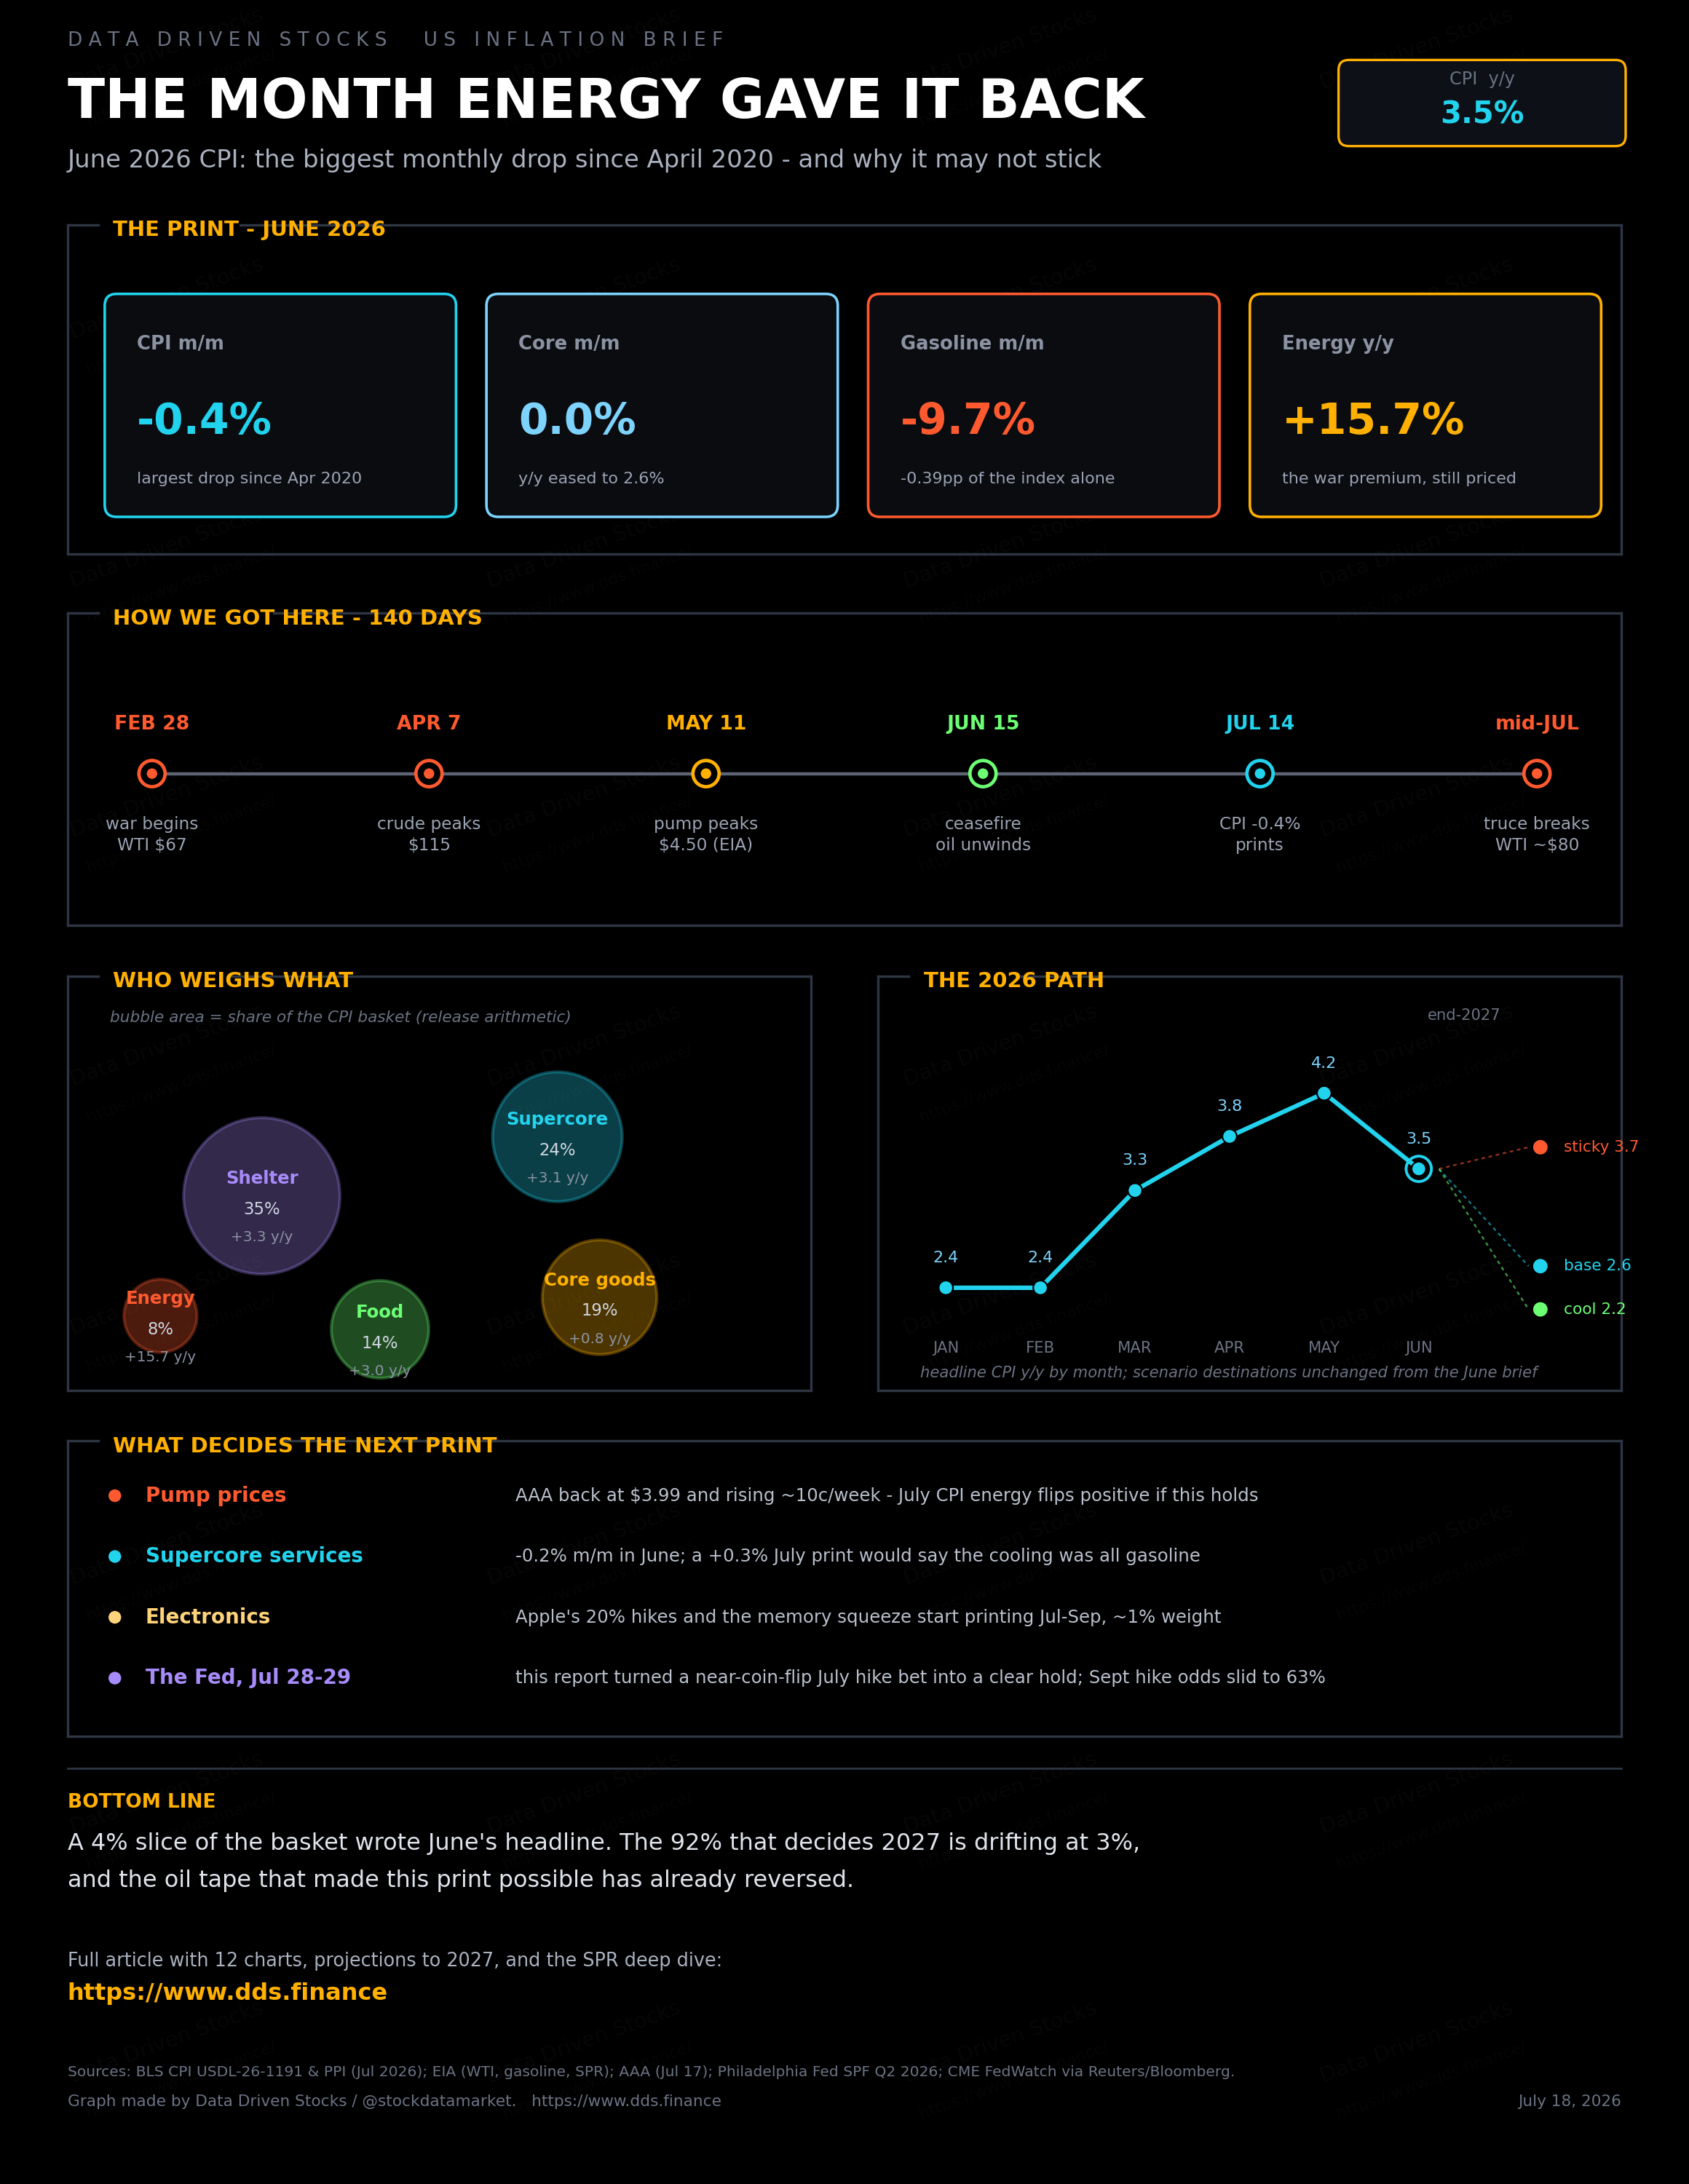
Headline CPI fell 0.4% in June, seasonally adjusted. The street expected something around -0.1% to -0.2%. The annual rate dropped from 4.2% in May to 3.5%, against a consensus near 3.8%. A miss of that size on the soft side is rare, and markets treated it that way.
Core CPI, which strips out food and energy, came in flat on the month, under the +0.2% consensus. That took the annual core rate from 2.9% to 2.6%, back to where it stood in March. Shelter rose just 0.1%, the smallest monthly gain since January 2021. Services excluding shelter, the “supercore” gauge the Fed stares at, actually declined about 0.2% on the month.
The producer side told a matching story with a lag built in. PPI final demand fell 0.3% in June, but the annual rate still sits at 5.5%, and core PPI at 4.7%. Import prices rose 0.3% on the month and are up 7.1% on the year. The pipeline behind consumer prices is cooler than in spring, and still much warmer than the shelf.
The arithmetic of one bar
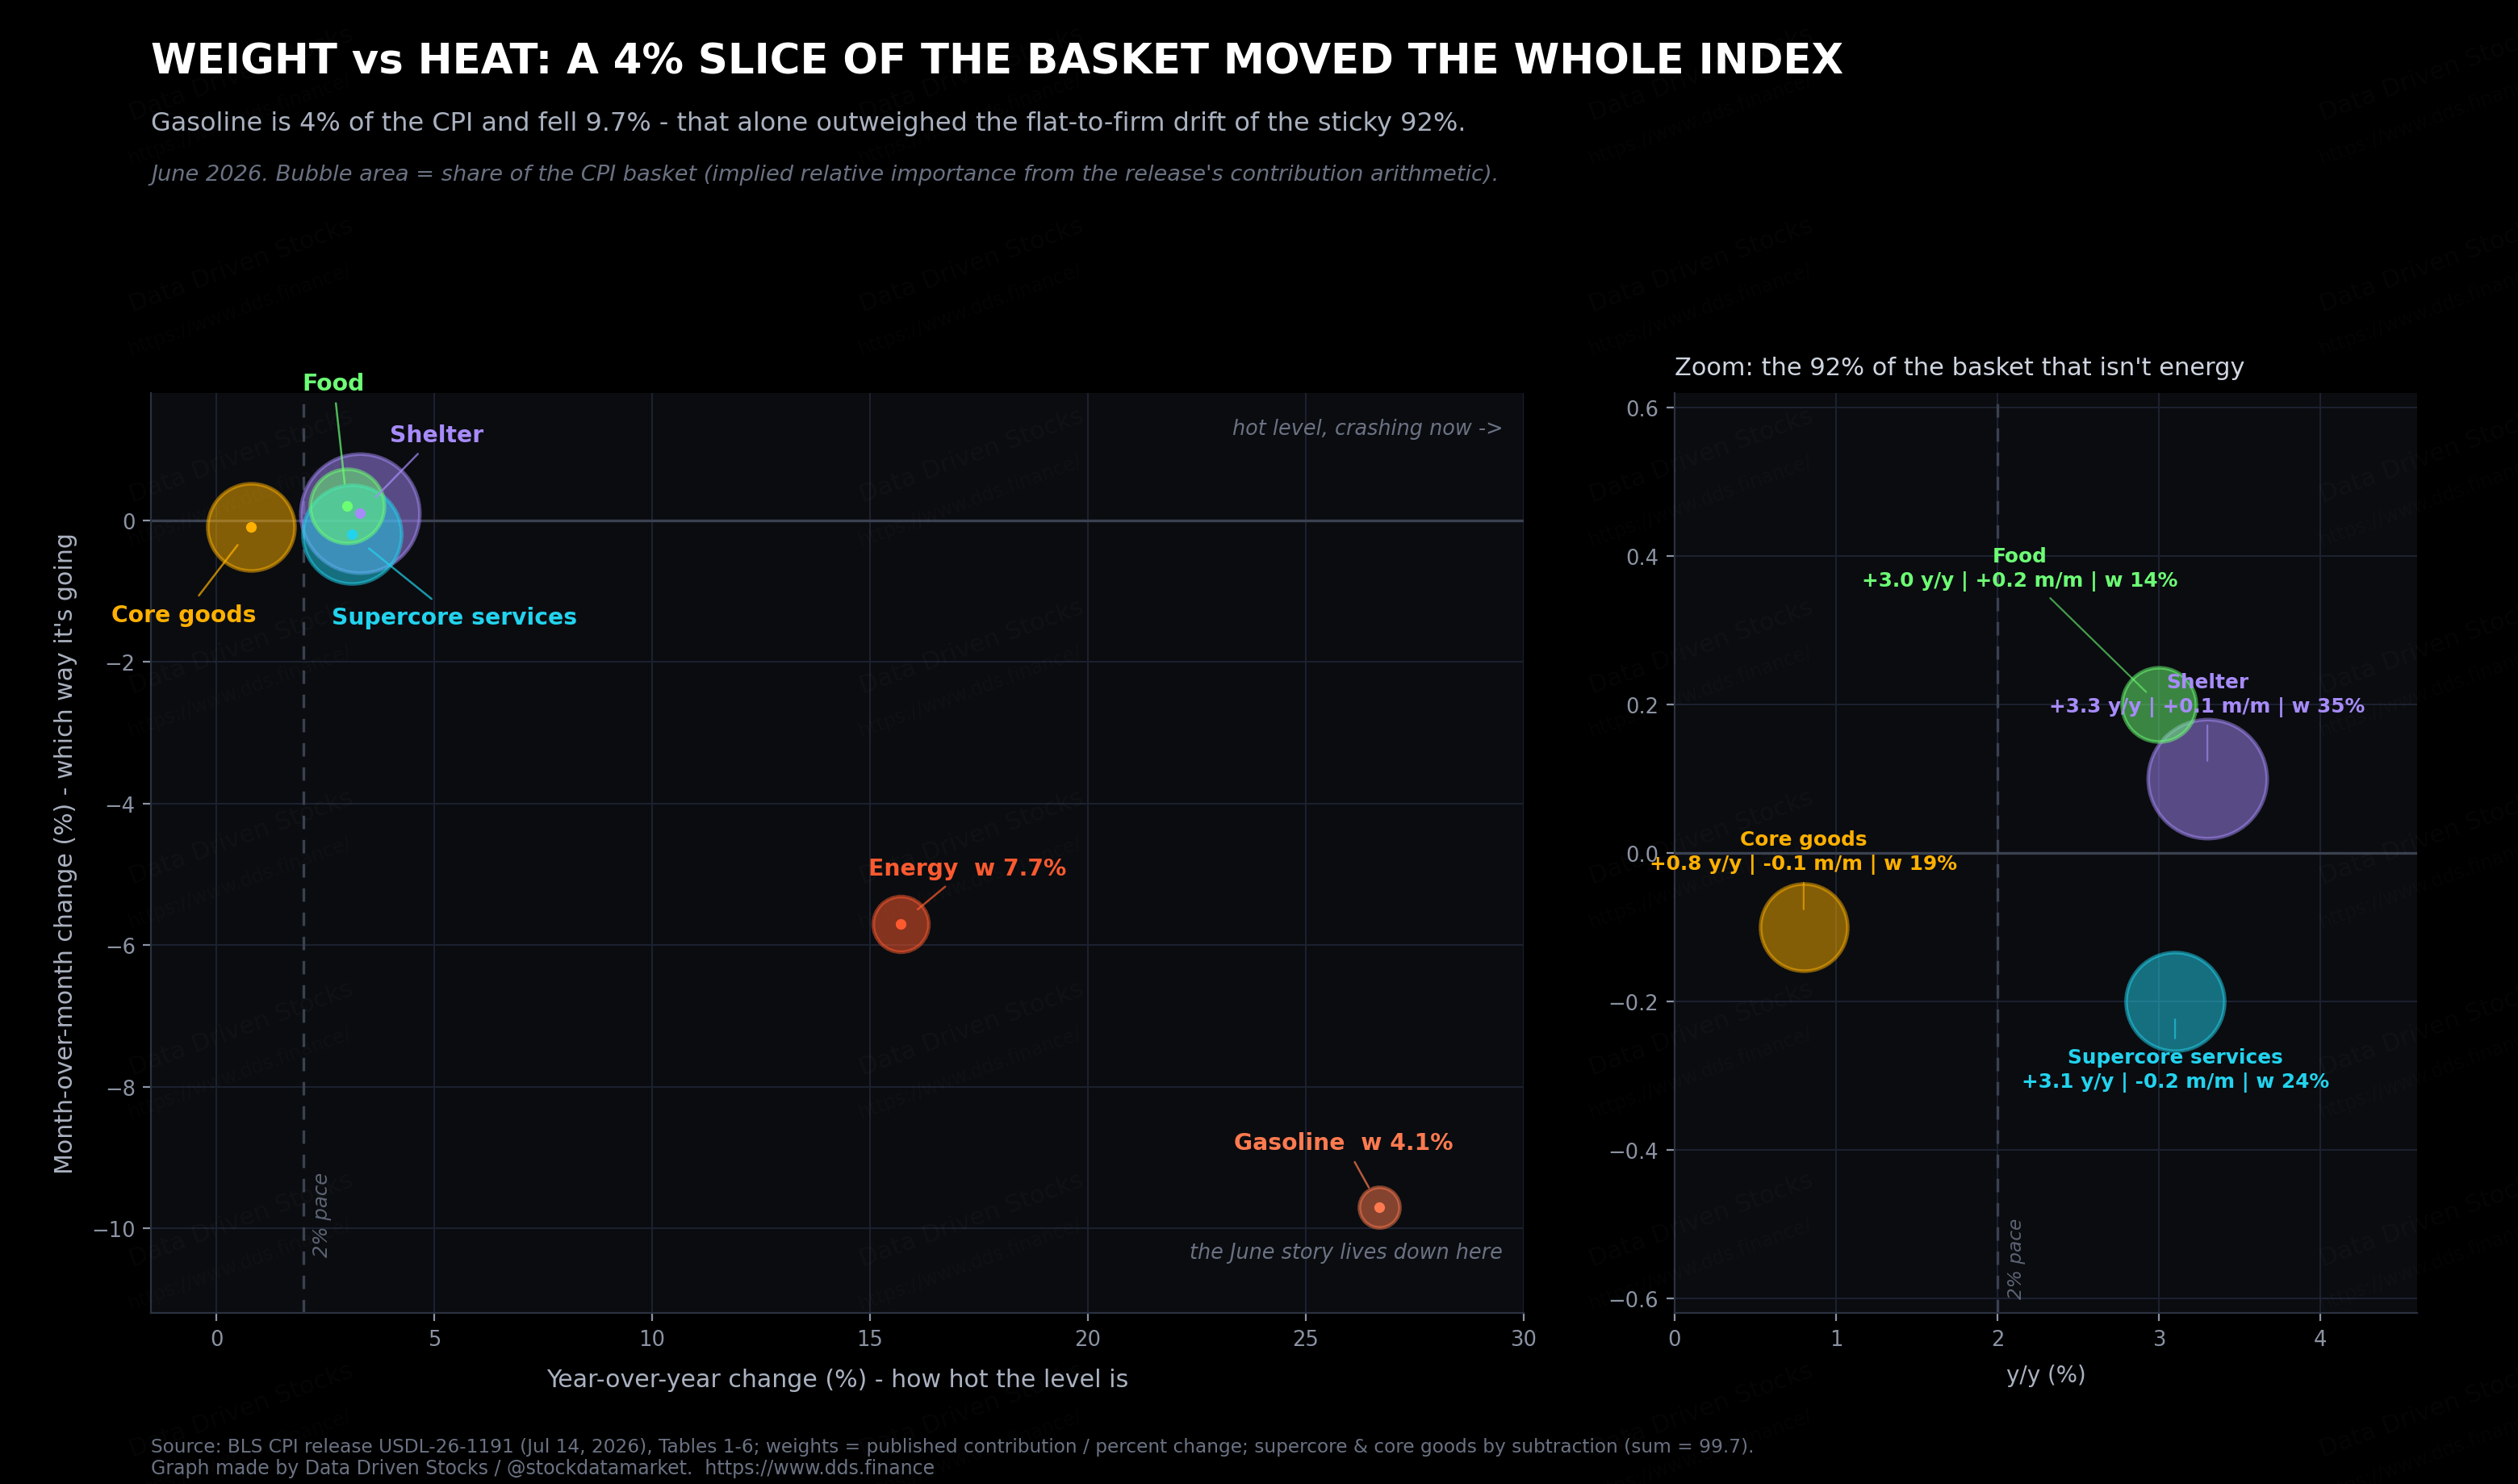
Here is the part that should temper the celebration. Gasoline carries roughly a 4% weight in the CPI basket. It fell 9.7% in June. Multiply those and you get about 0.39 percentage points shaved off the headline index, from one line item. The entire headline decline was 0.4 points.
In other words, gasoline alone explains just about all of it. Add electricity, fuel oil and the rest, and energy as a group subtracted around 0.44 points. Even after that giveback, energy is still up 15.7% on the year, so the war premium has left the monthly numbers without leaving the annual ones. Which means the other 92% of the basket, the food, the rent, the haircuts, the insurance, netted out to roughly zero. Slightly positive, if you squint.
That counts for something. A flat month for the sticky 92% is a real improvement over the spring, when tariff pass-through and services were both pushing. But it is a very different sentence from “inflation fell 0.4%,” and the difference matters for everything that follows in this article.
How rare is a month like this
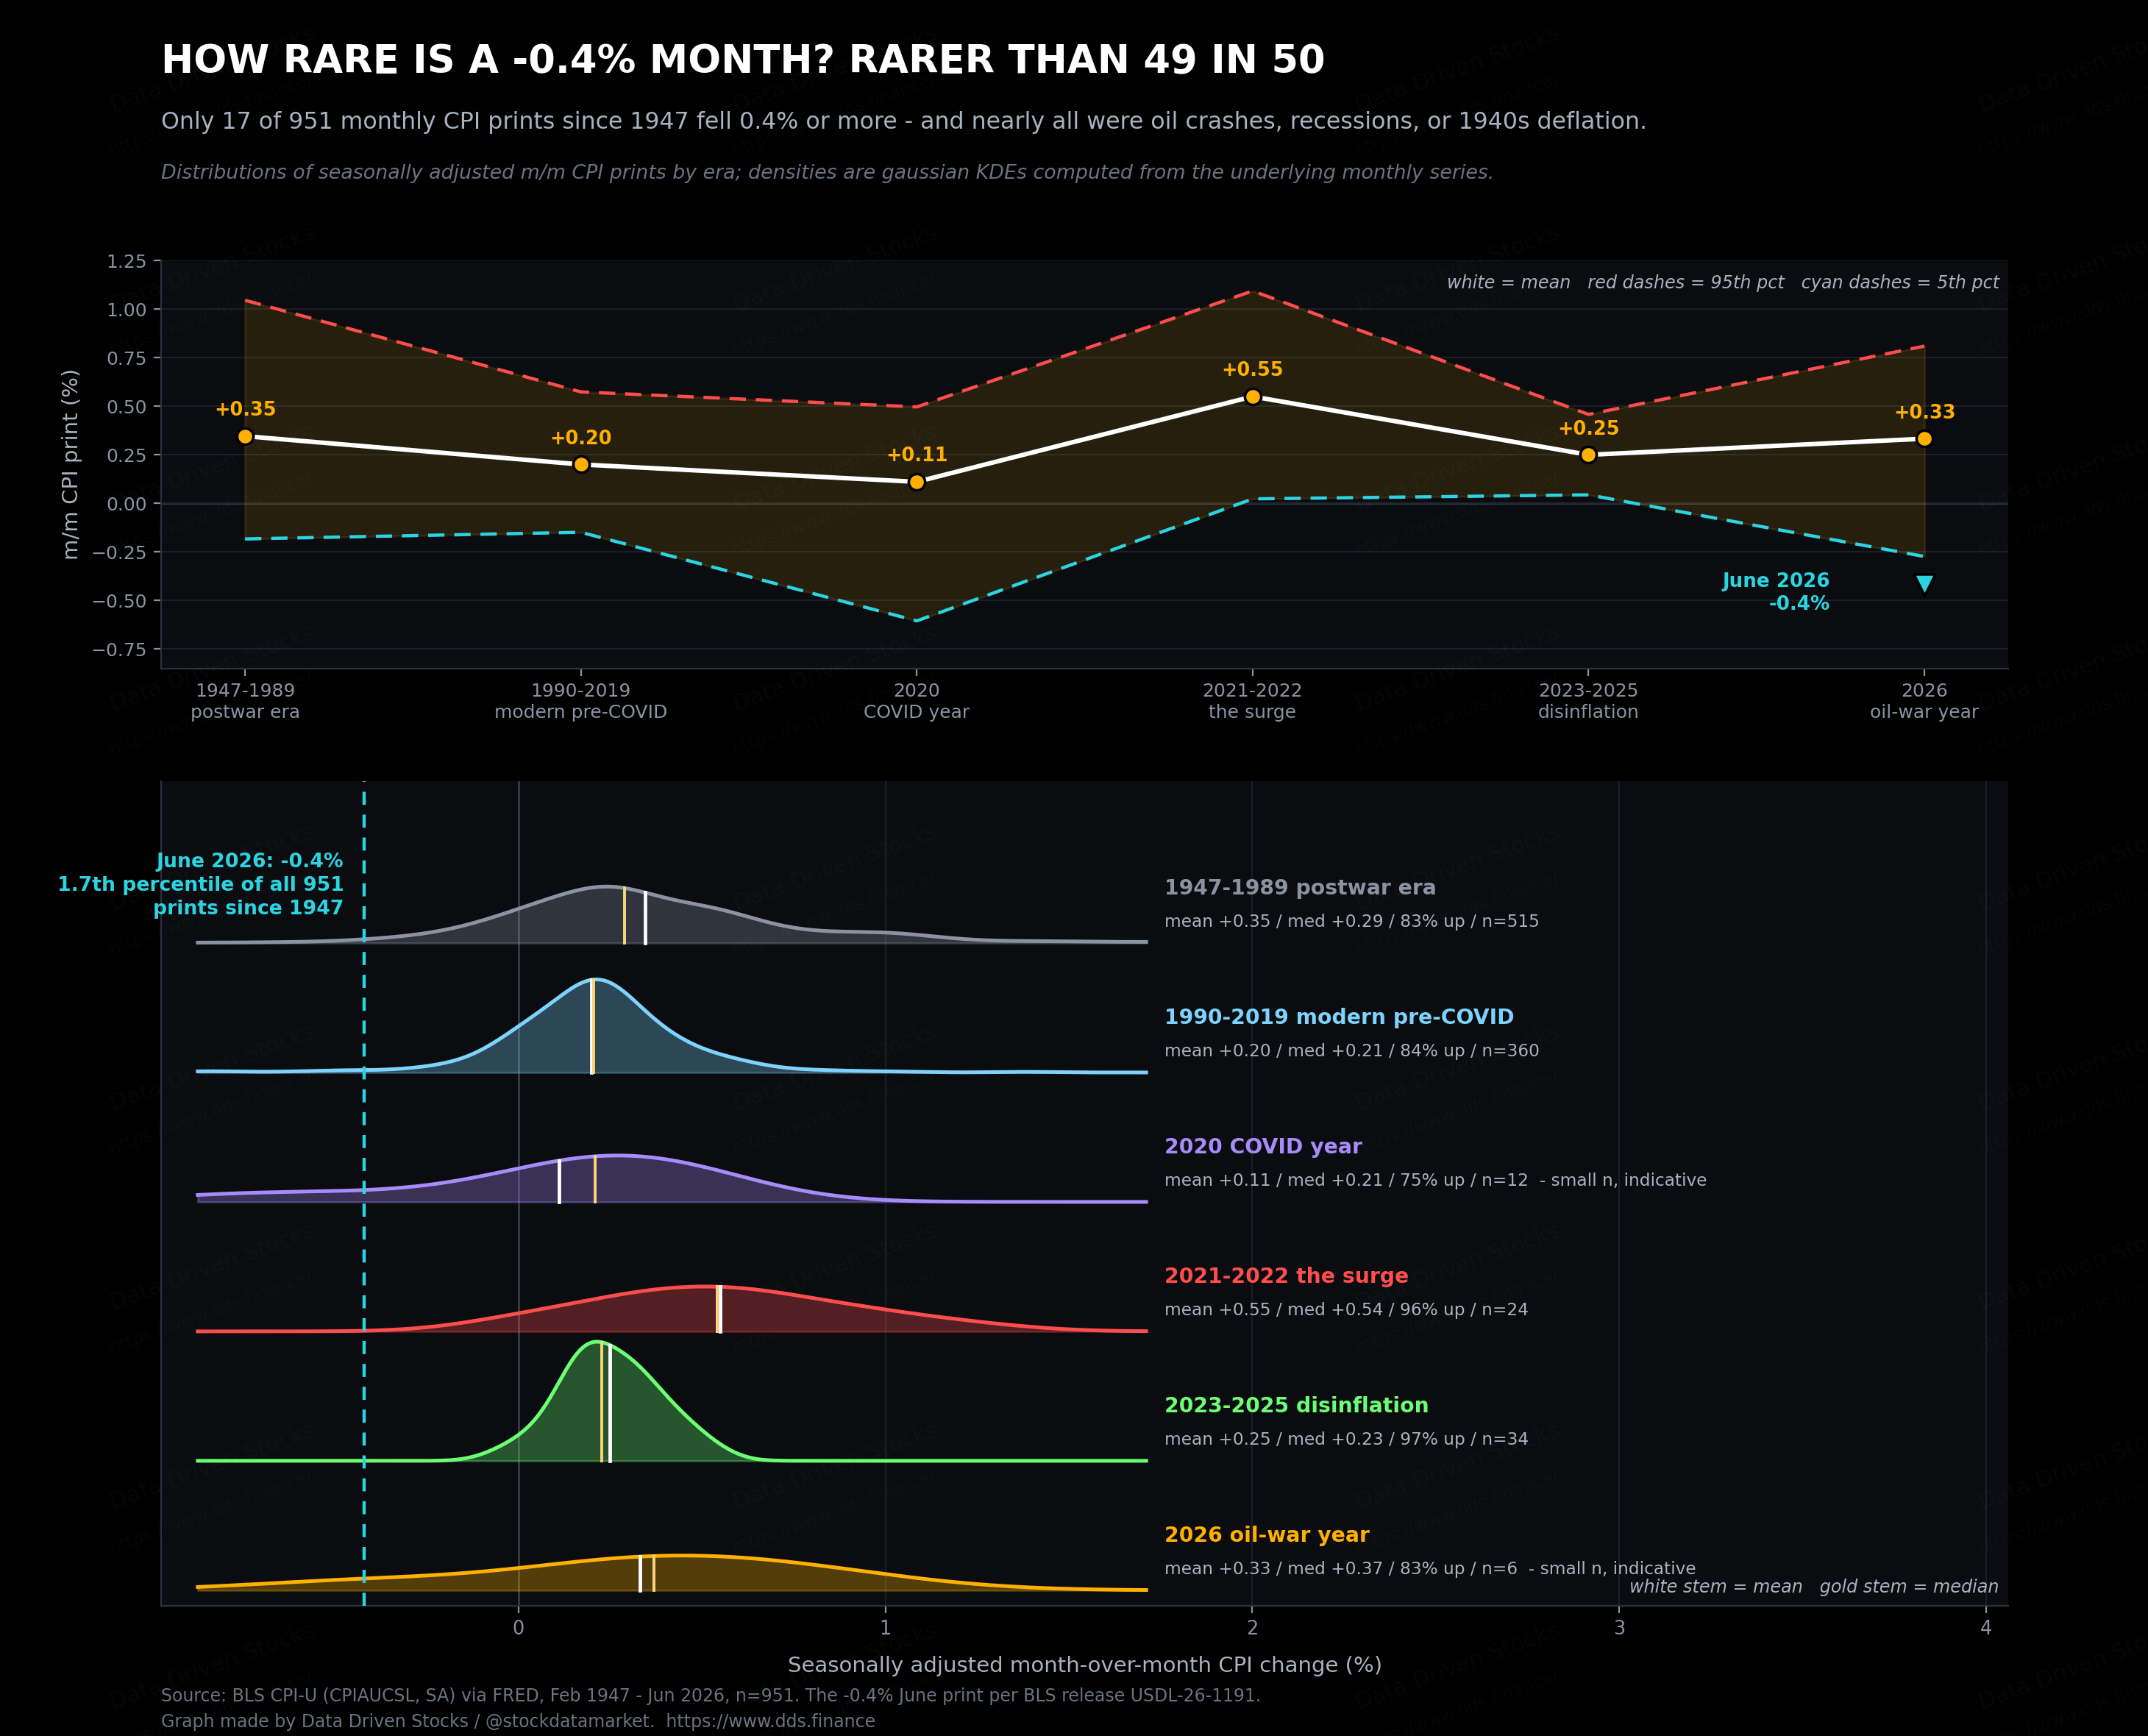
Rarer than most people assume. We went back through every monthly CPI print since 1947. That is 951 months. Only 17 of them fell 0.4% or more. June 2026 lands at roughly the 1.7th percentile of the entire post-war record.
The list of those 17 months reads like a disaster calendar. Six came from the 1948-1950 postwar deflation. One from the 1986 oil price collapse. Three from the energy swings of 2005 and 2006 after Katrina. Three from the depths of the 2008 financial crisis, including the all-time record of -1.8% in November 2008. One from the January 2015 oil crash. Two from the COVID shutdowns of March and April 2020. And now June 2026.
Notice the pattern. Every single modern instance is either a crashing oil price or an economy falling into a hole. There is no example in 79 years of a month like this produced by calm, broad, healthy disinflation. Months like June are what shocks unwinding look like.
Can these numbers still change
Short answer: the 3.5% is close to locked, the -0.4% is not quite.
The BLS publishes CPI in two flavors. The not seasonally adjusted index, which drives the annual rate, is effectively final at publication. It only changes for outright errors, which is rare. So barring something extraordinary, 3.5% year over year is what history will record for June 2026.
The seasonally adjusted monthly figure is softer. Every February, the BLS re-estimates seasonal factors for the previous five years, and monthly prints move. The precedent people in this business remember is December 2022, which was first reported at -0.1% and later revised to +0.1%, a 0.2-point swing that flipped the sign and erased the headline. A revision of one tenth on June’s -0.4% next February would surprise nobody.
There are two extra reasons to hold the monthly figure loosely this cycle. First, the 2025 government shutdown left a hole in the data. October 2025 was never published, and collection in the surrounding months was thinner than normal, so the seasonal models are working with a damaged year. Second, revisions are already happening around this release. May’s PPI was cut from +1.1% to +0.6% in the same week, a huge move for that series, and the spring payroll figures were trimmed by a combined 74 thousand. None of that rewrites June, but it does mean the monthly figure is written in pencil.
The oil round trip
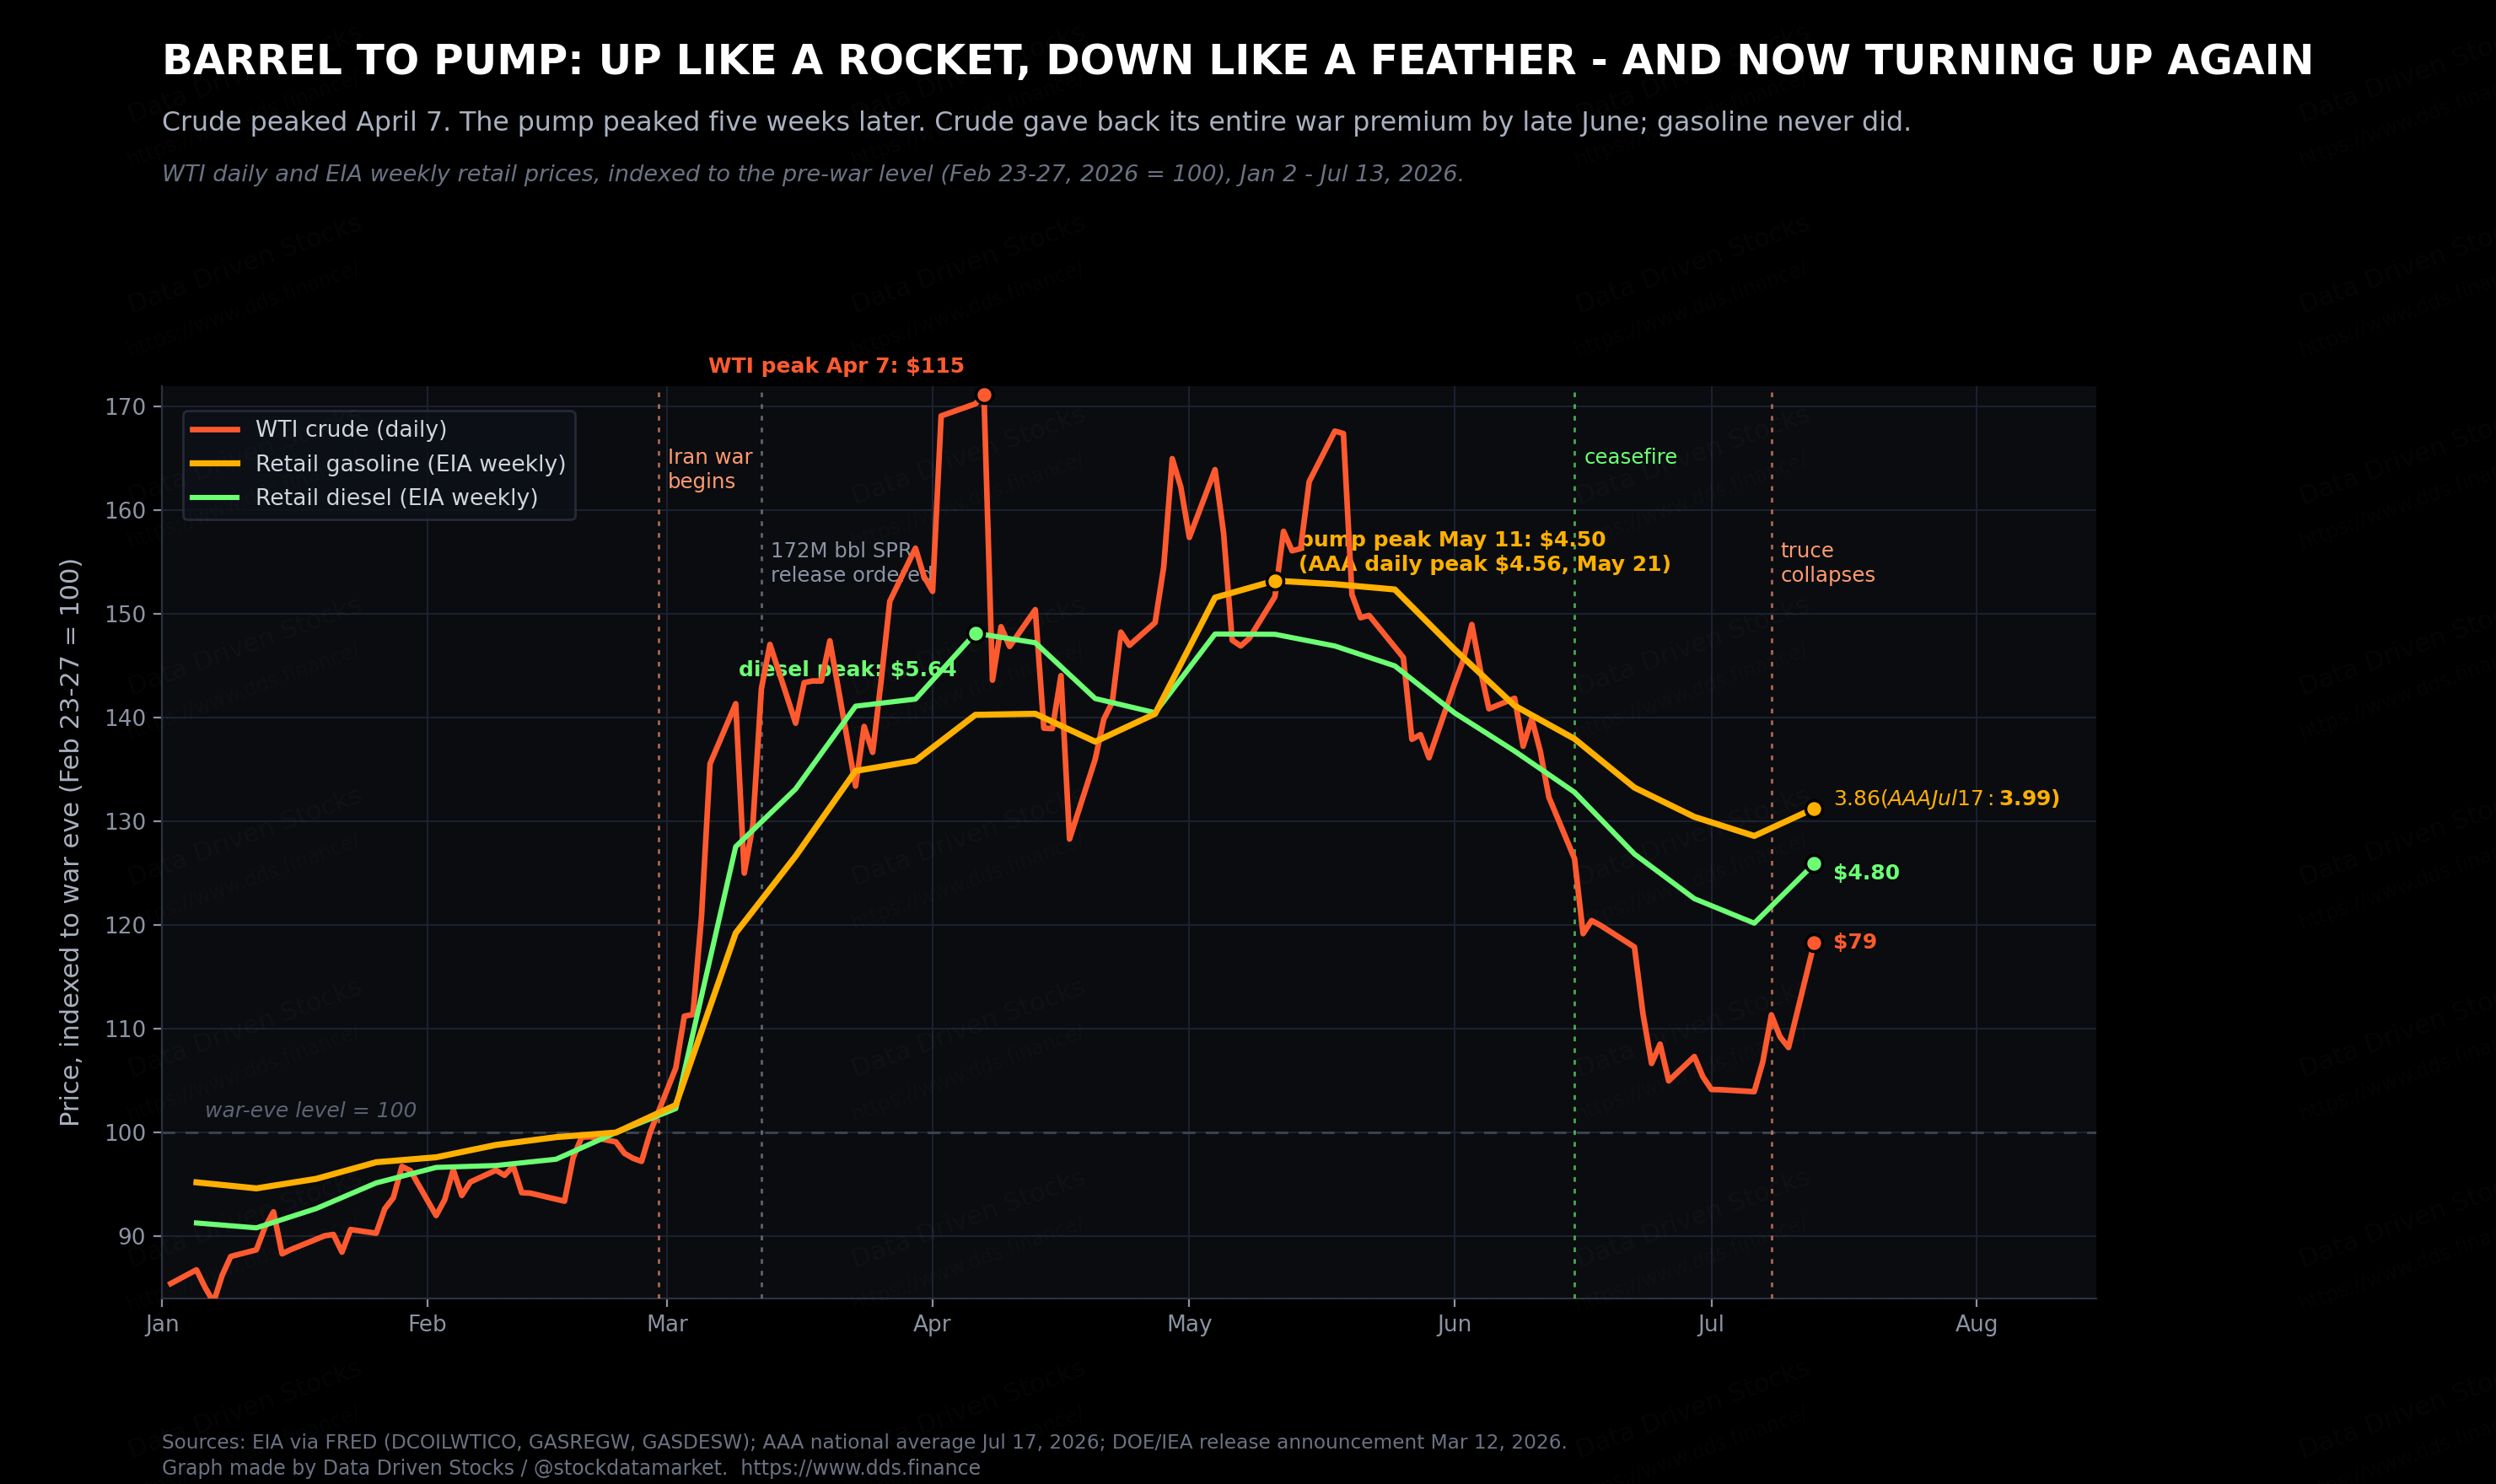
Now to the engine room. On February 27, the day before the war began, WTI crude closed at $66.96. By April 7 it hit $114.58, with Brent touching $138. The June 15 ceasefire then did what no press conference could: crude fell by roughly a fifth in June, its worst month since the pandemic era, and WTI closed at $70.56 on June 30, within four dollars of its pre-war price. A near-complete round trip in four months.
The pump never made the full trip back. Retail gasoline peaked at $4.50 in the EIA’s weekly survey on May 11, five weeks after crude topped. It bottomed at $3.78 in early July, still about 29% above its pre-war level. Refining is the reason. The war knocked out capacity and drained inventories, and gasoline stocks are now around 14 million barrels below the five-year average, the lowest for this time of year since 2012. The crack spread, the refiner’s margin between crude and fuel, sits near $59 a barrel, the widest since June 2022. When the middle of the chain is that tight, the bottom of the chain stays expensive.
And then the truce died. Tanker attacks resumed in early July in the Strait of Hormuz, the channel that carries about a fifth of the world’s oil, the blockade went back on, and WTI closed at $79.20 on July 13. Gasoline futures rose 13% in a month. AAA’s national average hit $3.99 on July 17, up ten cents in a week, and GasBuddy’s Patrick De Haan says $4 gasoline is days away. The exact force that gave June its minus sign is already running in reverse.
The emergency tank is running low
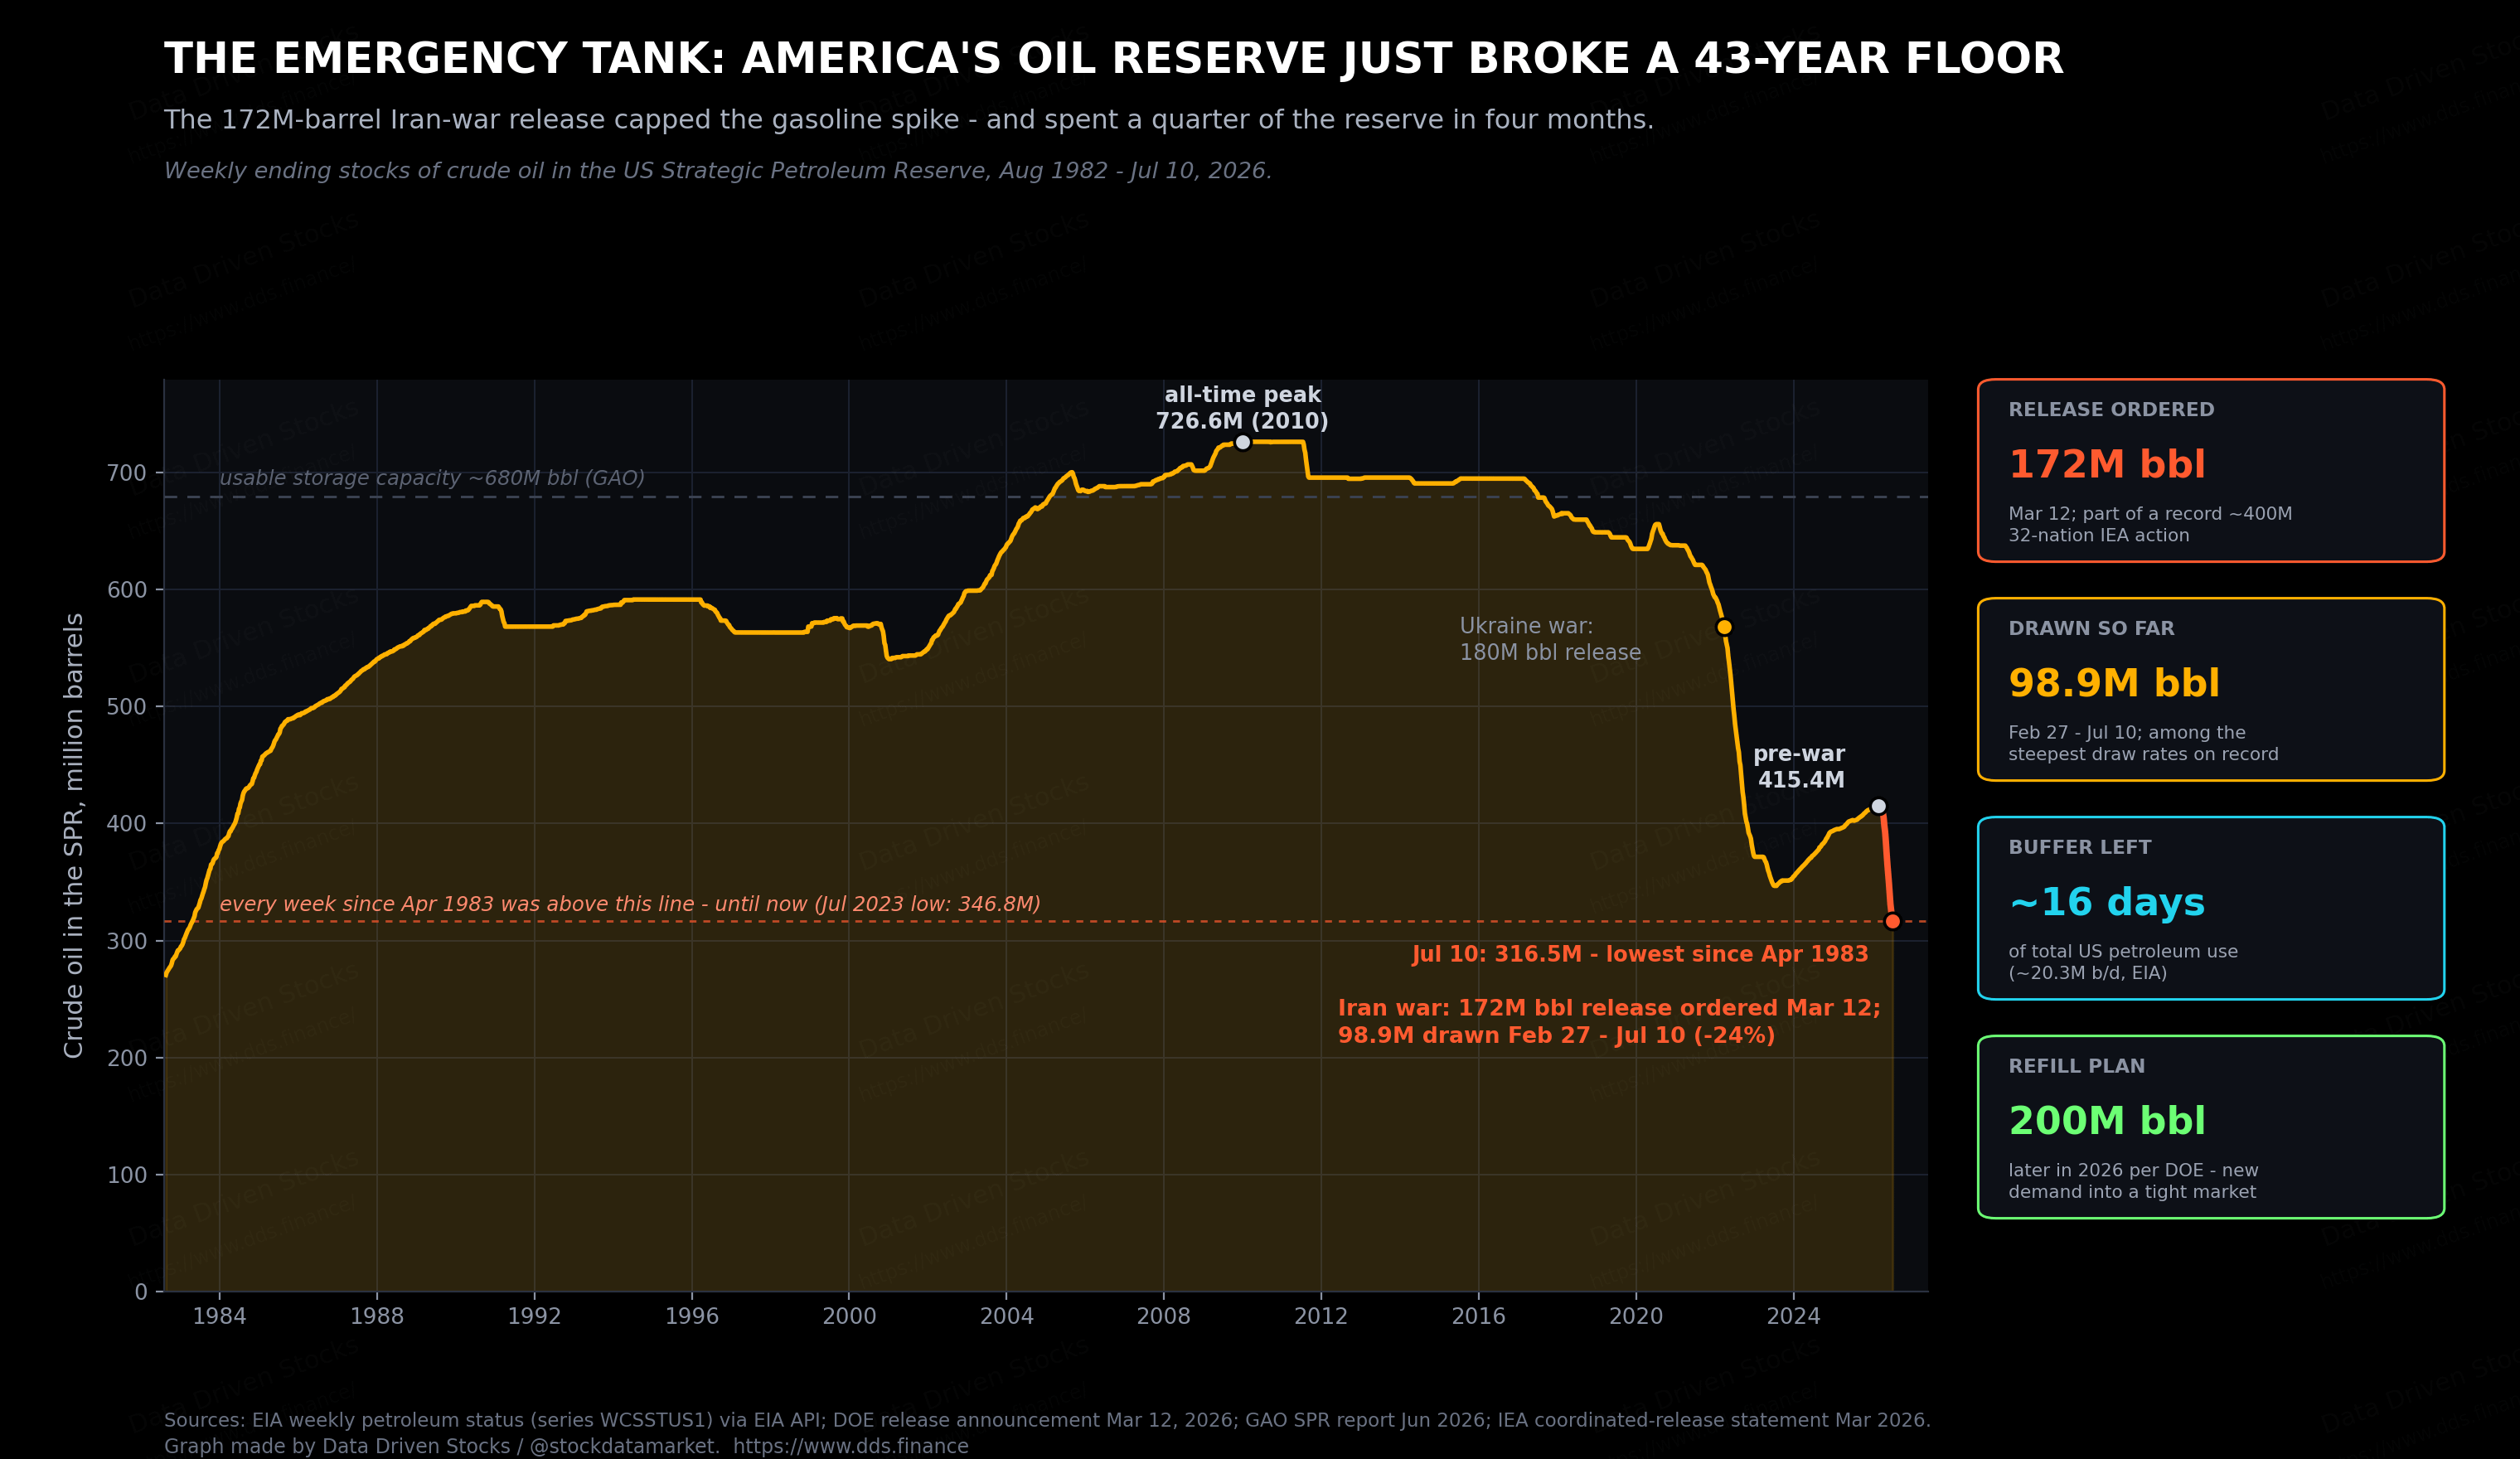
The least discussed number in this whole story sits in salt caverns along the Gulf coast. On March 12, two weeks into the war, the Department of Energy authorized a release of up to 172 million barrels from the Strategic Petroleum Reserve, the American share of a coordinated release of roughly 400 million barrels across 32 IEA countries, the largest such action ever taken.
It worked, in the narrow sense. The flood of barrels helped cap the spike and greased the slide once the ceasefire came. But the bill is now visible in the weekly data. The reserve held 415.4 million barrels on the eve of the war. As of July 10 it holds 316.5 million. That is a draw of 98.9 million barrels in nineteen weeks, and it puts the SPR below every weekly reading since April 1983, under the 2023 trough that followed the Ukraine release, and under anything a working trader has seen on a screen.
Three things follow from that. First, the cushion against the next shock is thinner. At current US consumption of about 20 million barrels a day, the reserve covers roughly 16 days of total use. Second, the Energy Department says it intends to buy back around 200 million barrels later in 2026 to refill. That is new demand, from a price-insensitive buyer, into a market that is already tight. Refilling at $80 what you released at $100 still beats the alternative, but it puts a floor under crude exactly when consumers would like one removed. Third, the option is largely spent. If Hormuz stays hot into the autumn, Washington cannot run this play again at the same size.
The fair counterargument deserves its space: commercial inventories matter more for day-to-day prices than the strategic stockpile, US production remains near record levels, and a reserve exists precisely to be used in a supply war. All true. But buffers are like brakes. You notice them on the day you need them, and the pads are now the thinnest they have been since Reagan’s first term.
The Apple paradox
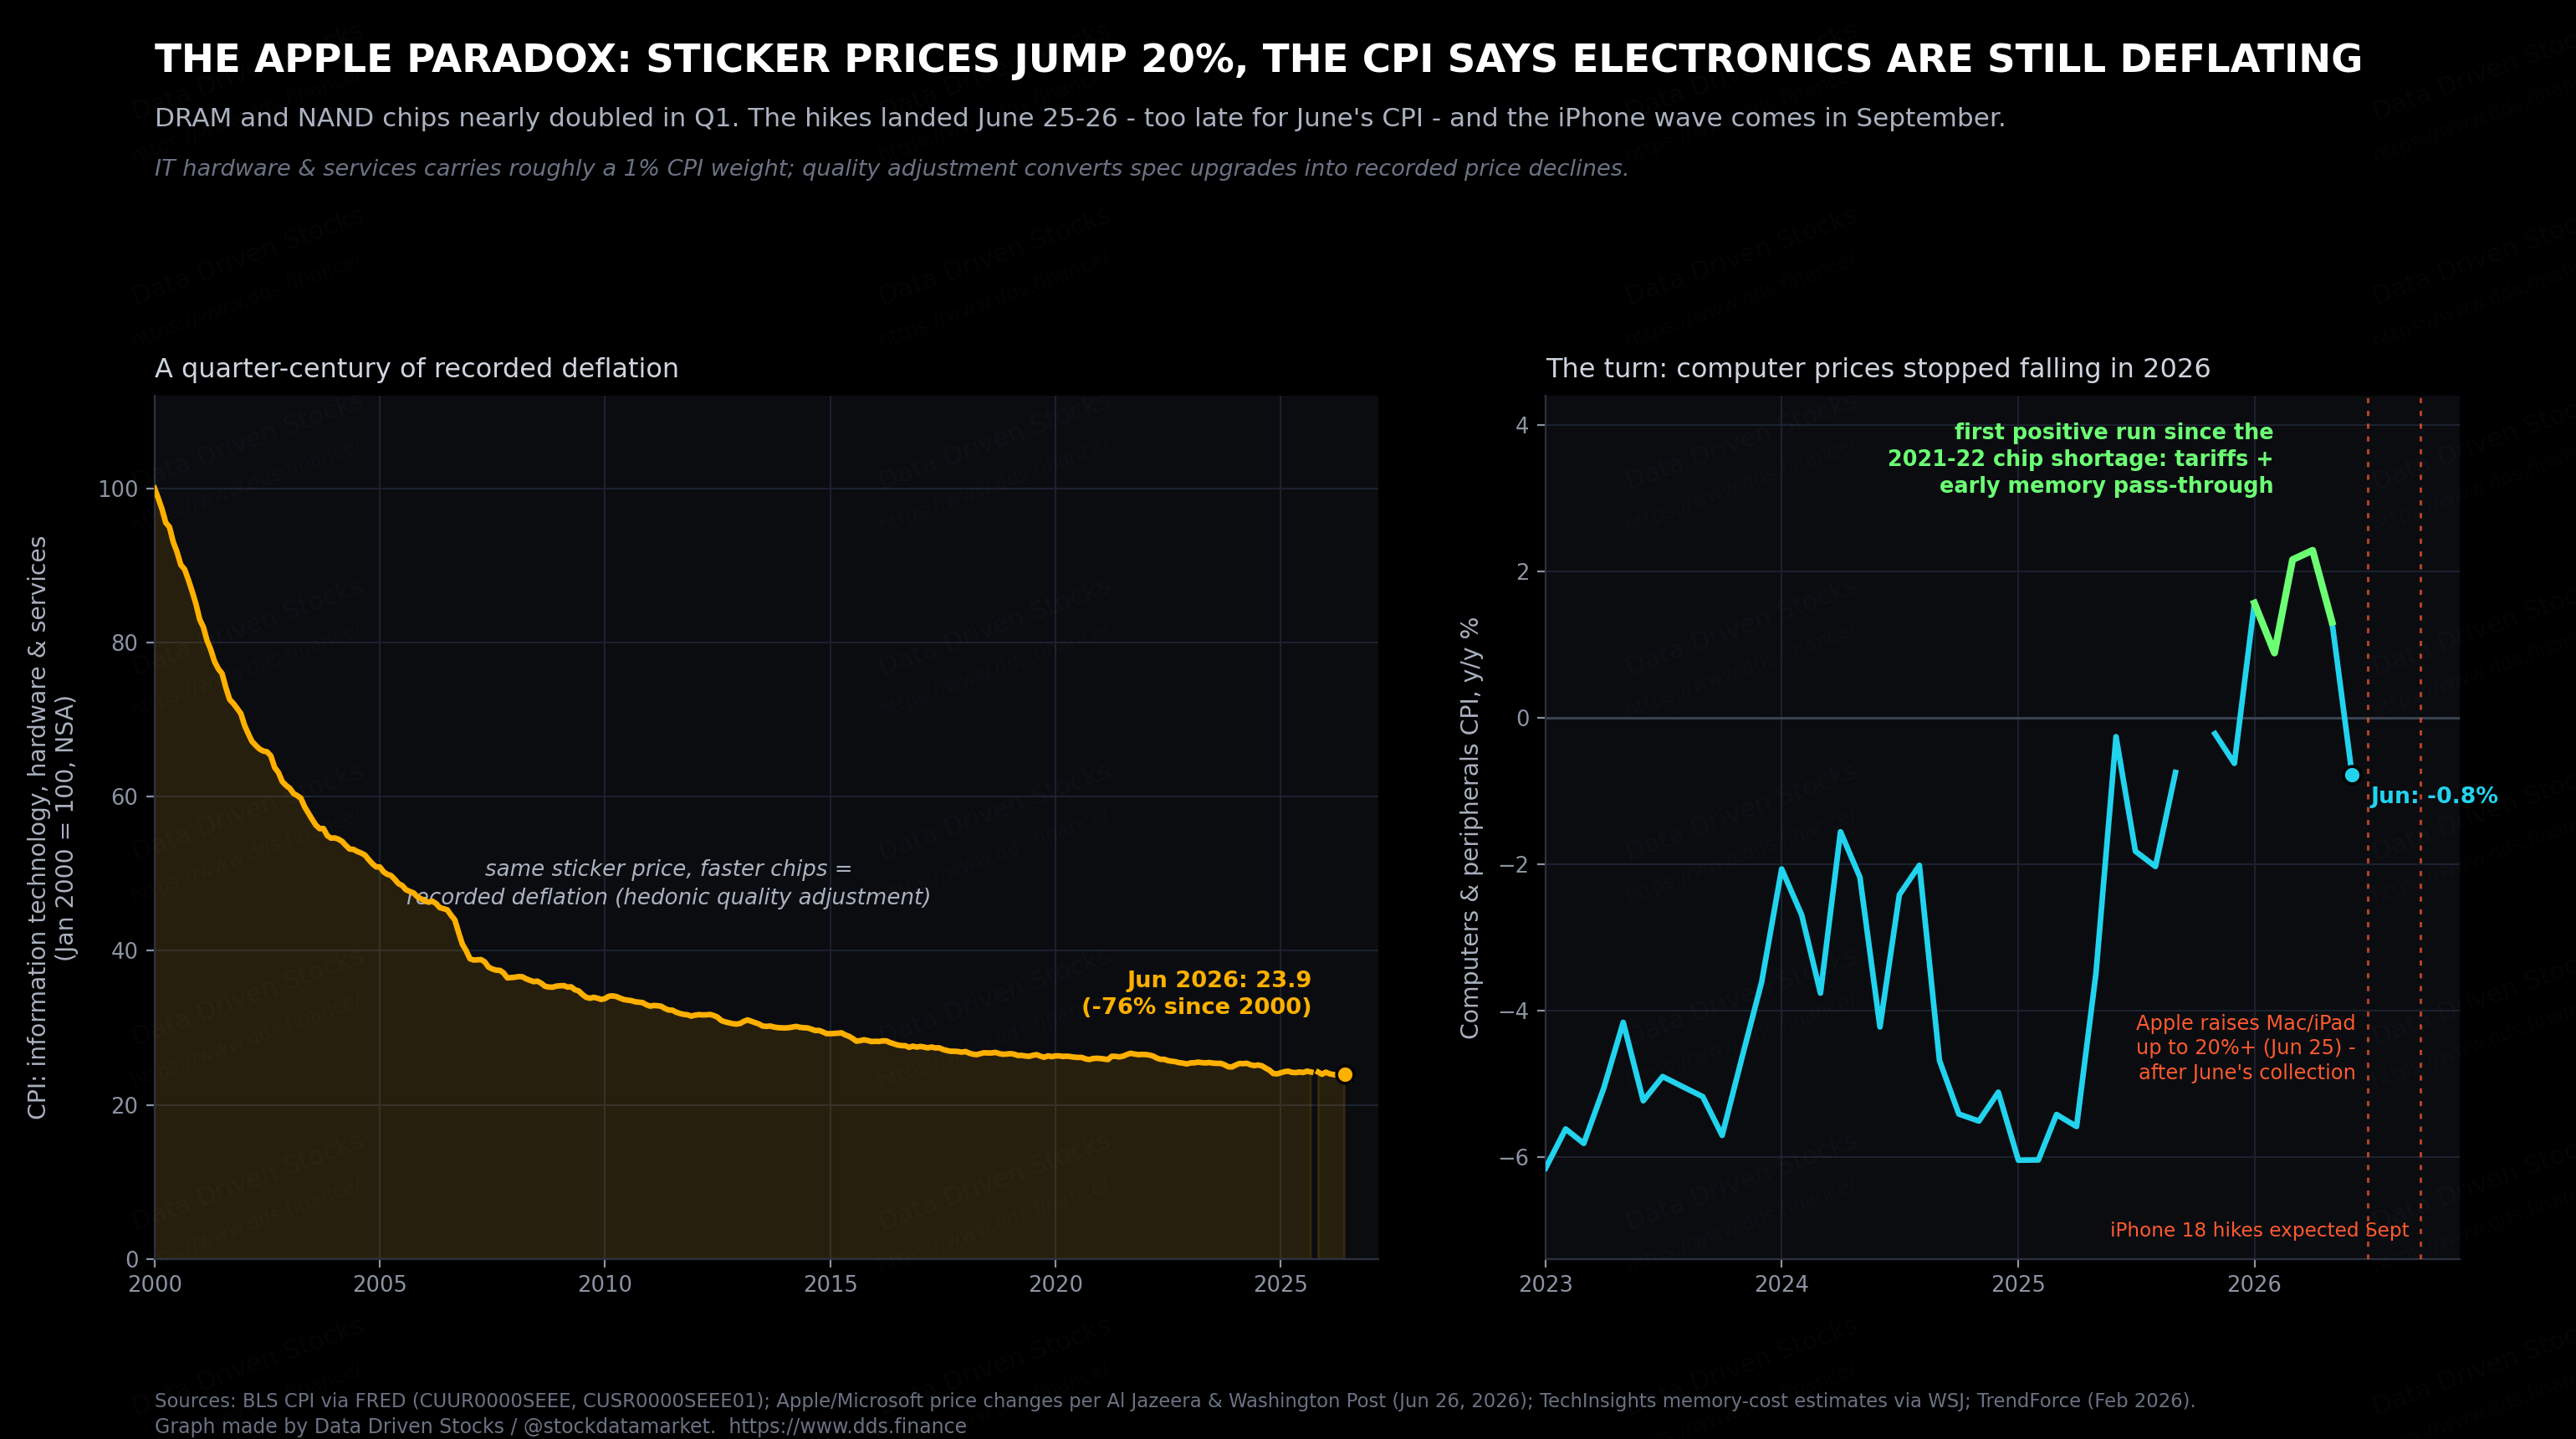
Here is a puzzle for your commute. In late June, Apple raised US prices on Macs and iPads by up to 20% and more. A MacBook Air went from $1,099 to $1,299. An iPad Pro from $999 to $1,199. Microsoft lifted Xbox prices by $100 to $150. Reporting points to iPhone 18 increases of $50 to $200 in September. The driver is a genuine cost shock: contract prices for DRAM and NAND memory chips roughly doubled in the first quarter as AI datacenters swallowed the world’s supply.
And yet the June CPI shows information technology hardware and services about 1.4% below a year ago, with computers slipping 0.8%. How can shelves scream inflation while the index whispers deflation?
Three mechanical reasons, and they are worth knowing because they tell you when the shoe drops. First, timing. The BLS collects most prices throughout the month, and Apple’s increases landed June 25 and 26, after the bulk of June’s collection. They belong to July’s print, at the earliest. The September iPhone wave belongs to autumn. Second, hedonic quality adjustment. When a new device costs the same but carries a faster chip, the BLS records that as a price decline, because you are getting more machine per dollar. This is why the official IT index has fallen 76% since 2000 while your actual spending on devices has not. The method is defensible and internationally standard, and it also means sticker shock reaches the CPI slowly and partially. Third, weight. The whole IT category is only about 1% of the basket. Even a clean 10% jump would add roughly a tenth of a point to headline inflation.
The early tremors are visible if you know where to look. The computers index just posted five straight months of positive annual readings, January through May, its first such run since the 2021-2022 chip shortage, before dipping back in June. Tariffs started that. Memory costs will continue it. It will not rescue the hawks by itself at 1% of the basket, but it is one more small weight on the wrong side of the scale for the second half.
What five years of this looks like
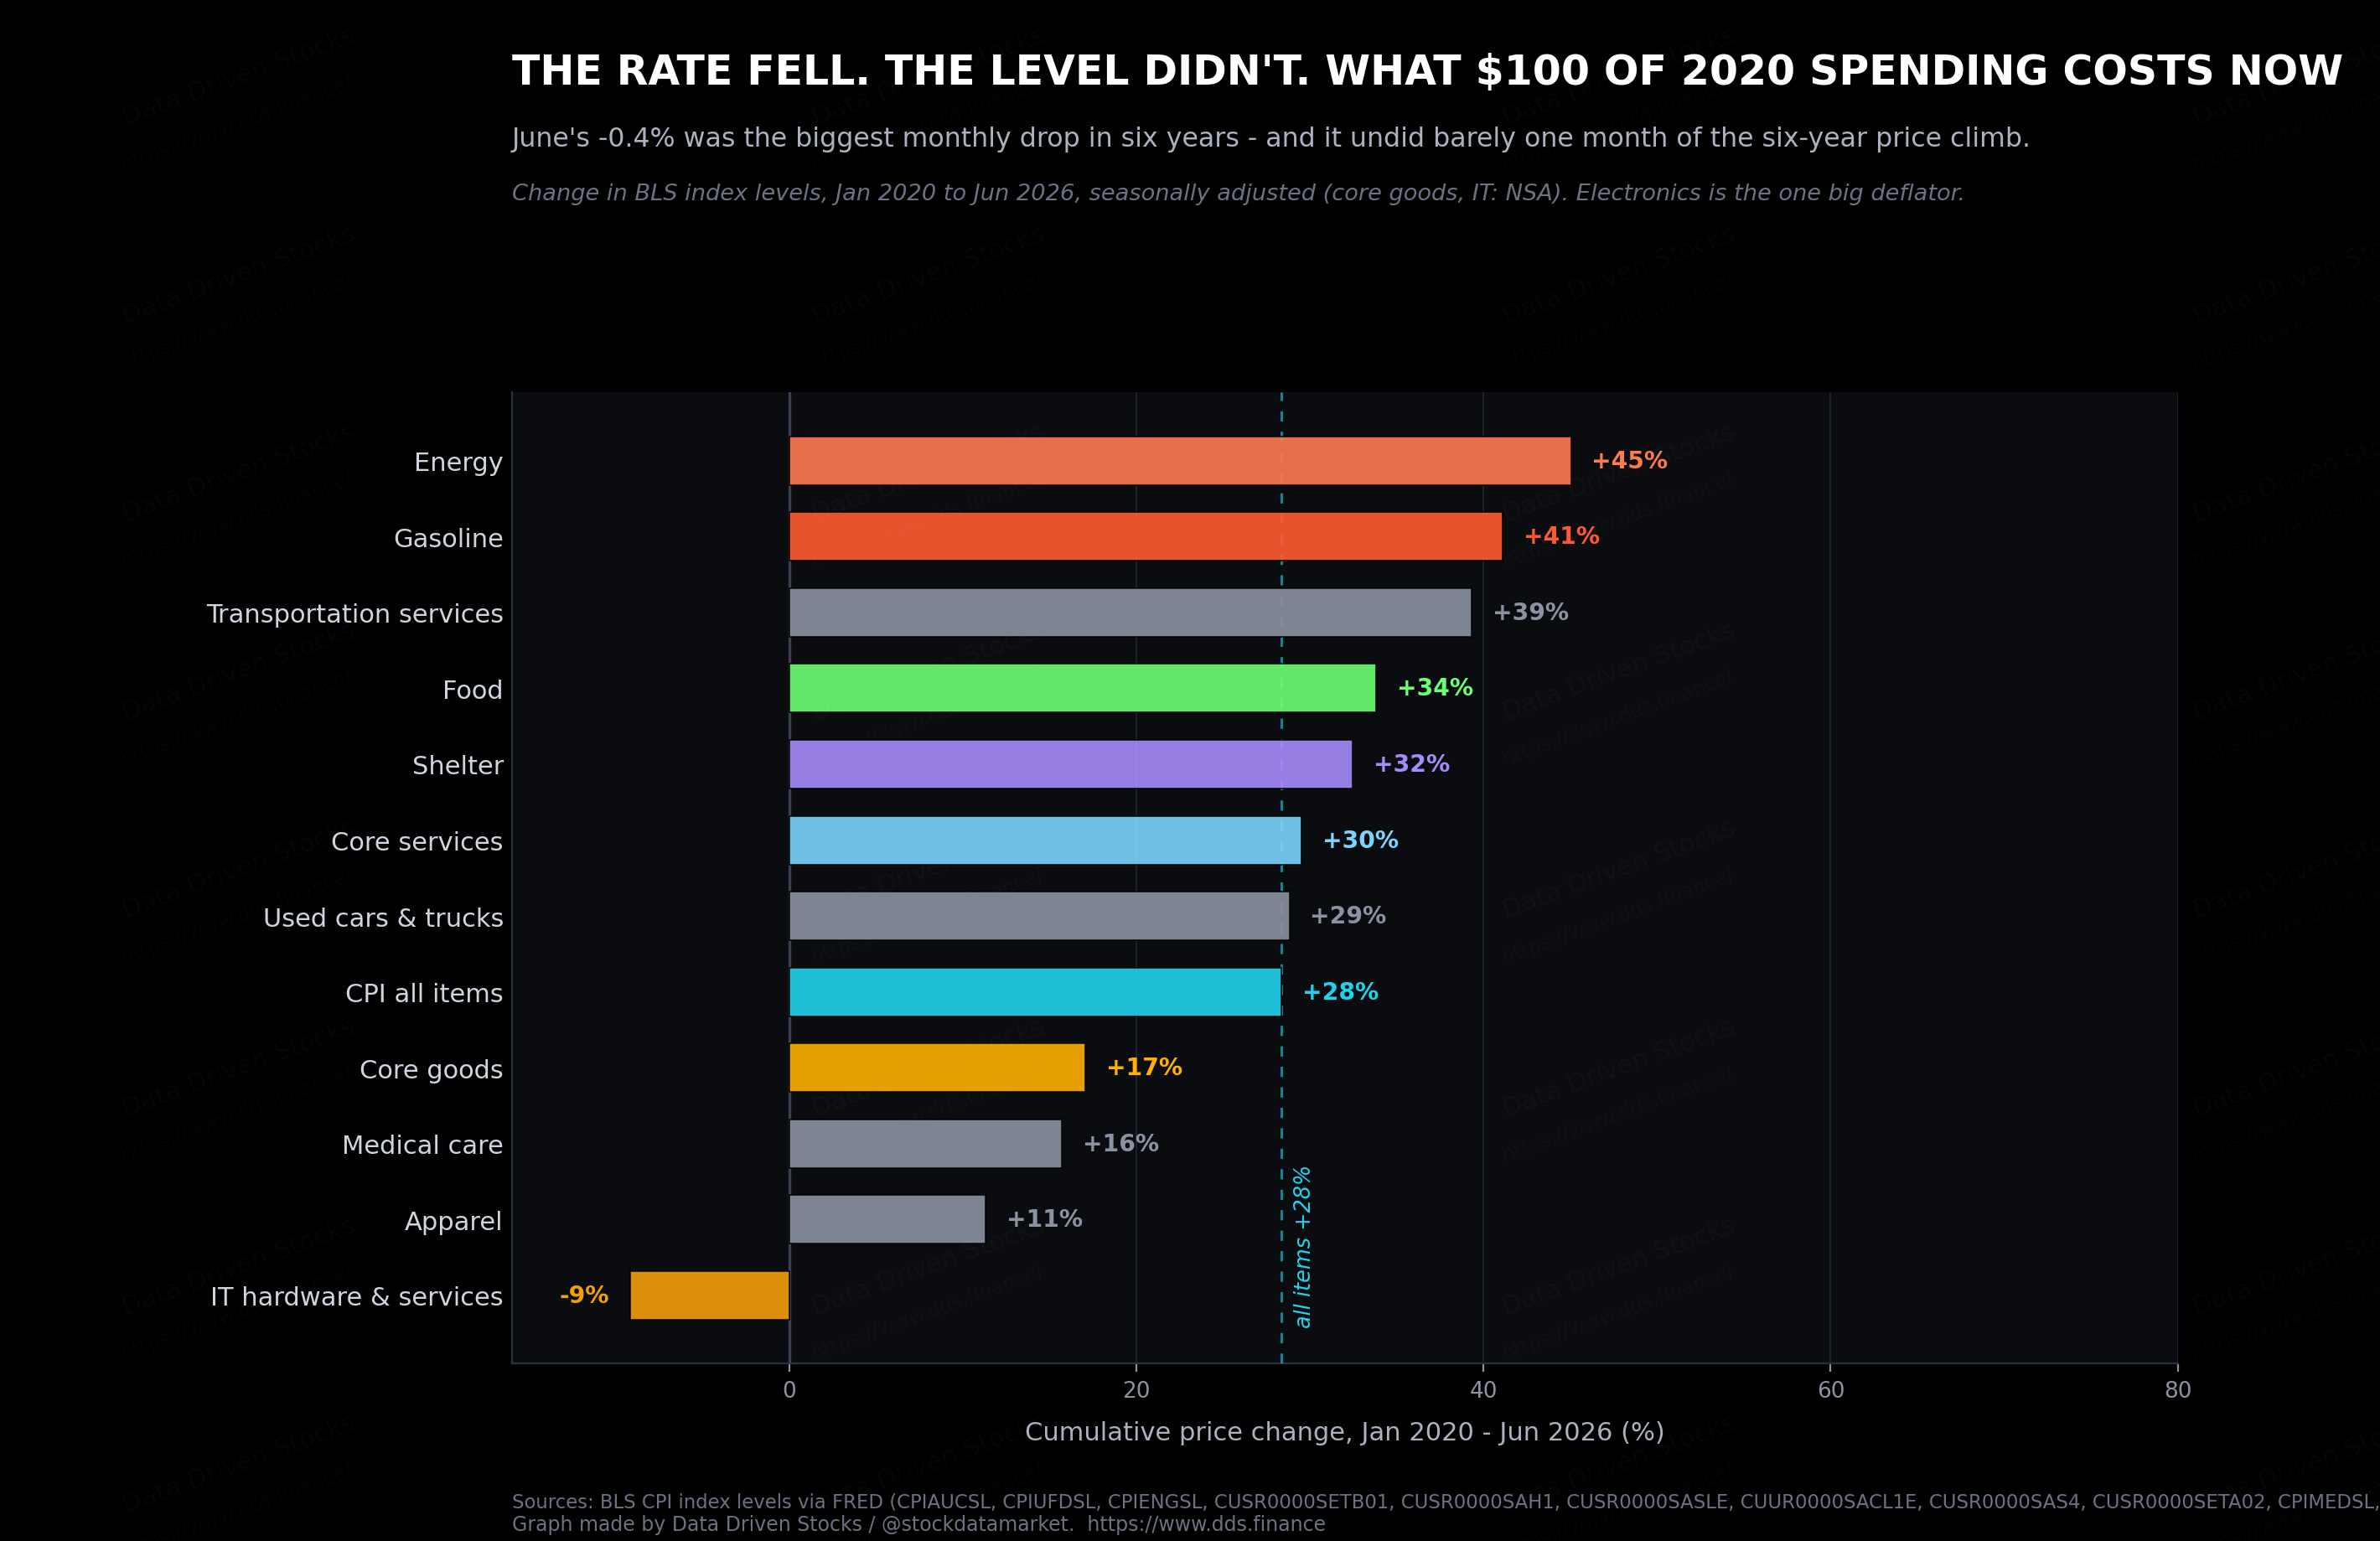
Zoom out and the June drama shrinks. Since January 2020 the all-items index is up about 28%. Energy is up 45%, gasoline 41%, transportation services 39%, food 34%, shelter 32%. Electronics, down 9%, is the lone big deflator on the board, and we just covered why that understates what you paid.
Against that backdrop, June’s -0.4% undid barely one month of a 77-month climb. This is the distinction between the rate and the level, and it decides how people feel. Economists cheered the rate while shoppers keep paying the level, and both are reading the same data correctly.
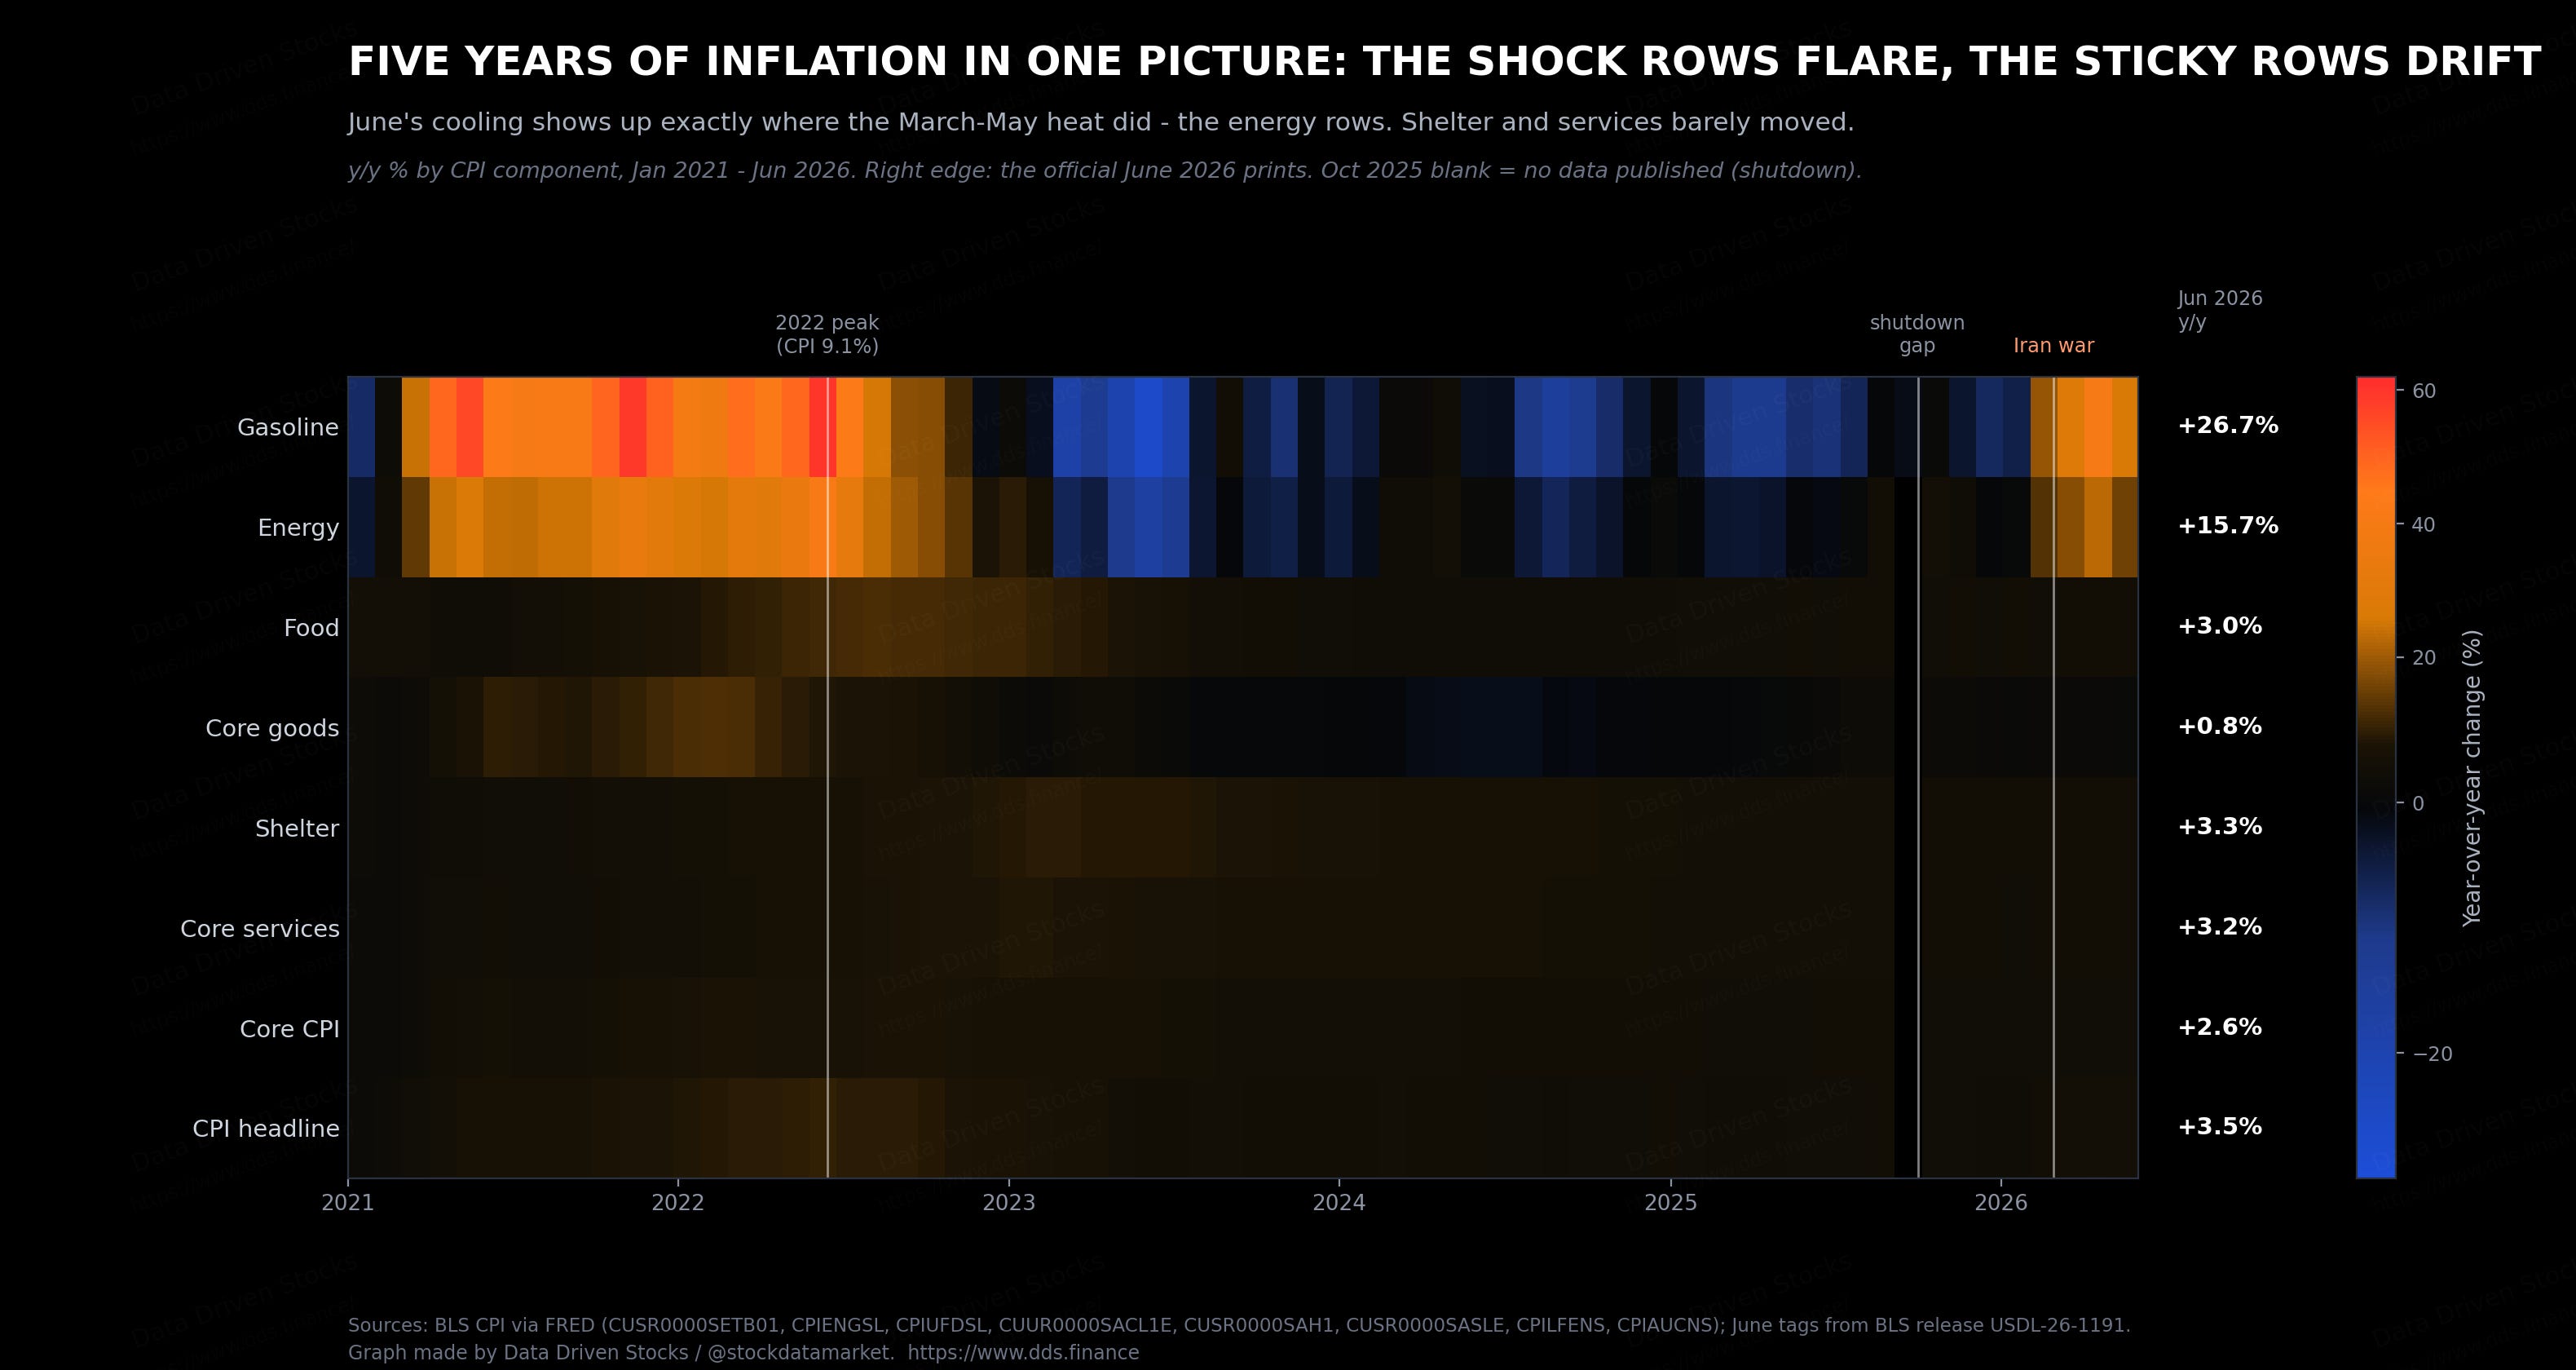
For the pattern across time rather than levels, the heat map below is the single best picture we know how to draw. The shock rows at the top flare and fade with every geopolitical event. The sticky rows at the bottom just drift, slowly, stubbornly, at around 3%.
The whole machine on one page
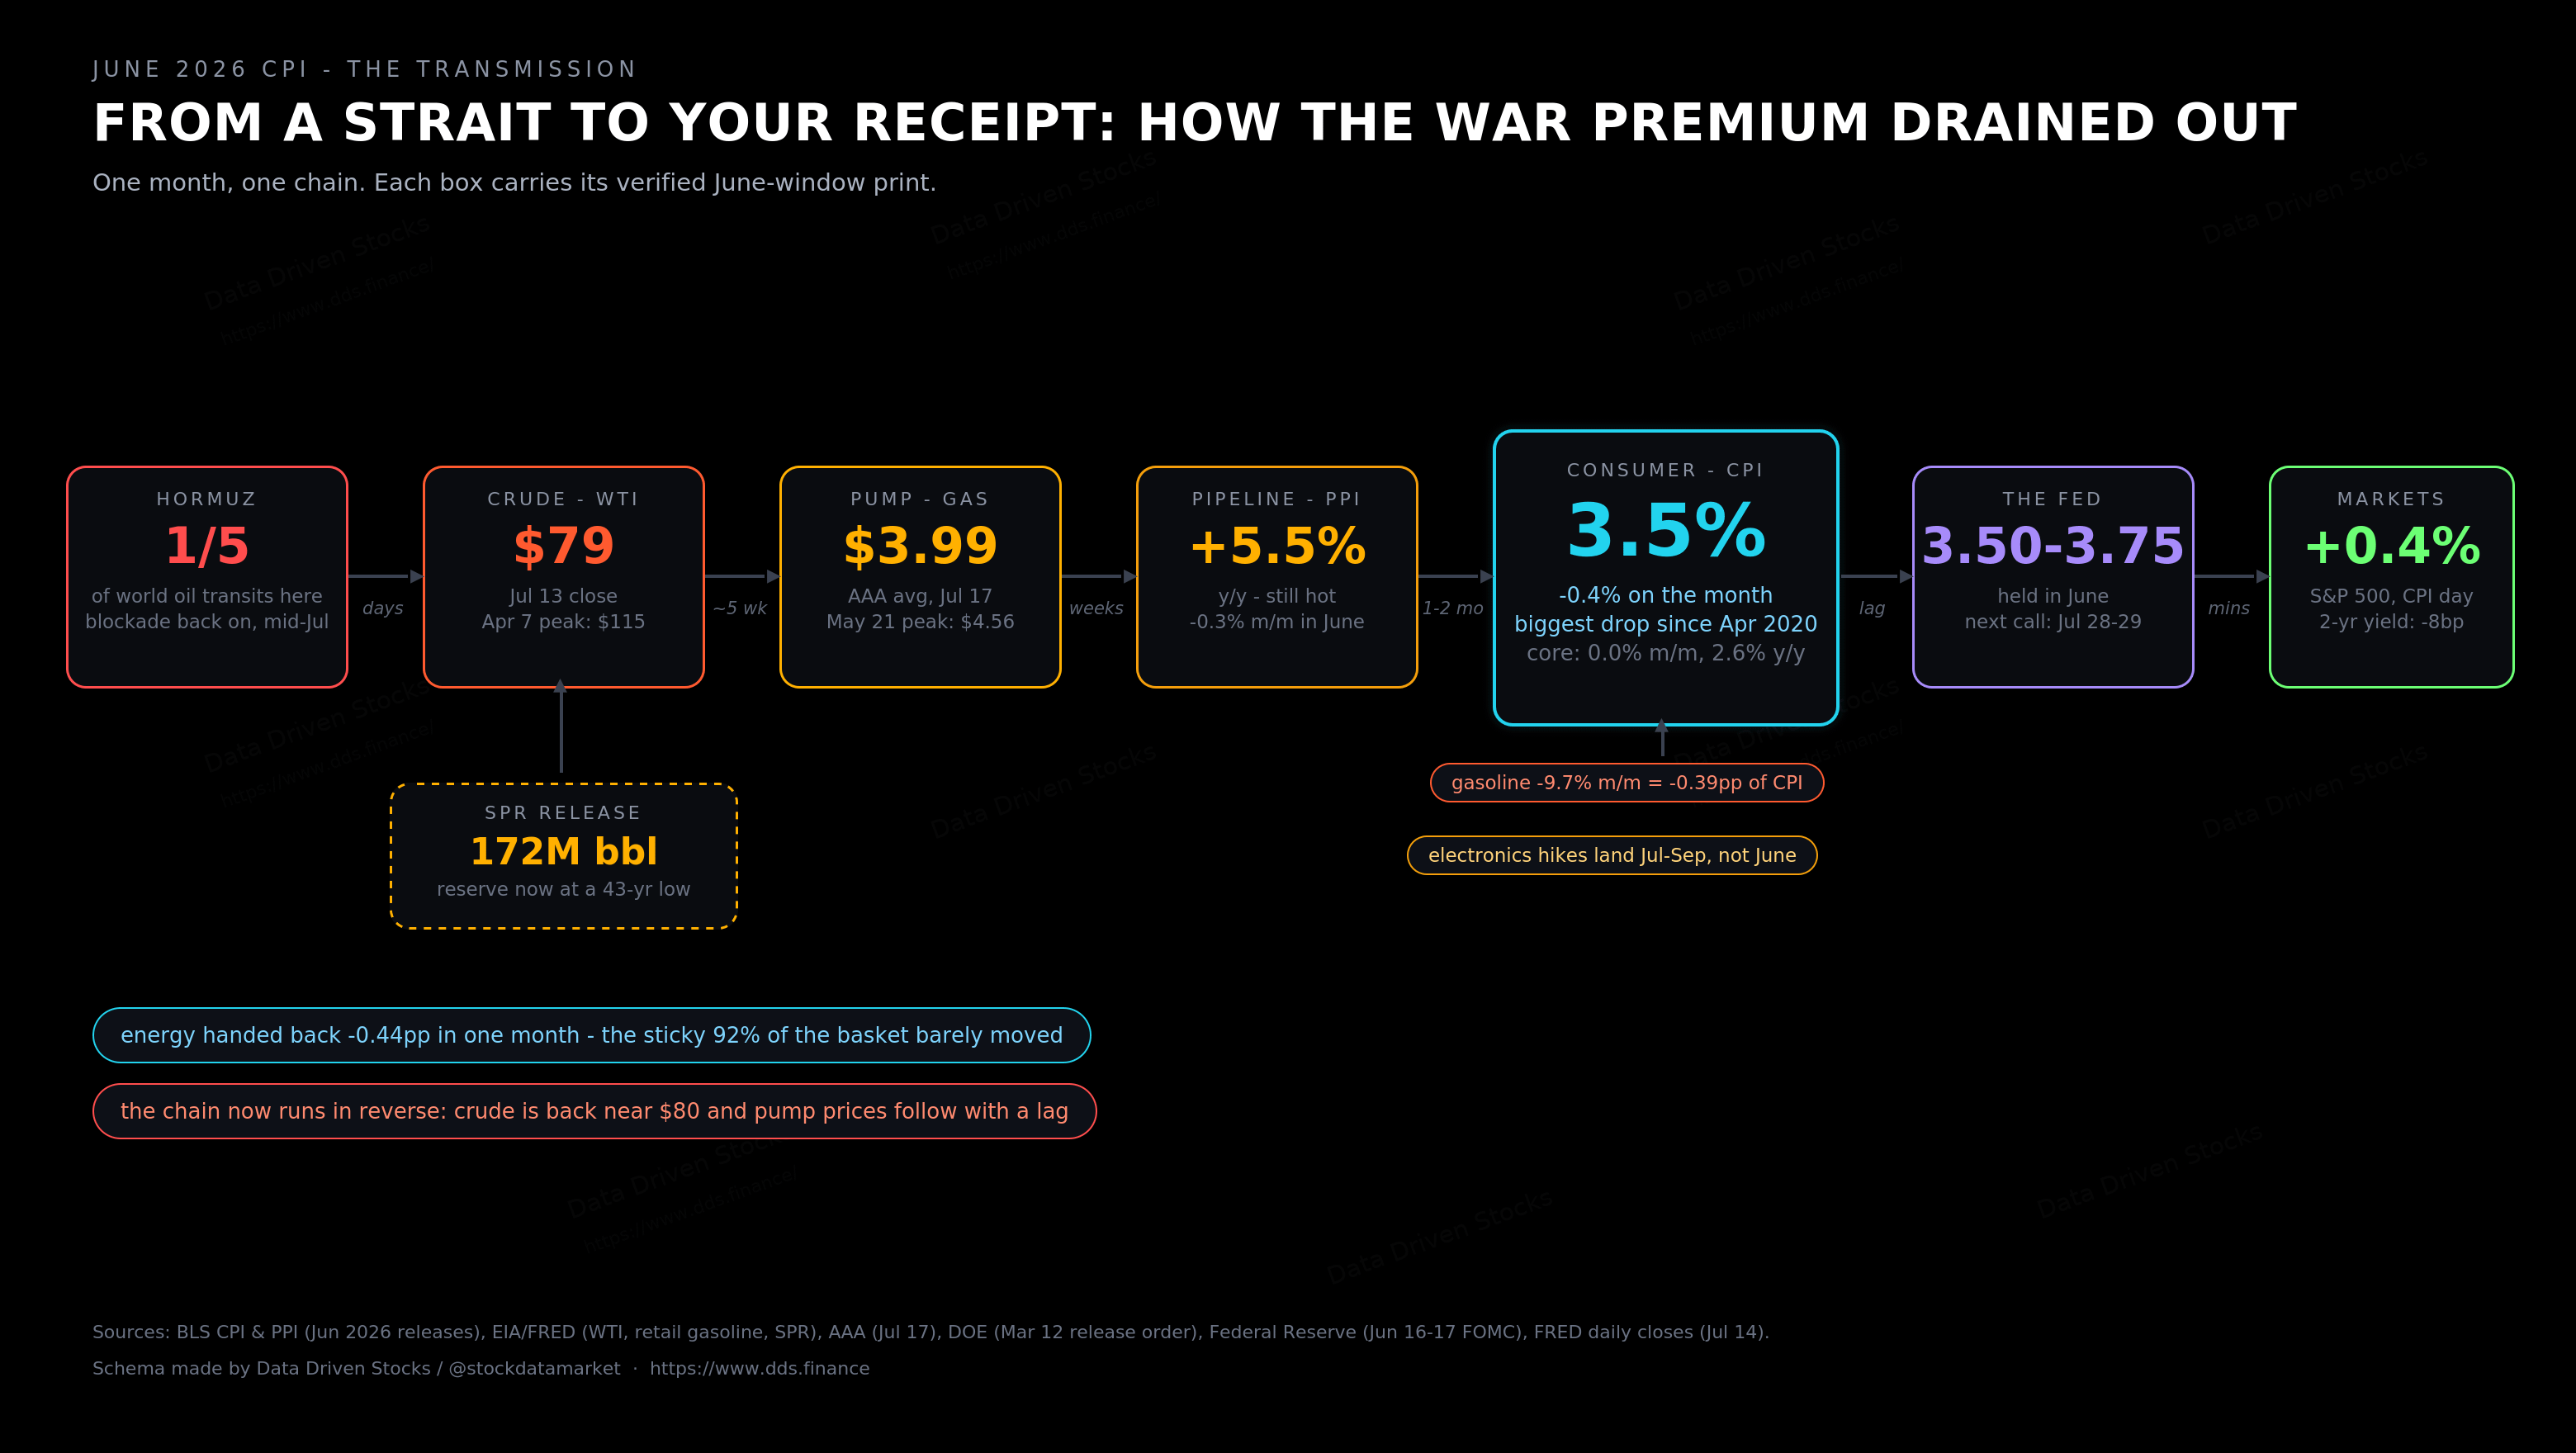
Every number in this article sits somewhere on a single chain: a strait, a barrel, a pump, a factory gate, a receipt, a central bank, a ticker. The schema below carries each link’s verified June reading. Follow it left to right and you have the month. Notice the two feedback loops underneath, the SPR pushing barrels in and the electronics wave waiting to push prices up, because those two decide whether July looks anything like June.
The Fed just got room it didn’t expect
Rewind to mid-June. The FOMC held rates at 3.50% to 3.75% at Kevin Warsh’s first meeting as chair, dropped its easing bias, and penciled in 2026 inflation forecasts of 3.6% headline PCE and 3.3% core. About half the committee saw hikes before year-end. Warsh told reporters he had “no tolerance for persistently elevated inflation.” Going into July 14, futures markets priced a July hike as close to a coin flip.
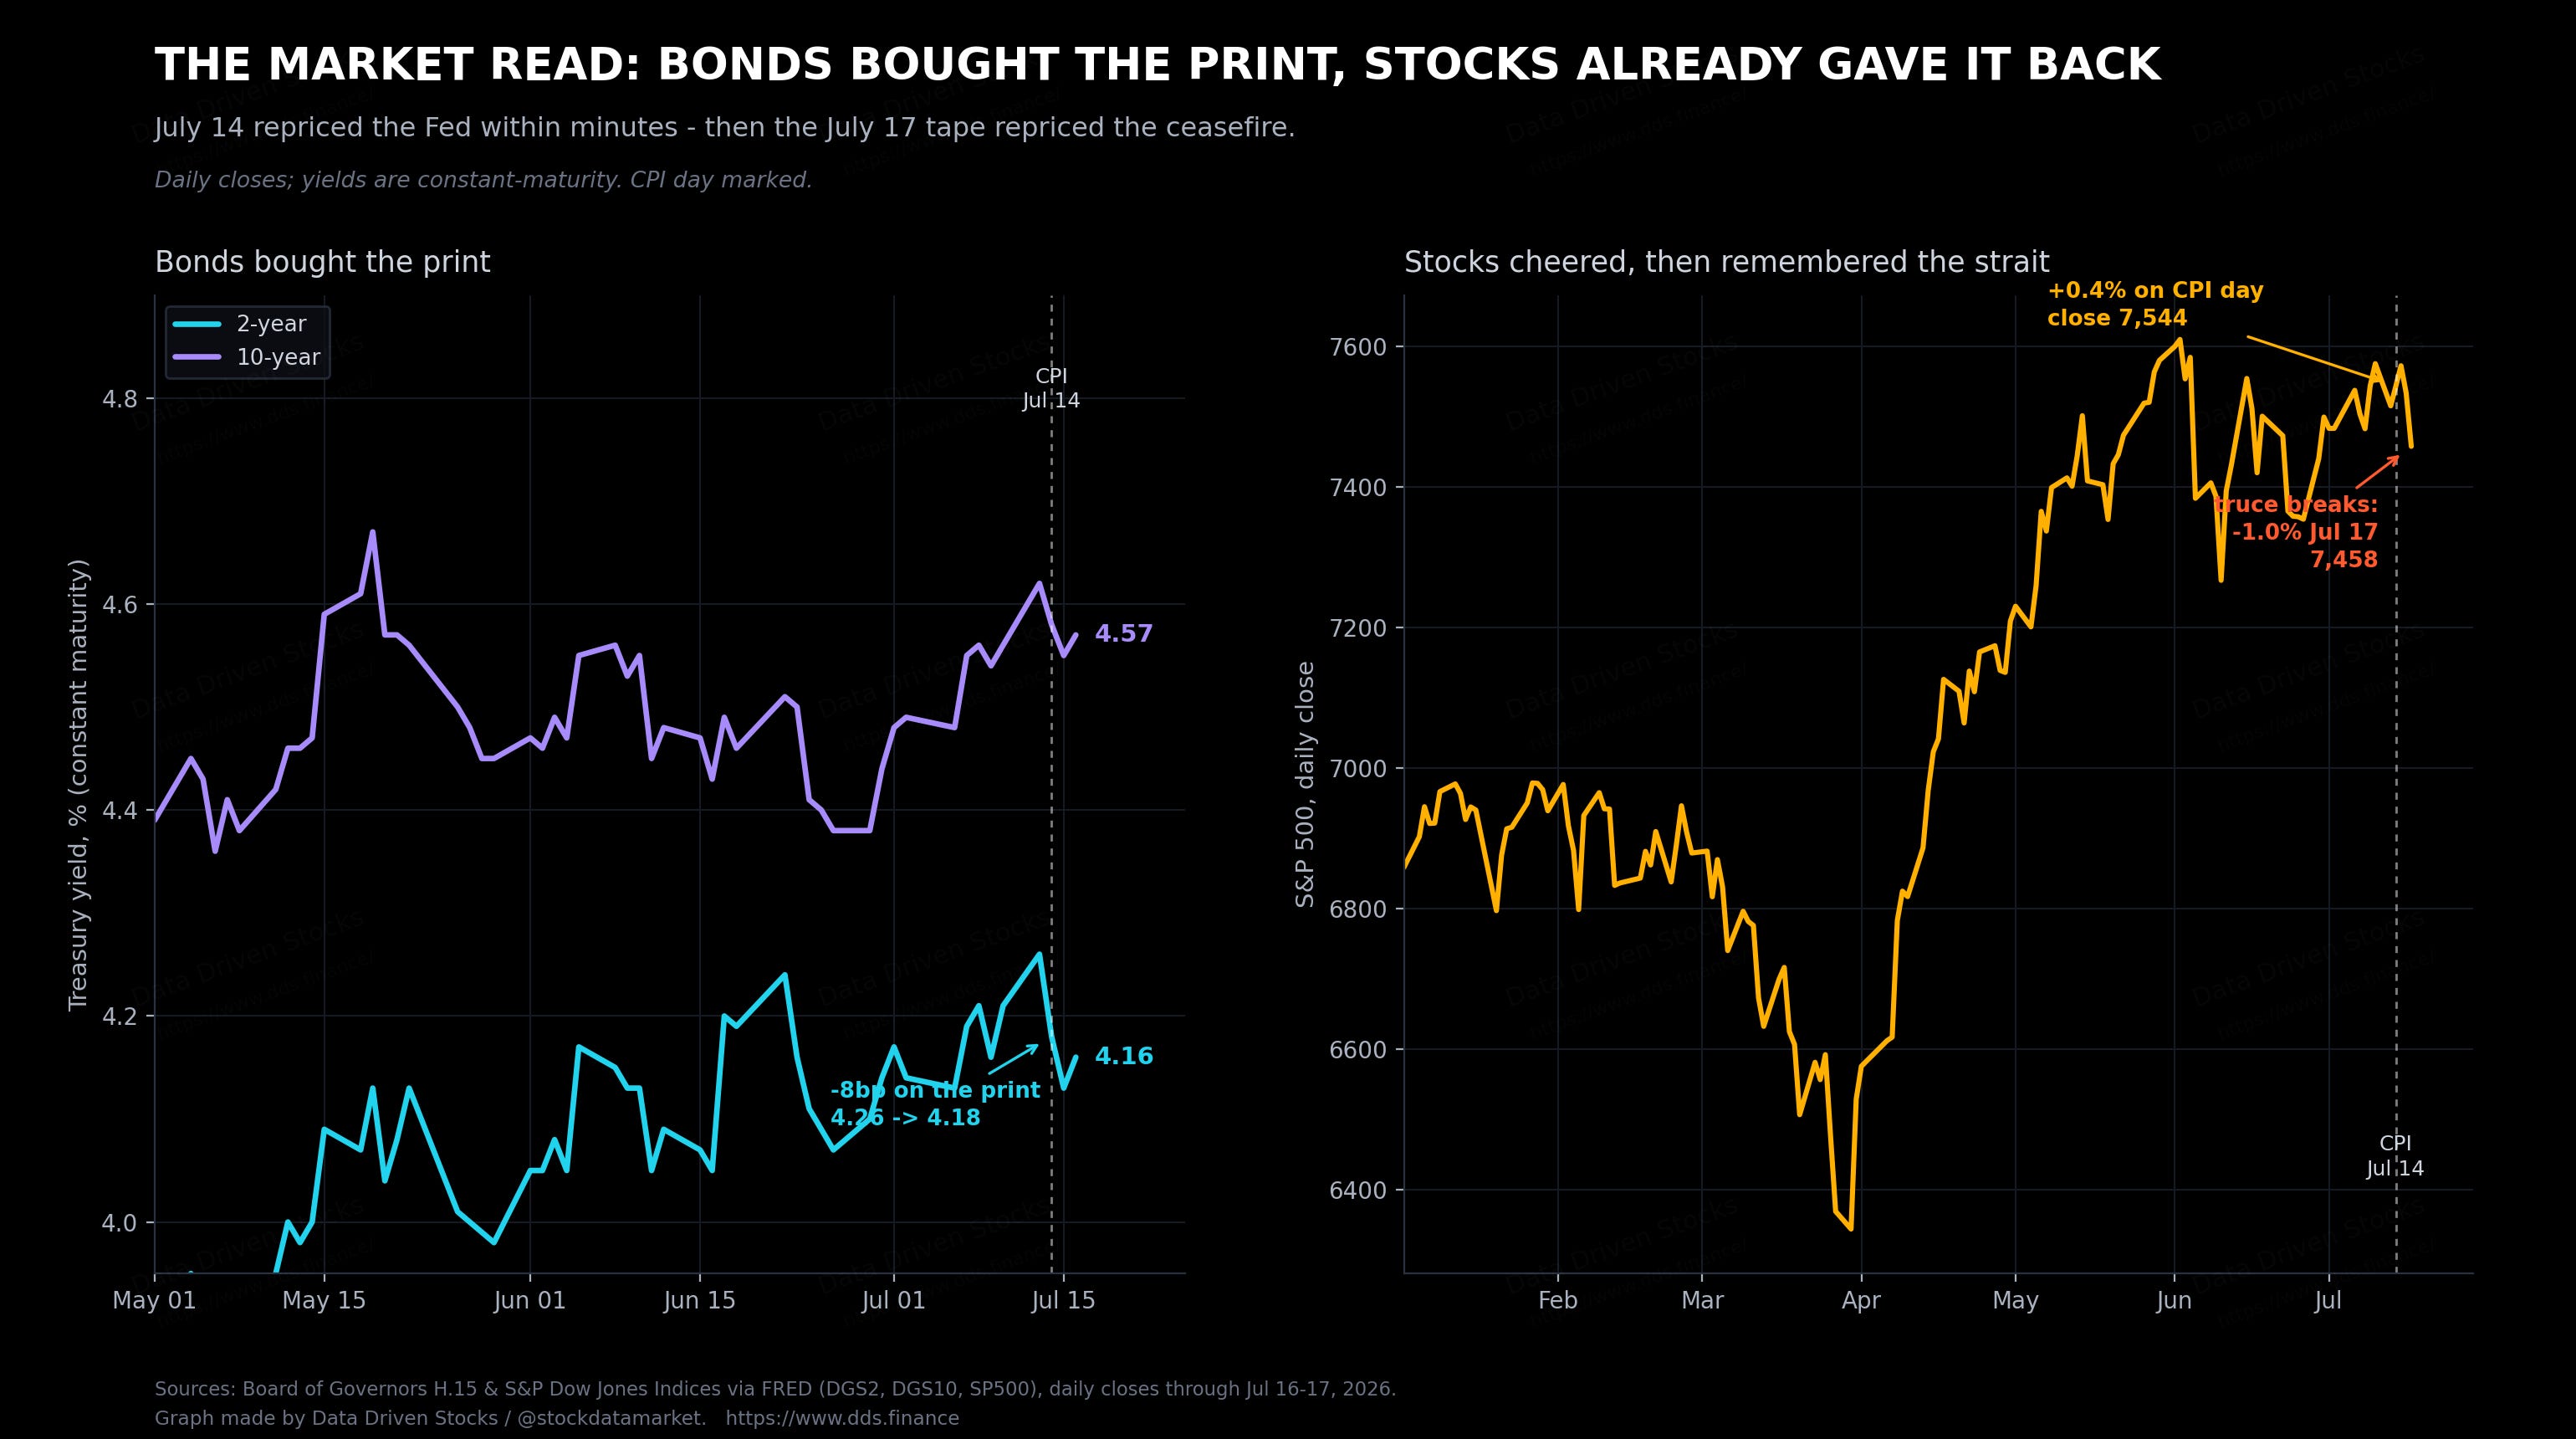
The print changed the room. Within a day, a July hold became the clear base case, though the exact odds were messy: some FedWatch snapshots that afternoon showed hold probabilities in the high 80s, others in the low 60s, a spread worth remembering next time someone quotes market-implied certainty to one decimal. September repriced too, with hike odds sliding to about 63% from above 75%. Two-year Treasury yields fell 8 basis points to 4.18%, the ten-year eased four to 4.58%, the dollar slipped 0.6%, and the S&P 500 rose about 0.4% to close near 7,544. The relief did not survive the week: as the blockade went back on, the index gave back a full percent by Friday’s close.
Two cautions before anyone declares victory. The Fed targets PCE, not CPI, and the latest PCE reading, for May, still shows 4.1% headline and 3.4% core. June’s PCE lands around July 31 and will run cooler, but the gap between the Fed’s gauge and its 2% target remains wide. And the committee has watched the pump turn back toward $4 in the ten days since the CPI came out. A hold on July 28-29 looks very likely; a pivot to cuts does not.
Where this goes: three roads, same destinations
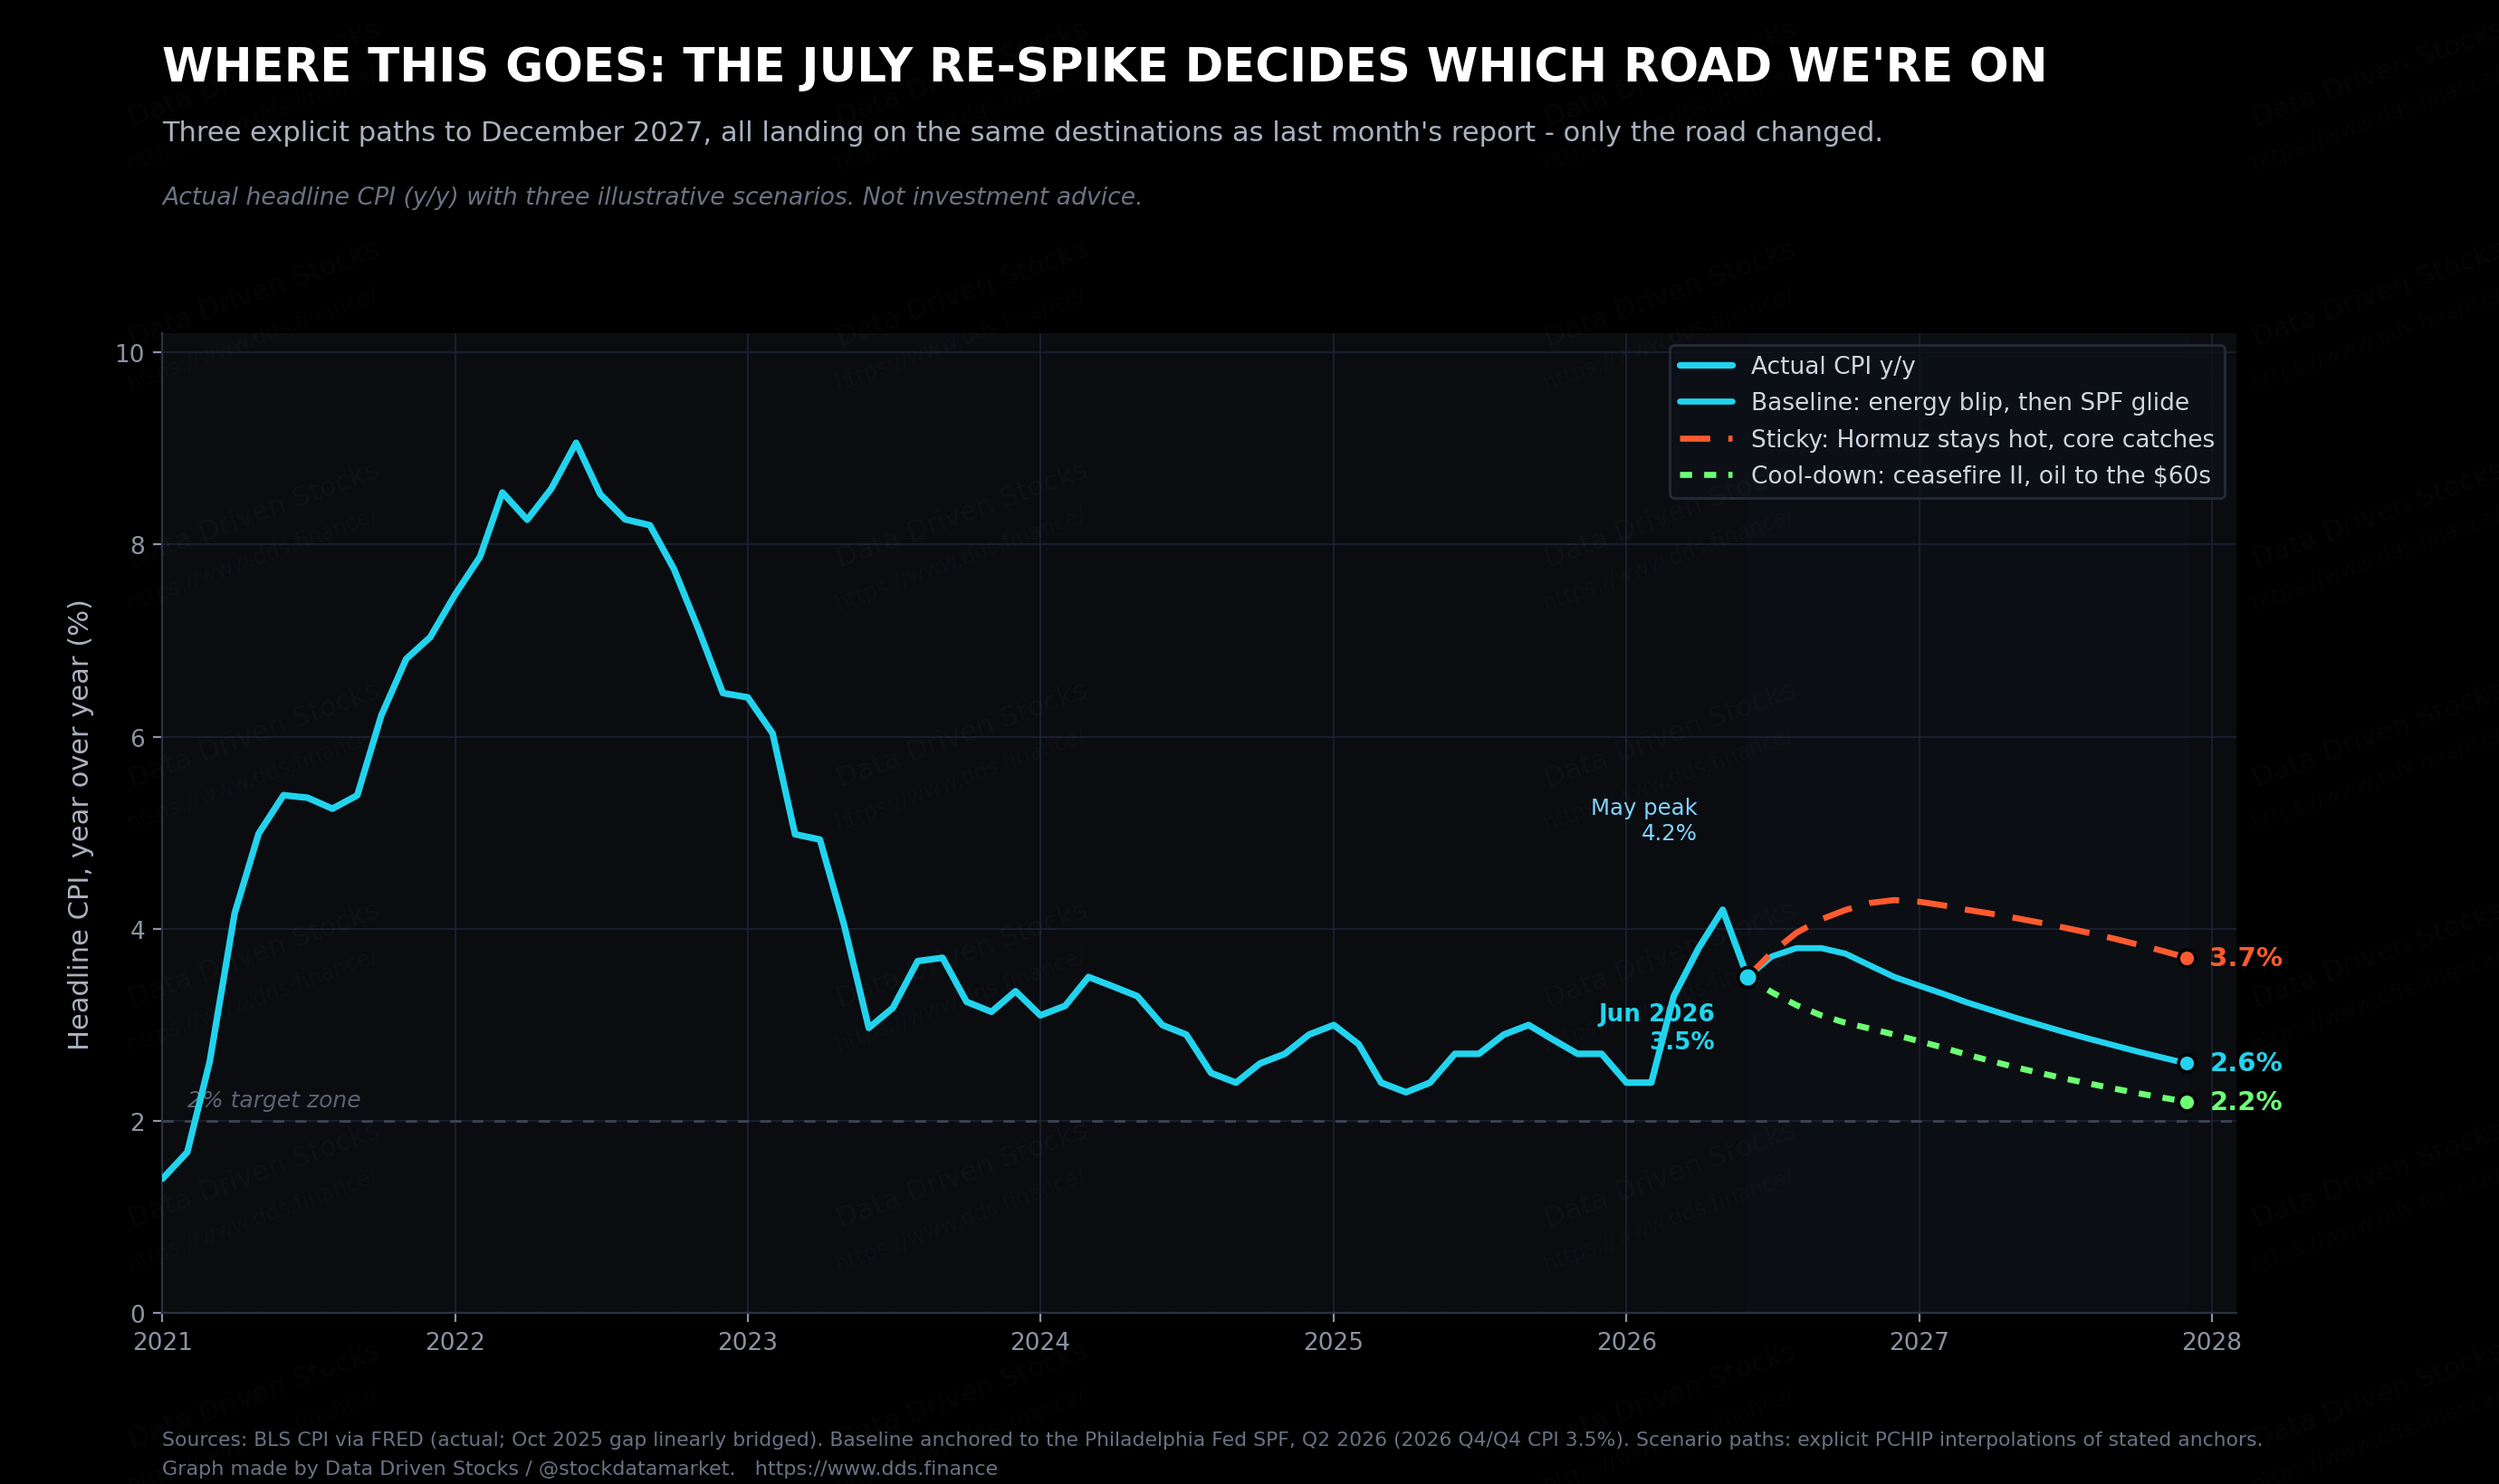
Last month, with May’s 4.2% in hand, we sketched three paths to the end of 2027: a baseline gliding to 2.6%, a sticky path stuck at 3.7%, a cool-down reaching 2.2%. One month later the data has undershot our baseline, the ceasefire came and went, and the July re-spike is live. So we are keeping the destinations and redrawing the roads: the endpoints match June’s report, while the geometry to reach them does not.
The baseline says the July and August prints give back part of June’s gift as gasoline turns positive again, lifting the annual rate to around 3.8% by September. Then base effects and a slow services cooldown grind it back to roughly 3.5% by December, matching the Survey of Professional Forecasters, and on to 2.6% by the end of 2027. The sticky path assumes Hormuz stays disrupted into winter, crude holds in the $90s or worse, and the electronics wave meets firm services: inflation re-tests 4.3% around year-end and is still near 3.7% in December 2027. The cool-down assumes a second, durable ceasefire and crude in the $60s, which drags the rate below 3% by December and toward 2.2% by end-2027.
These are illustrative scenarios, not investment advice, and the honest tell for which road we are on will not be oil at all. Watch supercore services. It printed -0.2% in June. If the July report, due August 12, shows supercore at +0.3% or more while gasoline flips positive, then June was a gasoline story wearing a disinflation costume. If supercore stays near zero, the destination shifts down and the cool-down path gets real.
The bottom line
June 2026 delivered the softest US inflation print in six years, and it deserved the market’s applause: core flat, shelter at a five-year-low monthly pace, supercore negative. Those are real, and they are the part of the report worth keeping.
But the headline number was a gasoline event. A 4% slice of the basket, moving on a ceasefire that no longer exists, produced a monthly decline of a size seen only 17 times since 1947, nearly always in the shadow of a crash. The pump is back at $3.99 and climbing. The strategic reserve that helped engineer the slide is at a 43-year low with a 200-million-barrel refill order hanging over the market. The Apple and memory-chip price wave starts printing in July and September. And the Fed’s own gauge is still above 4%.
Enjoy the 3.5%. Just know what bought it, and know that the seller wants it back. The next reading arrives August 12, and the supercore line will be the first thing we check.
If this saved you a morning of digging, share it with the person on your desk who still thinks CPI is one number. Follow @stockdatamarket for the daily version.
Sources
BLS, Consumer Price Index, June 2026 release (USDL-26-1191, July 14, 2026): https://www.bls.gov/news.release/cpi.nr0.htm and https://www.bls.gov/cpi/
BLS, Producer Price Index, June 2026 release (July 15, 2026): https://www.bls.gov/news.release/ppi.nr0.htm
BLS, US Import and Export Price Indexes, June 2026 (July 17, 2026): https://www.bls.gov/news.release/ximpim.nr0.htm
BLS, Real Earnings, June 2026 (July 14, 2026): https://www.bls.gov/news.release/realer.nr0.htm
BEA, Personal Consumption Expenditures Price Index, May 2026 (June 25, 2026): https://www.bea.gov/data/personal-consumption-expenditures-price-index
Federal Reserve Bank of St. Louis, FRED database, series CPIAUCSL, CPIAUCNS, CPILFESL, CPIENGSL, CPIUFDSL, CUSR0000SETB01, CUSR0000SAH1, CUSR0000SASLE, CUUR0000SACL1E, CUUR0000SEEE, CUSR0000SEEE01, PPIFIS, PPIFES, PCEPI, PCEPILFE, DCOILWTICO, DCOILBRENTEU, MCOILWTICO, GASREGW, GASDESW, DGS2, DGS10, SP500: https://fred.stlouisfed.org
EIA, Weekly Petroleum Status Report and gasoline price survey: https://www.eia.gov/petroleum/supply/weekly/ and https://www.eia.gov/petroleum/gasdiesel/
EIA, Strategic Petroleum Reserve weekly stocks (series WCSSTUS1): https://www.eia.gov/dnav/pet/hist/LeafHandler.ashx?n=PET&s=WCSSTUS1&f=W
US Department of Energy, Strategic Petroleum Reserve program and March 12, 2026 release authorization: https://www.energy.gov/ceser/strategic-petroleum-reserve
International Energy Agency, coordinated collective action, March 2026: https://www.iea.org
US Government Accountability Office, SPR reporting, June 2026: https://www.gao.gov
AAA, national average gas prices, July 17, 2026: https://gasprices.aaa.com
GasBuddy, retail fuel commentary, July 2026: https://www.gasbuddy.com
Federal Reserve, FOMC meeting calendar, June 16-17 statement and Summary of Economic Projections: https://www.federalreserve.gov/monetarypolicy/fomccalendars.htm
CME Group, FedWatch tool: https://www.cmegroup.com/markets/interest-rates/cme-fedwatch-tool.html
Philadelphia Fed, Survey of Professional Forecasters, Q2 2026: https://www.philadelphiafed.org/surveys-and-data/real-time-data-research/survey-of-professional-forecasters
Trading Economics, United States inflation rate (cross-check): https://tradingeconomics.com/united-states/inflation-cpi
US Inflation Calculator, current inflation rates table (cross-check): https://www.usinflationcalculator.com/inflation/current-inflation-rates/
CNBC, CPI-day market coverage and Fed odds reporting, July 14, 2026: https://www.cnbc.com
Reuters, oil, Hormuz and FOMC coverage, June-July 2026: https://www.reuters.com
Al Jazeera and The Washington Post, Apple and consumer electronics price increases, late June 2026: https://www.aljazeera.com and https://www.washingtonpost.com
The Wall Street Journal, memory-chip cost estimates (TechInsights), 2026: https://www.wsj.com
TrendForce, DRAM and NAND contract price data, Q1 2026: https://www.trendforce.com