

US Inflation Just Broke 4% - and the Oil Shock Behind It Is Already Reversing
June 2026 brought the hottest inflation prints in three years: CPI at 4.2%, the Fed’s gauge at 4.1%, wholesale prices at 6.5%. Almost all of it is one war and one barrel of oil!

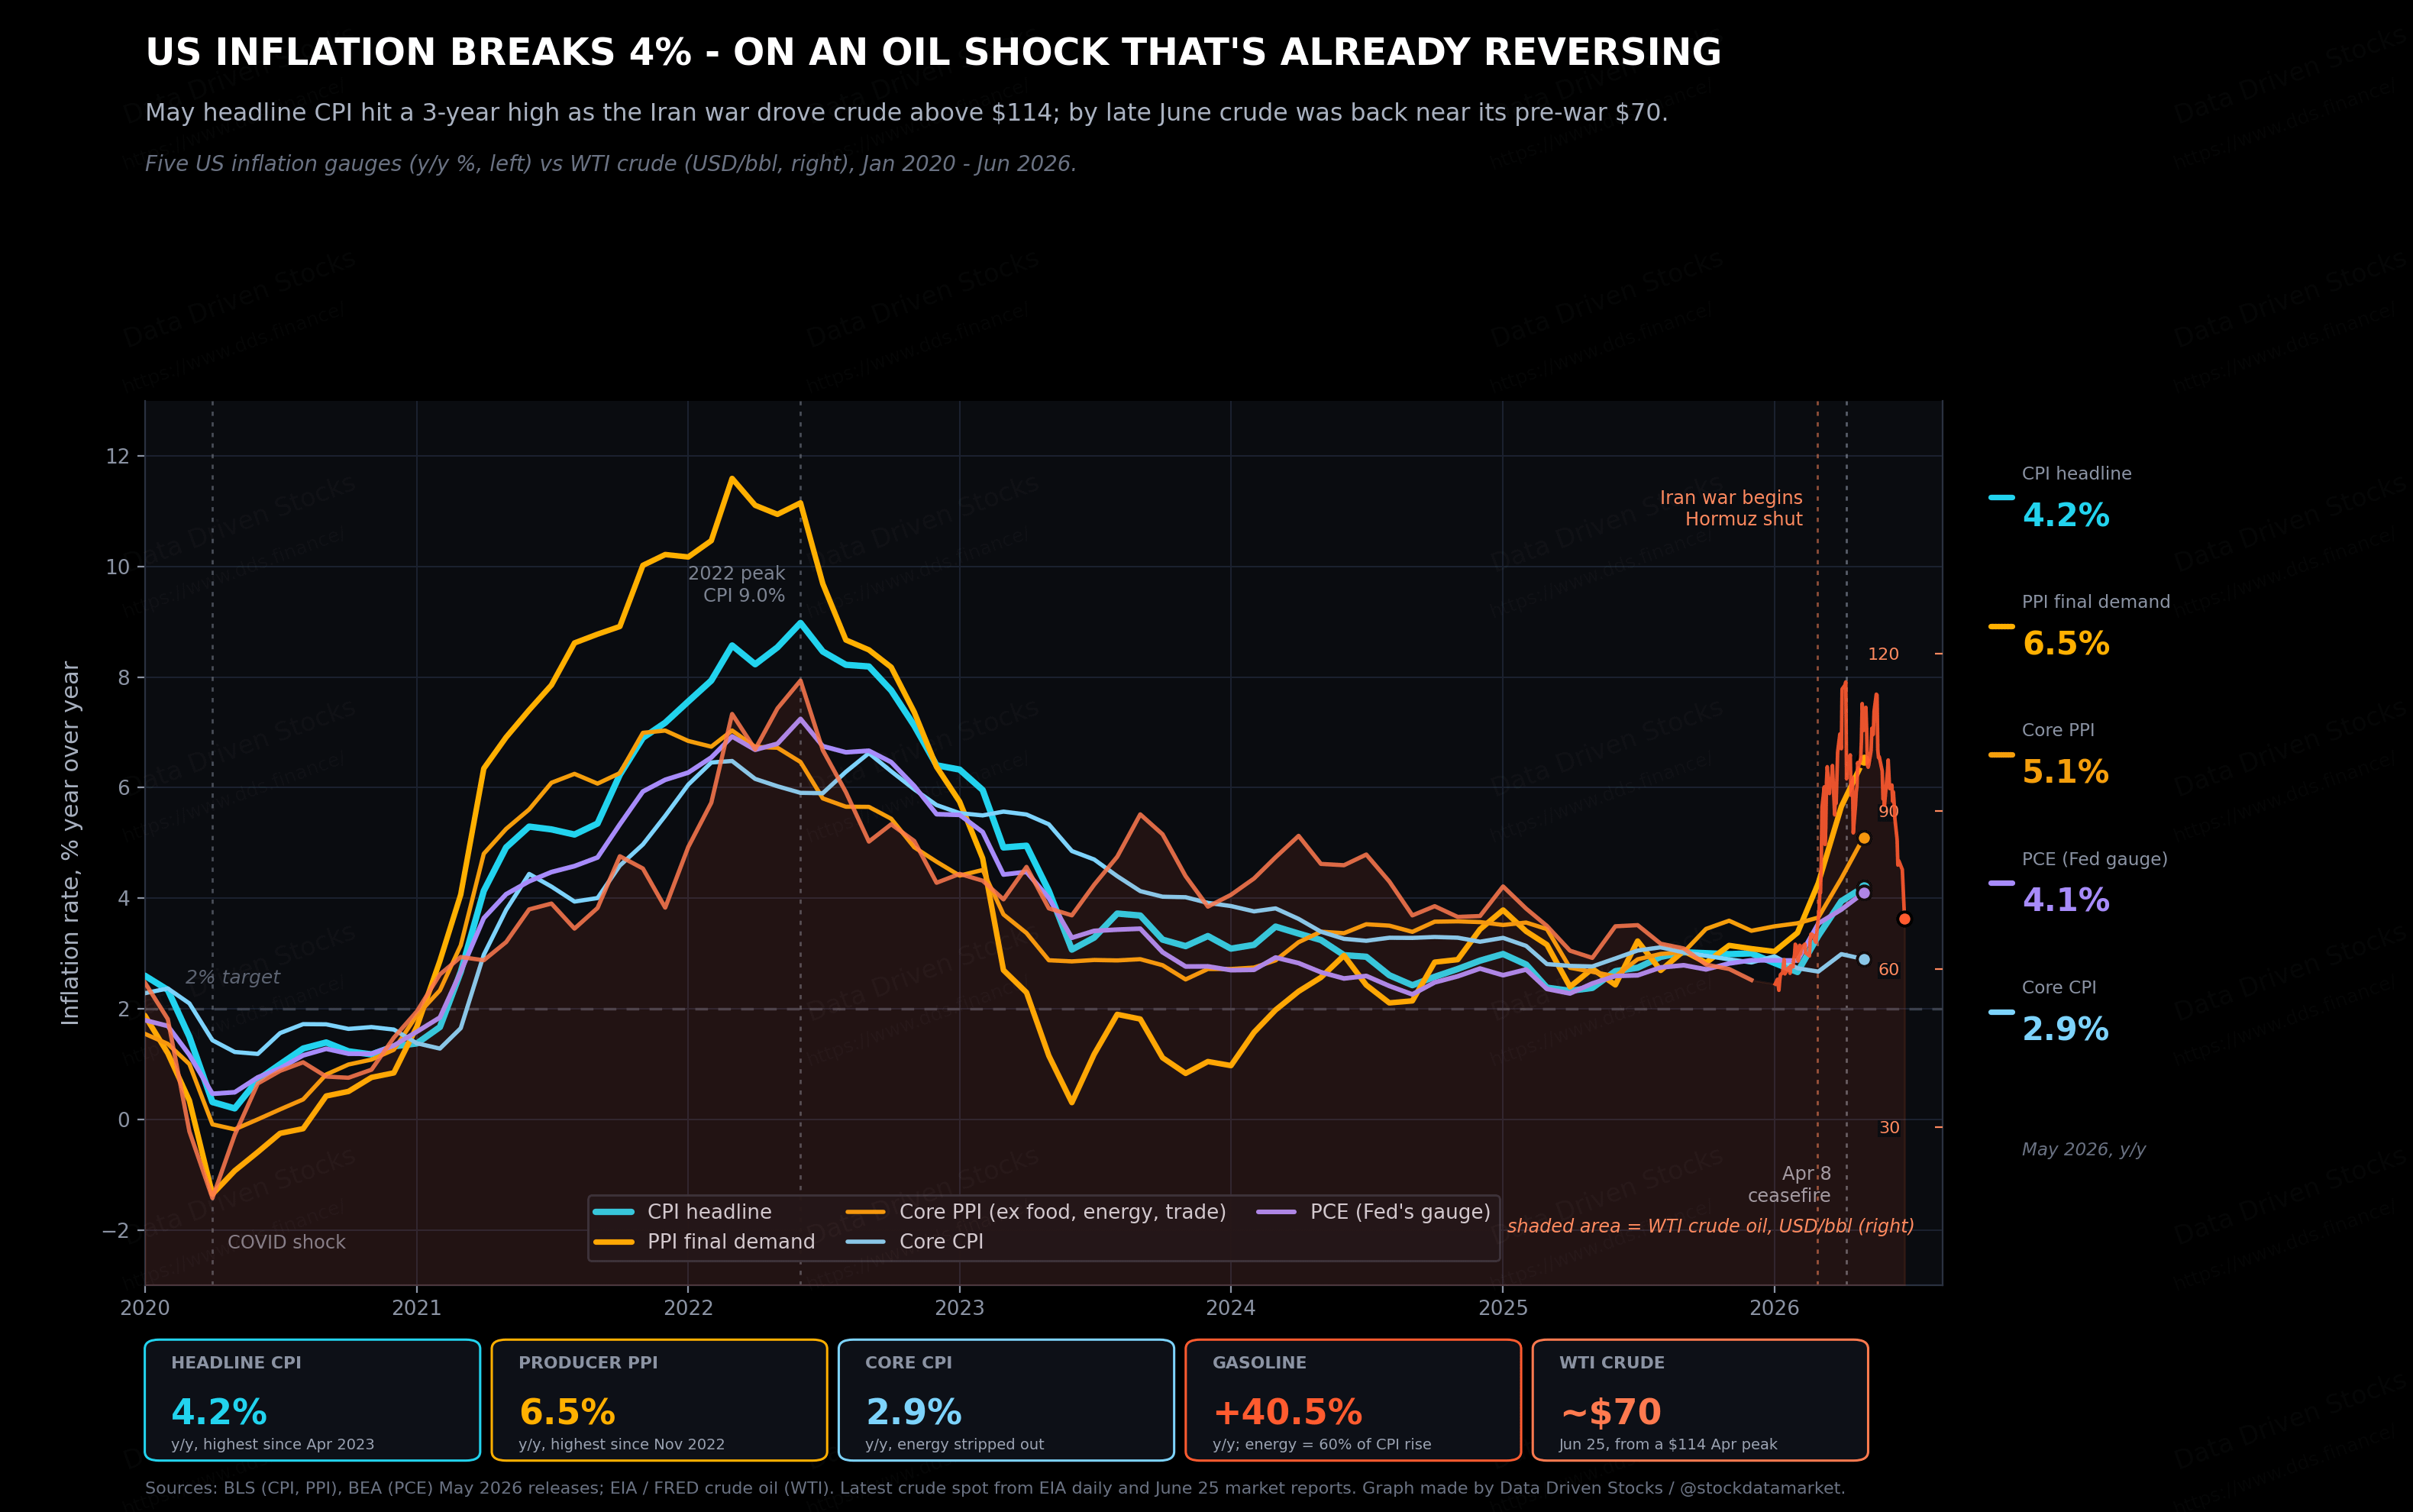
US consumer prices rose 4.2% in the year to May 2026, the fastest pace since April 2023, and the Federal Reserve’s preferred inflation gauge hit 4.1%, its fourth straight monthly acceleration.
Here is the part that matters more than the headline. This is not the broad, sticky, everything-costs-more inflation of 2022. Strip out food and energy and core CPI was just 2.9%. The whole gap between the scary 4.2% and the merely uncomfortable 2.9% is energy - and energy is here because a war shut the Strait of Hormuz in late February, sent crude past $114 a barrel, and then, over the past few weeks, let it fall almost all the way back to where it began. So the inflation you are reading about in the May data is, in large part, the delayed echo of a price spike that the market has already started to reverse.
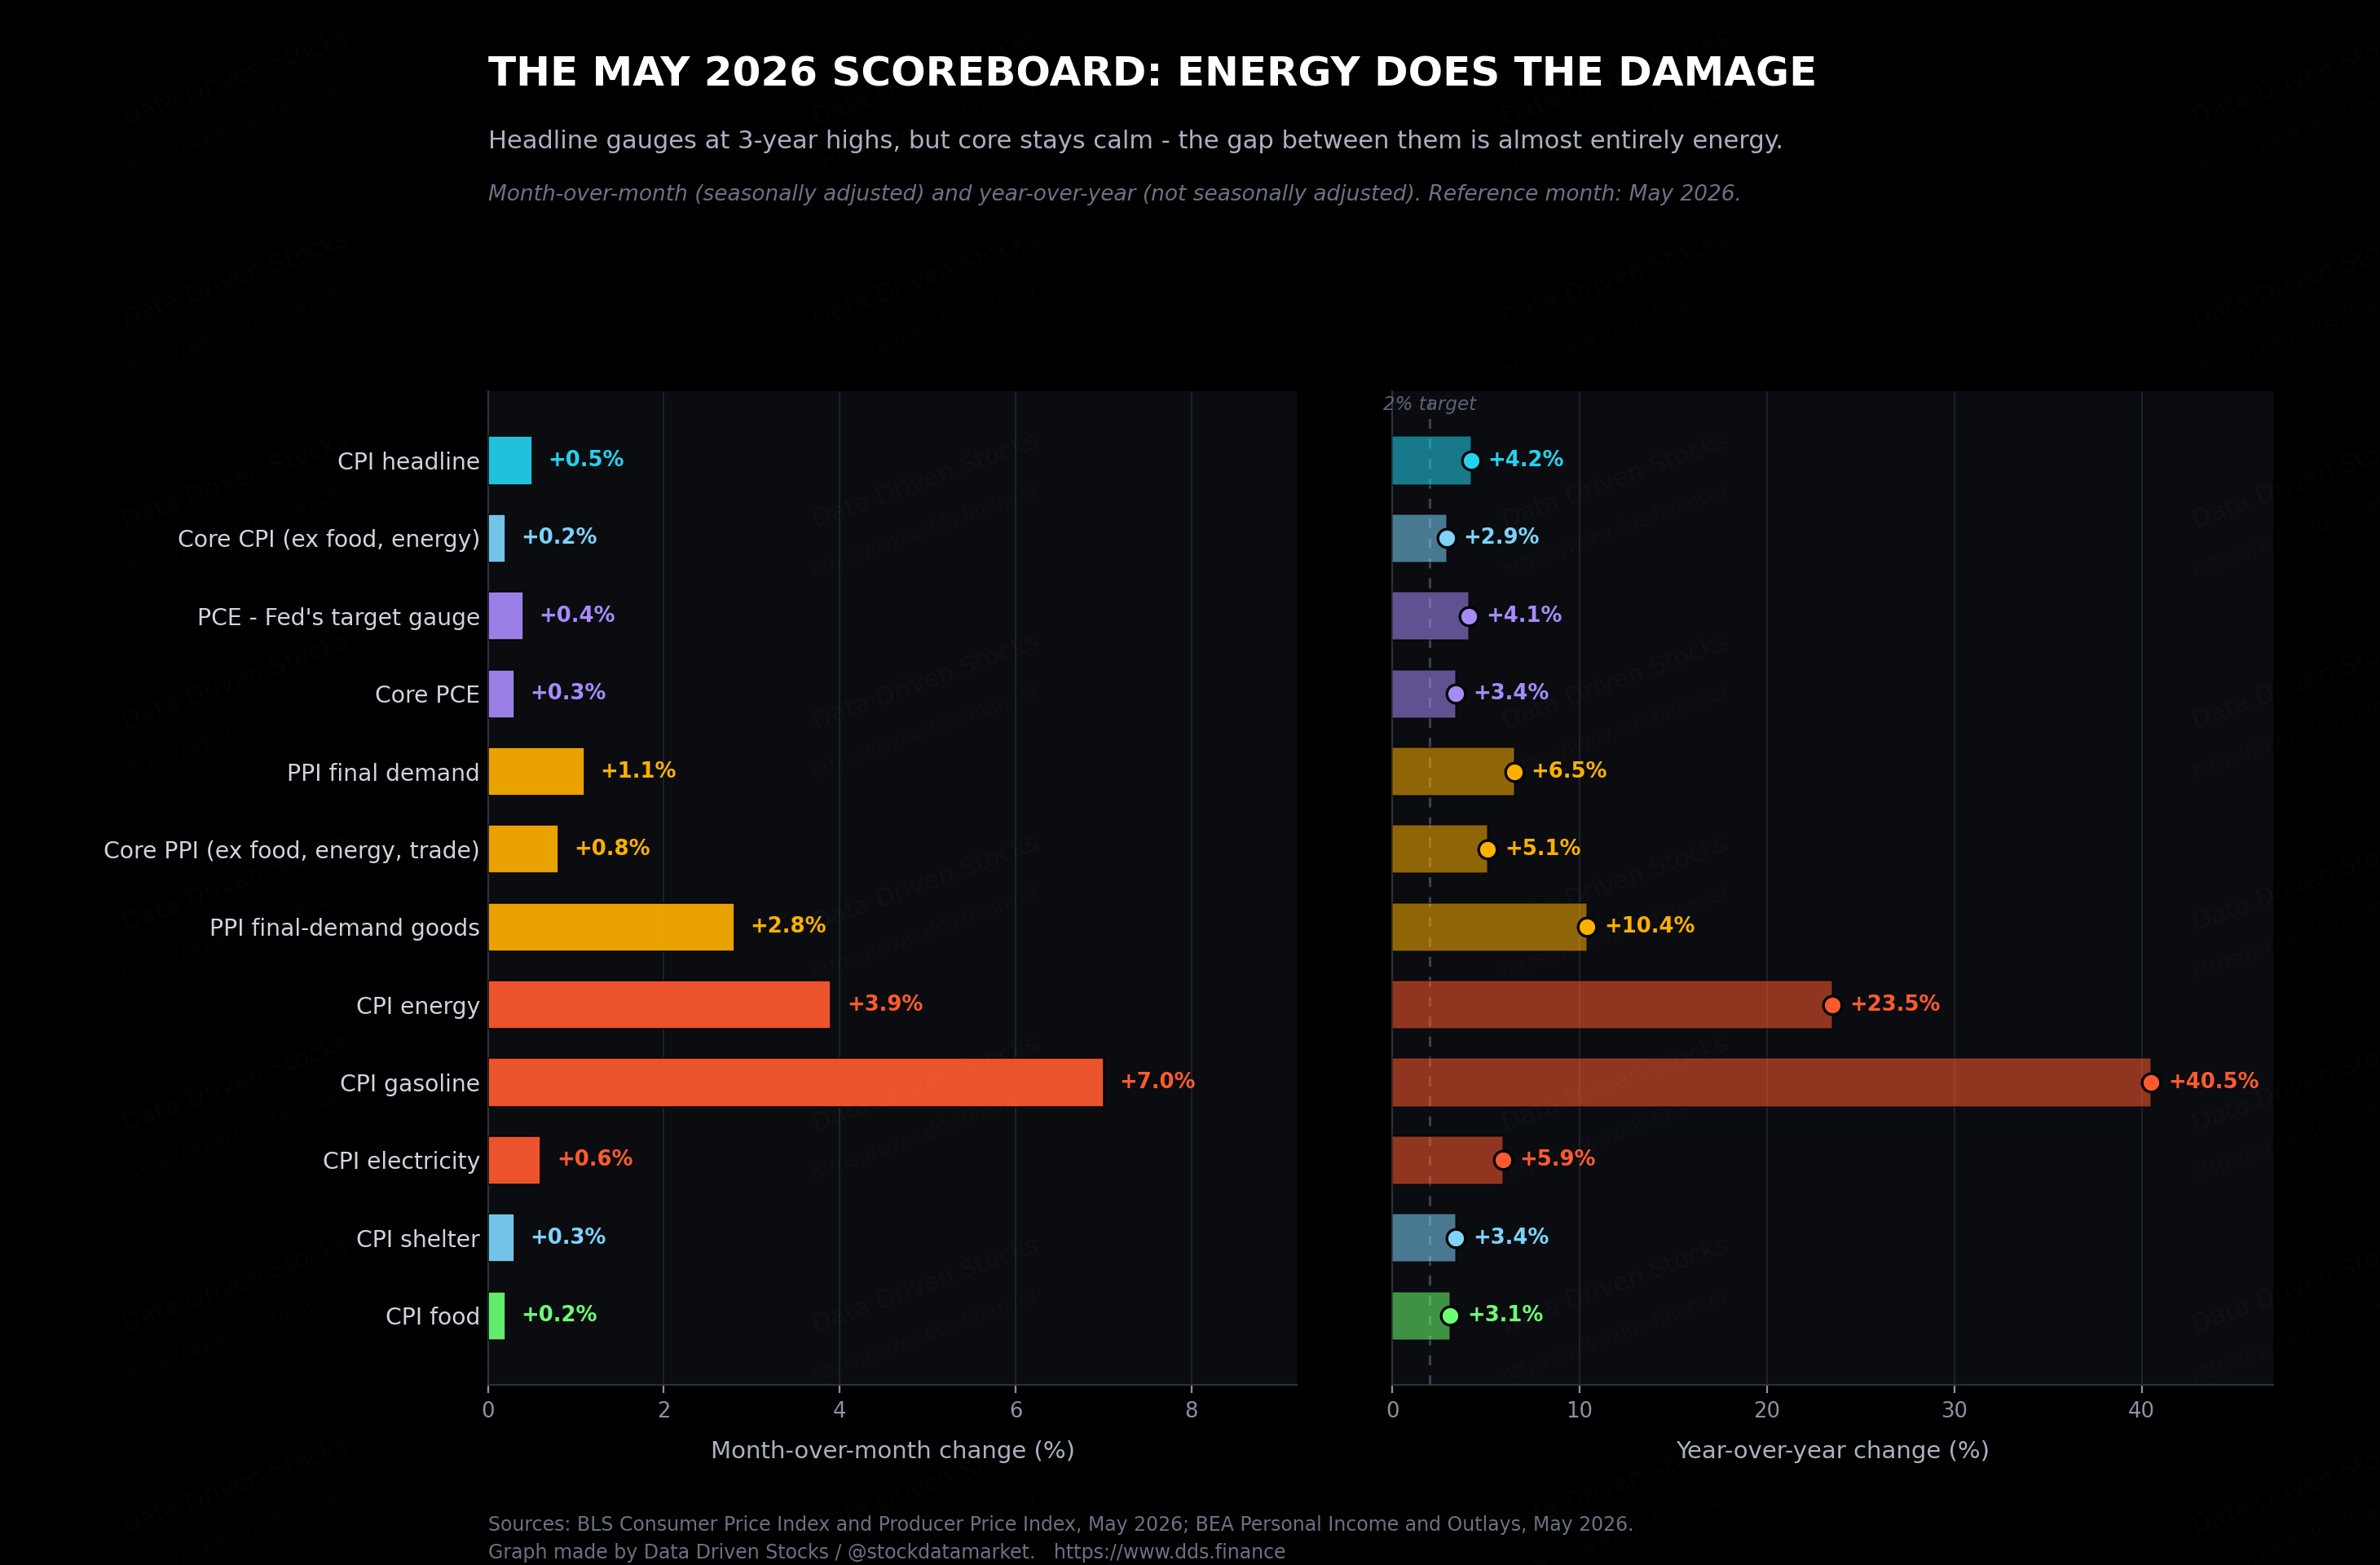
The scoreboard: energy does the damage, core stays quiet
Start with what actually printed, because the split inside the report tells you everything about what kind of inflation this is. Headline CPI rose 0.5% on the month and 4.2% over the year. Core CPI - the Fed-relevant trend gauge - rose 0.2% on the month and 2.9% over the year. The energy index jumped 3.9% in a single month and was up 23.5% from a year earlier, and the Bureau of Labor Statistics noted that energy alone accounted for more than 60% of the entire monthly increase in prices. Gasoline was up 40.5% year over year. Electricity, up 5.9%. Food, a comparatively mild 3.1%. And the most telling line of all: core goods prices actually fell 0.1% on the month, which tells you the tariff pass-through everyone spent 2025 worrying about is, for now, being drowned out by the barrel.
The Fed’s gauge told the same story a day later in a different accent. Headline PCE rose to 4.1% and core PCE to 3.4%, both the highest since April 2023. And the wholesale data underneath it was the hottest of the lot: producer prices rose 1.1% on the month and 6.5% over the year, the steepest annual climb since November 2022, with final-demand goods posting their single biggest monthly jump since that data series began back in 2009. Roughly 80% of that goods surge came from energy, and wholesale gasoline alone rose 23.4% in the month. Even the cleaner core wholesale measure, which strips out food, energy, and volatile trade margins, ran at 5.1% - a sign the cost pressure has reached deeper into the production chain than just the gas pump.
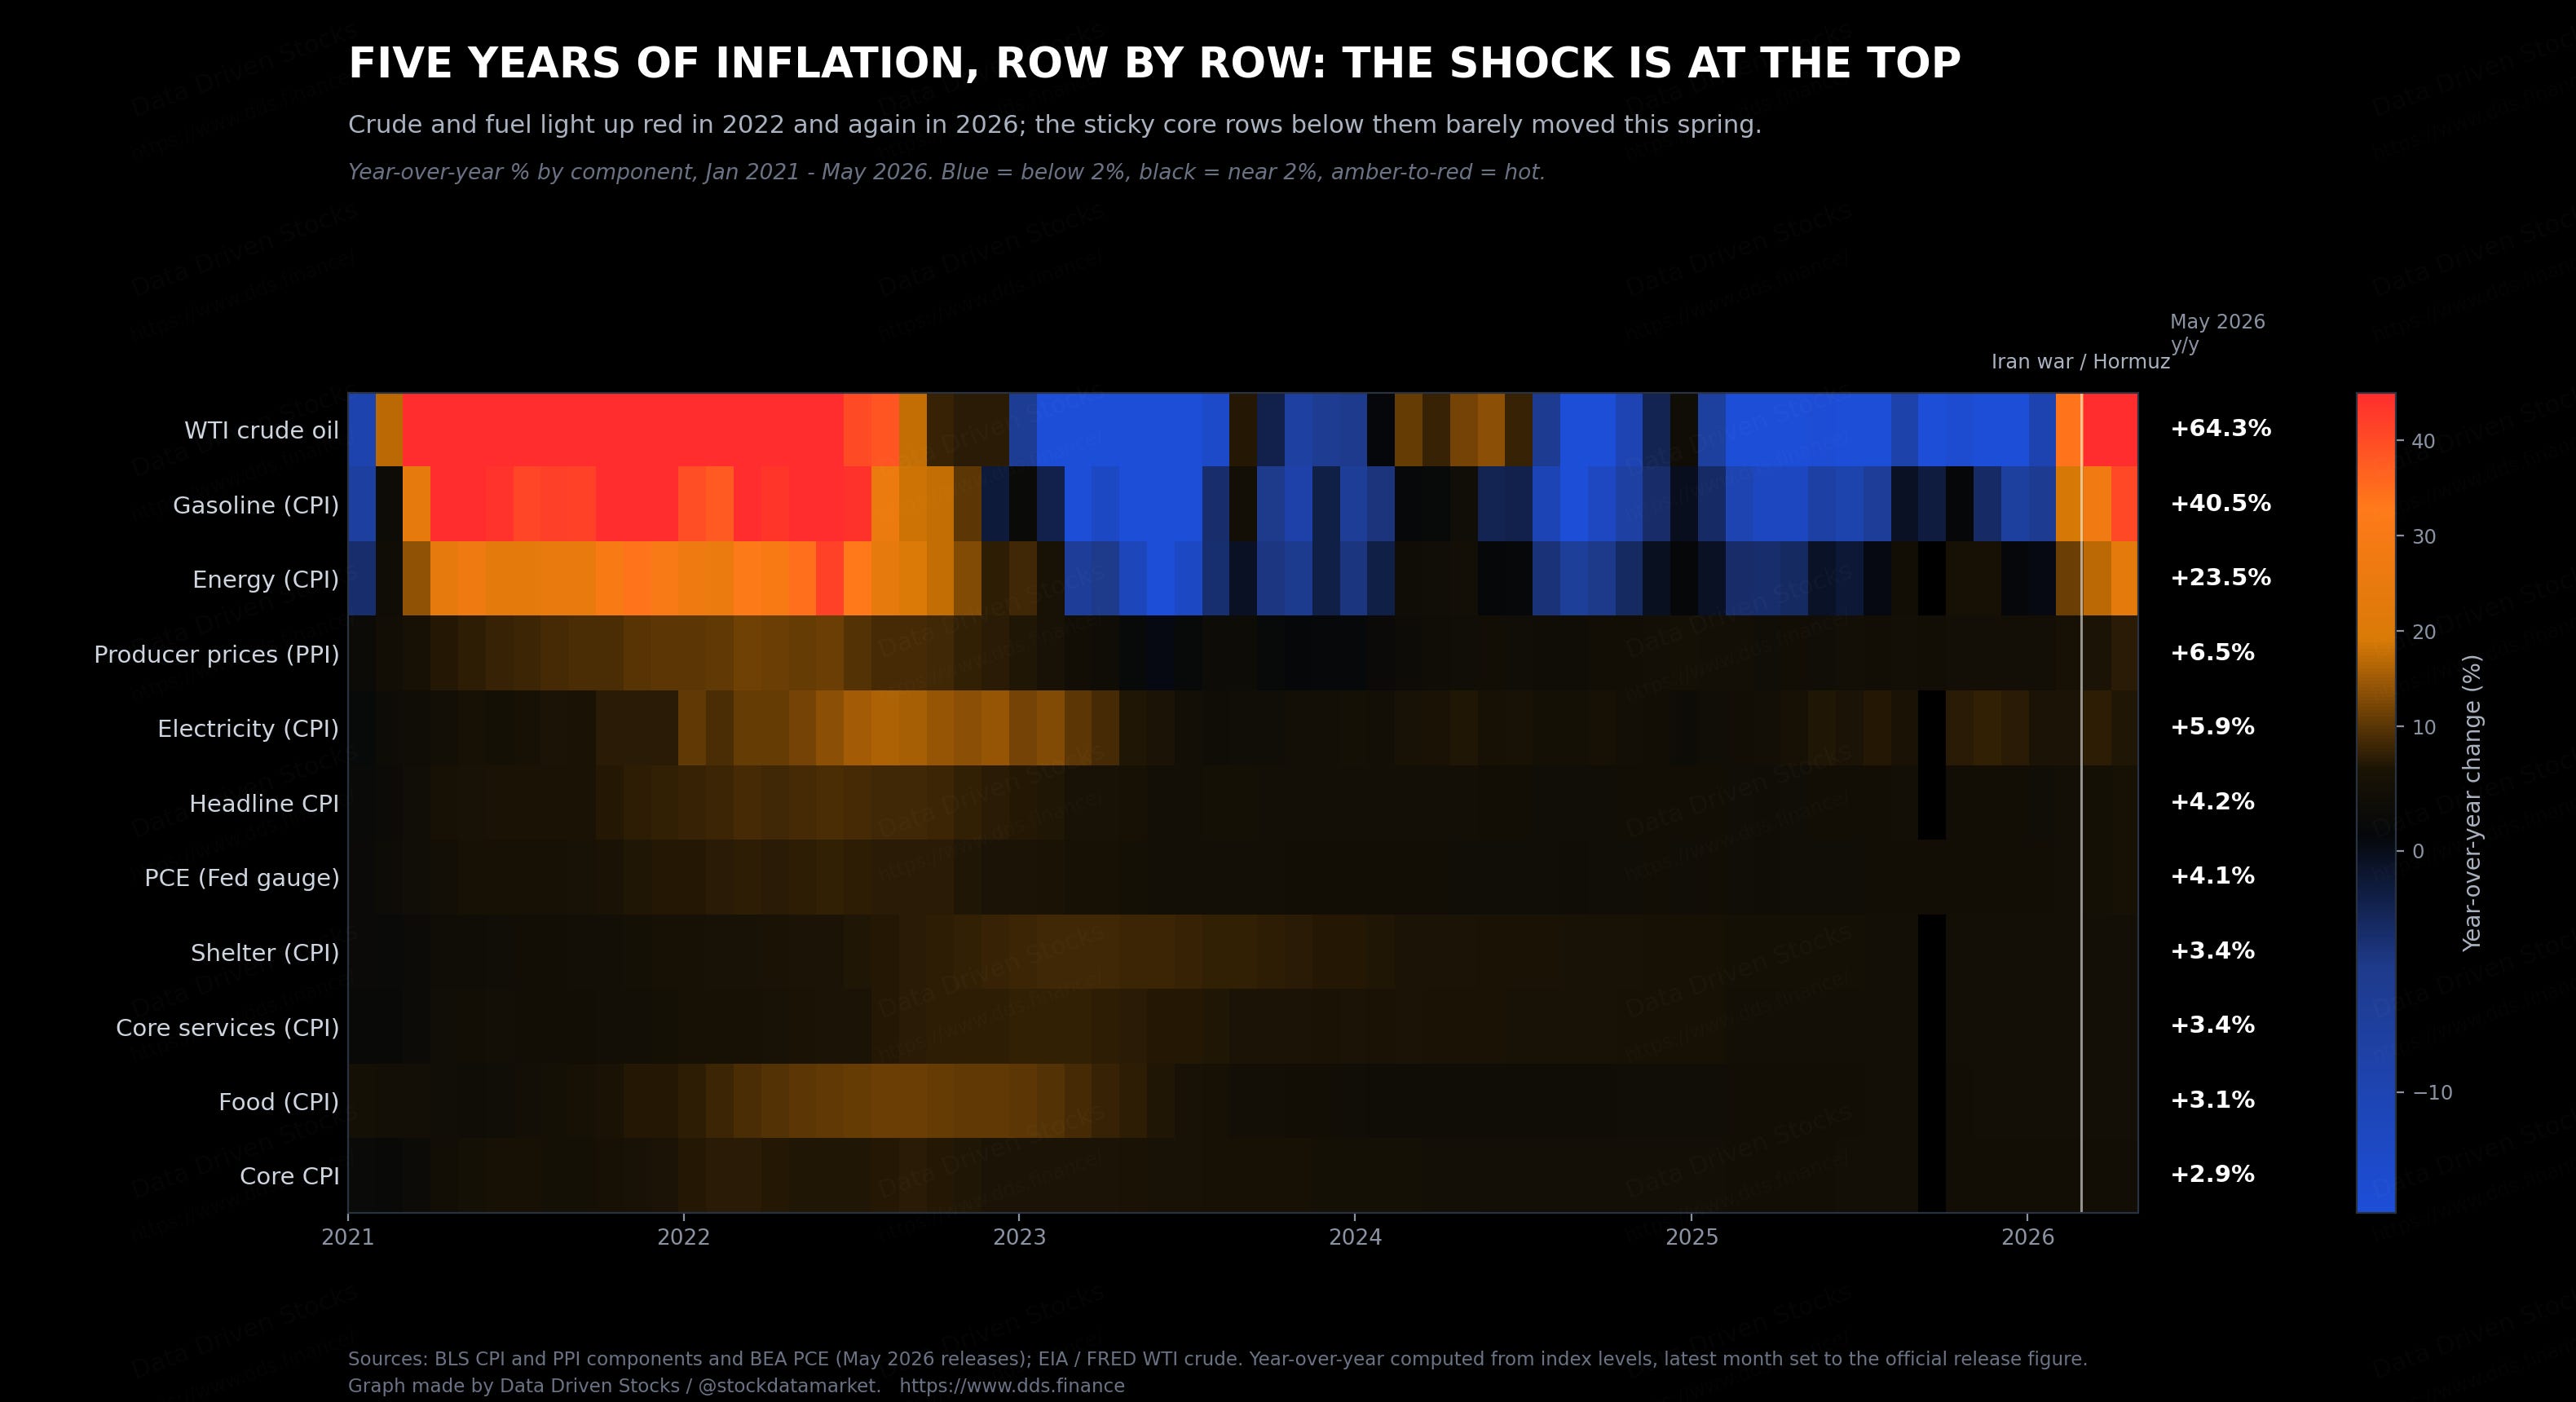
What’s actually driving this
There is a clean way to see whether an inflation episode is a broad demand problem or a narrow supply shock: line the components up and watch which ones are on fire. Do that over the last five years and the pattern is unmistakable. The crude, gasoline, and energy rows blaze red in 2022, when post-pandemic demand collided with the first Ukraine-war energy spike. Then they go cold - deep blue, meaning falling year over year - all through 2023, 2024, and 2025, the long disinflation. And then, at the very right edge of the picture, in the spring of 2026, they flash red again.
Beneath those shock rows, the sticky stuff barely moves. Shelter, which is more than a third of the CPI basket and the single most stubborn weight in it, was running at 3.4% - elevated, but actually cooler than a year ago and decelerating, with its monthly gain in May half of what it was in April. Core services, 3.4%. Core CPI, 2.9% and roughly flat. This is the signature of a supply shock parked on top of an economy that was otherwise slowly cooling, not a fresh outbreak of broad-based inflation. The barrel is loud. The rest of the basket is whispering.
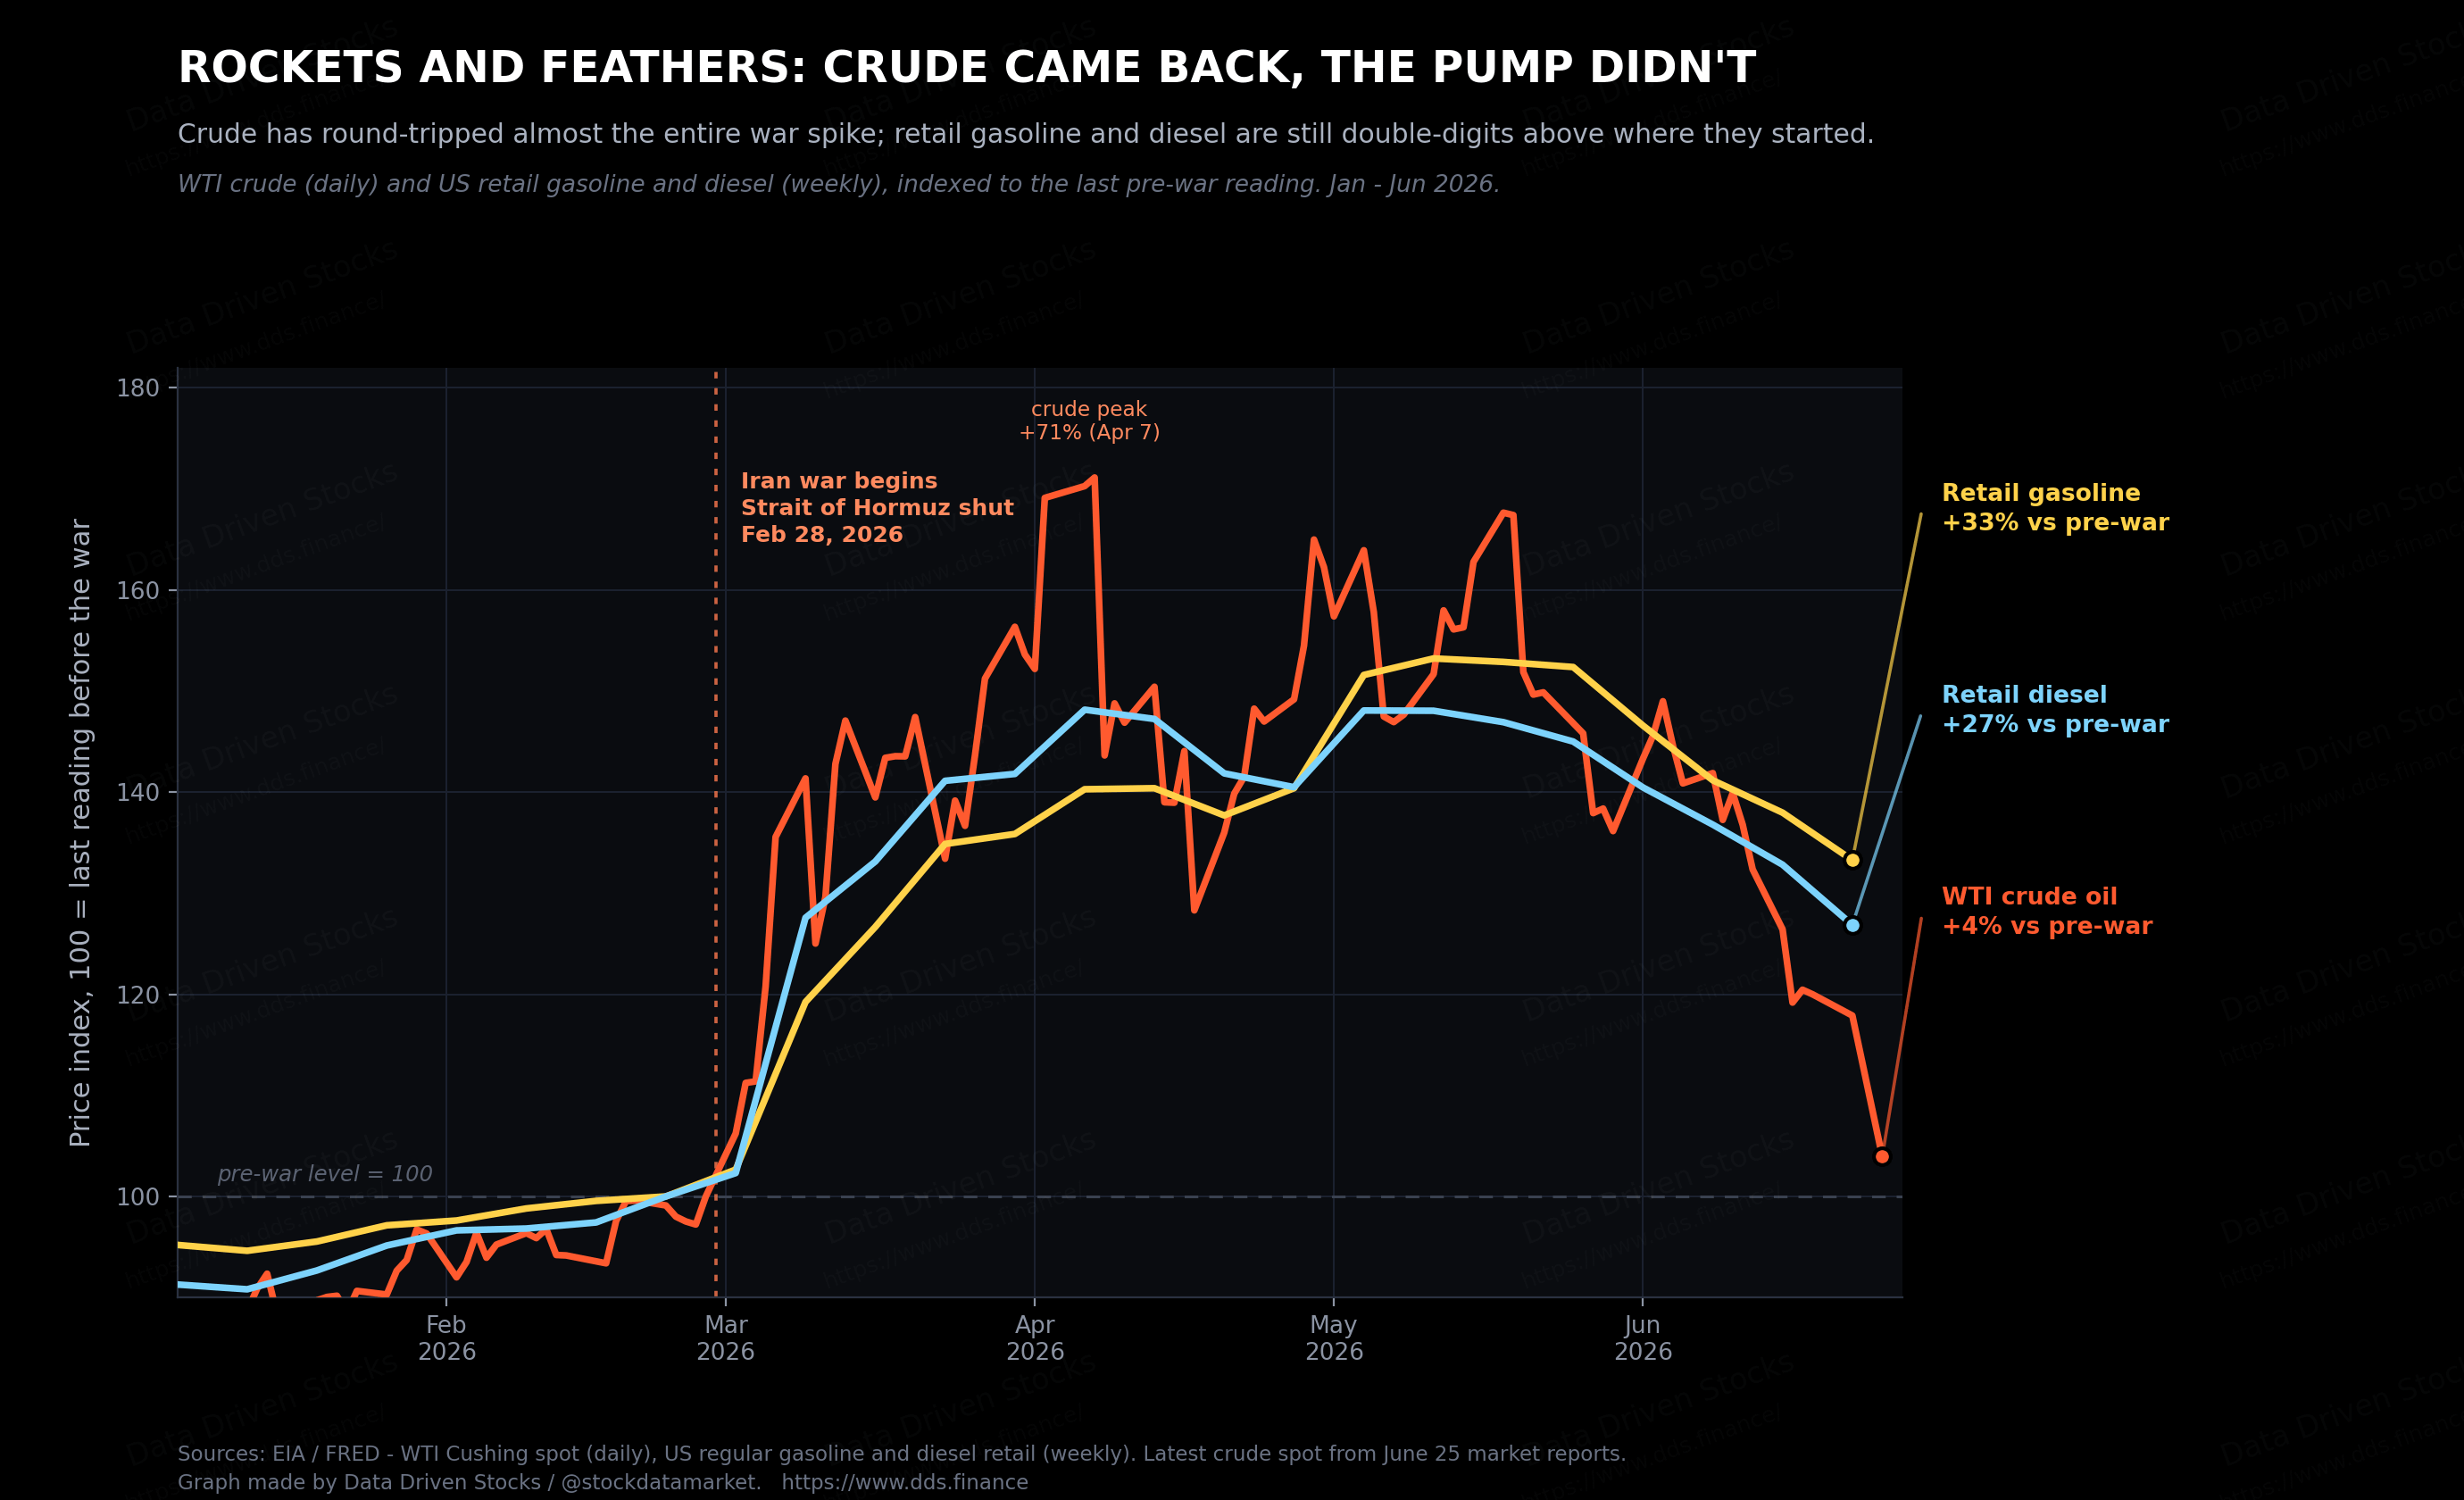
The oil shock: rockets up, feathers down
So follow the barrel, because the barrel is the whole game. The 2026 Iran war began on February 28, and within days Iran’s closure of the Strait of Hormuz had choked off the route that carries around a fifth of the world’s traded oil - what the International Energy Agency called the largest supply disruption in the history of the global oil market. WTI crude, which had been sitting near $67 before the war, ran to an intraday peak of $114.58 on April 7; Brent touched $138. American pump prices followed, climbing more than a dollar a gallon, with parts of California briefly above six.
Then came the turn. A fragile ceasefire was announced on April 8, tankers slowly began moving through Hormuz again, Gulf producers started ramping output, and by late June a 60-day memorandum of understanding had Saudi crude heading back to its export terminals for the first time since March. Crude fell, and fell hard - one of the worst months oil has had since the pandemic - until by the June 25 session WTI was back around $70, roughly its pre-war level, and traders’ attention had swung all the way around to a possible 2026 supply glut.
But here is the wrinkle that explains why the May inflation data is still so hot even though crude has round-tripped: the pump moves up like a rocket and comes down like a feather. Index everything to the last pre-war reading and the divergence is stark. Crude is now only about 4% above where it started. But retail gasoline, which peaked weeks after crude did - in the middle of May - is still up around a third from its pre-war level, and diesel is still up more than a quarter. Refineries took damage in the war, inventories were drawn down hard (crude stocks at the Cushing hub fell below operational minimums).
A quick history, because the rate falling never gave anything back
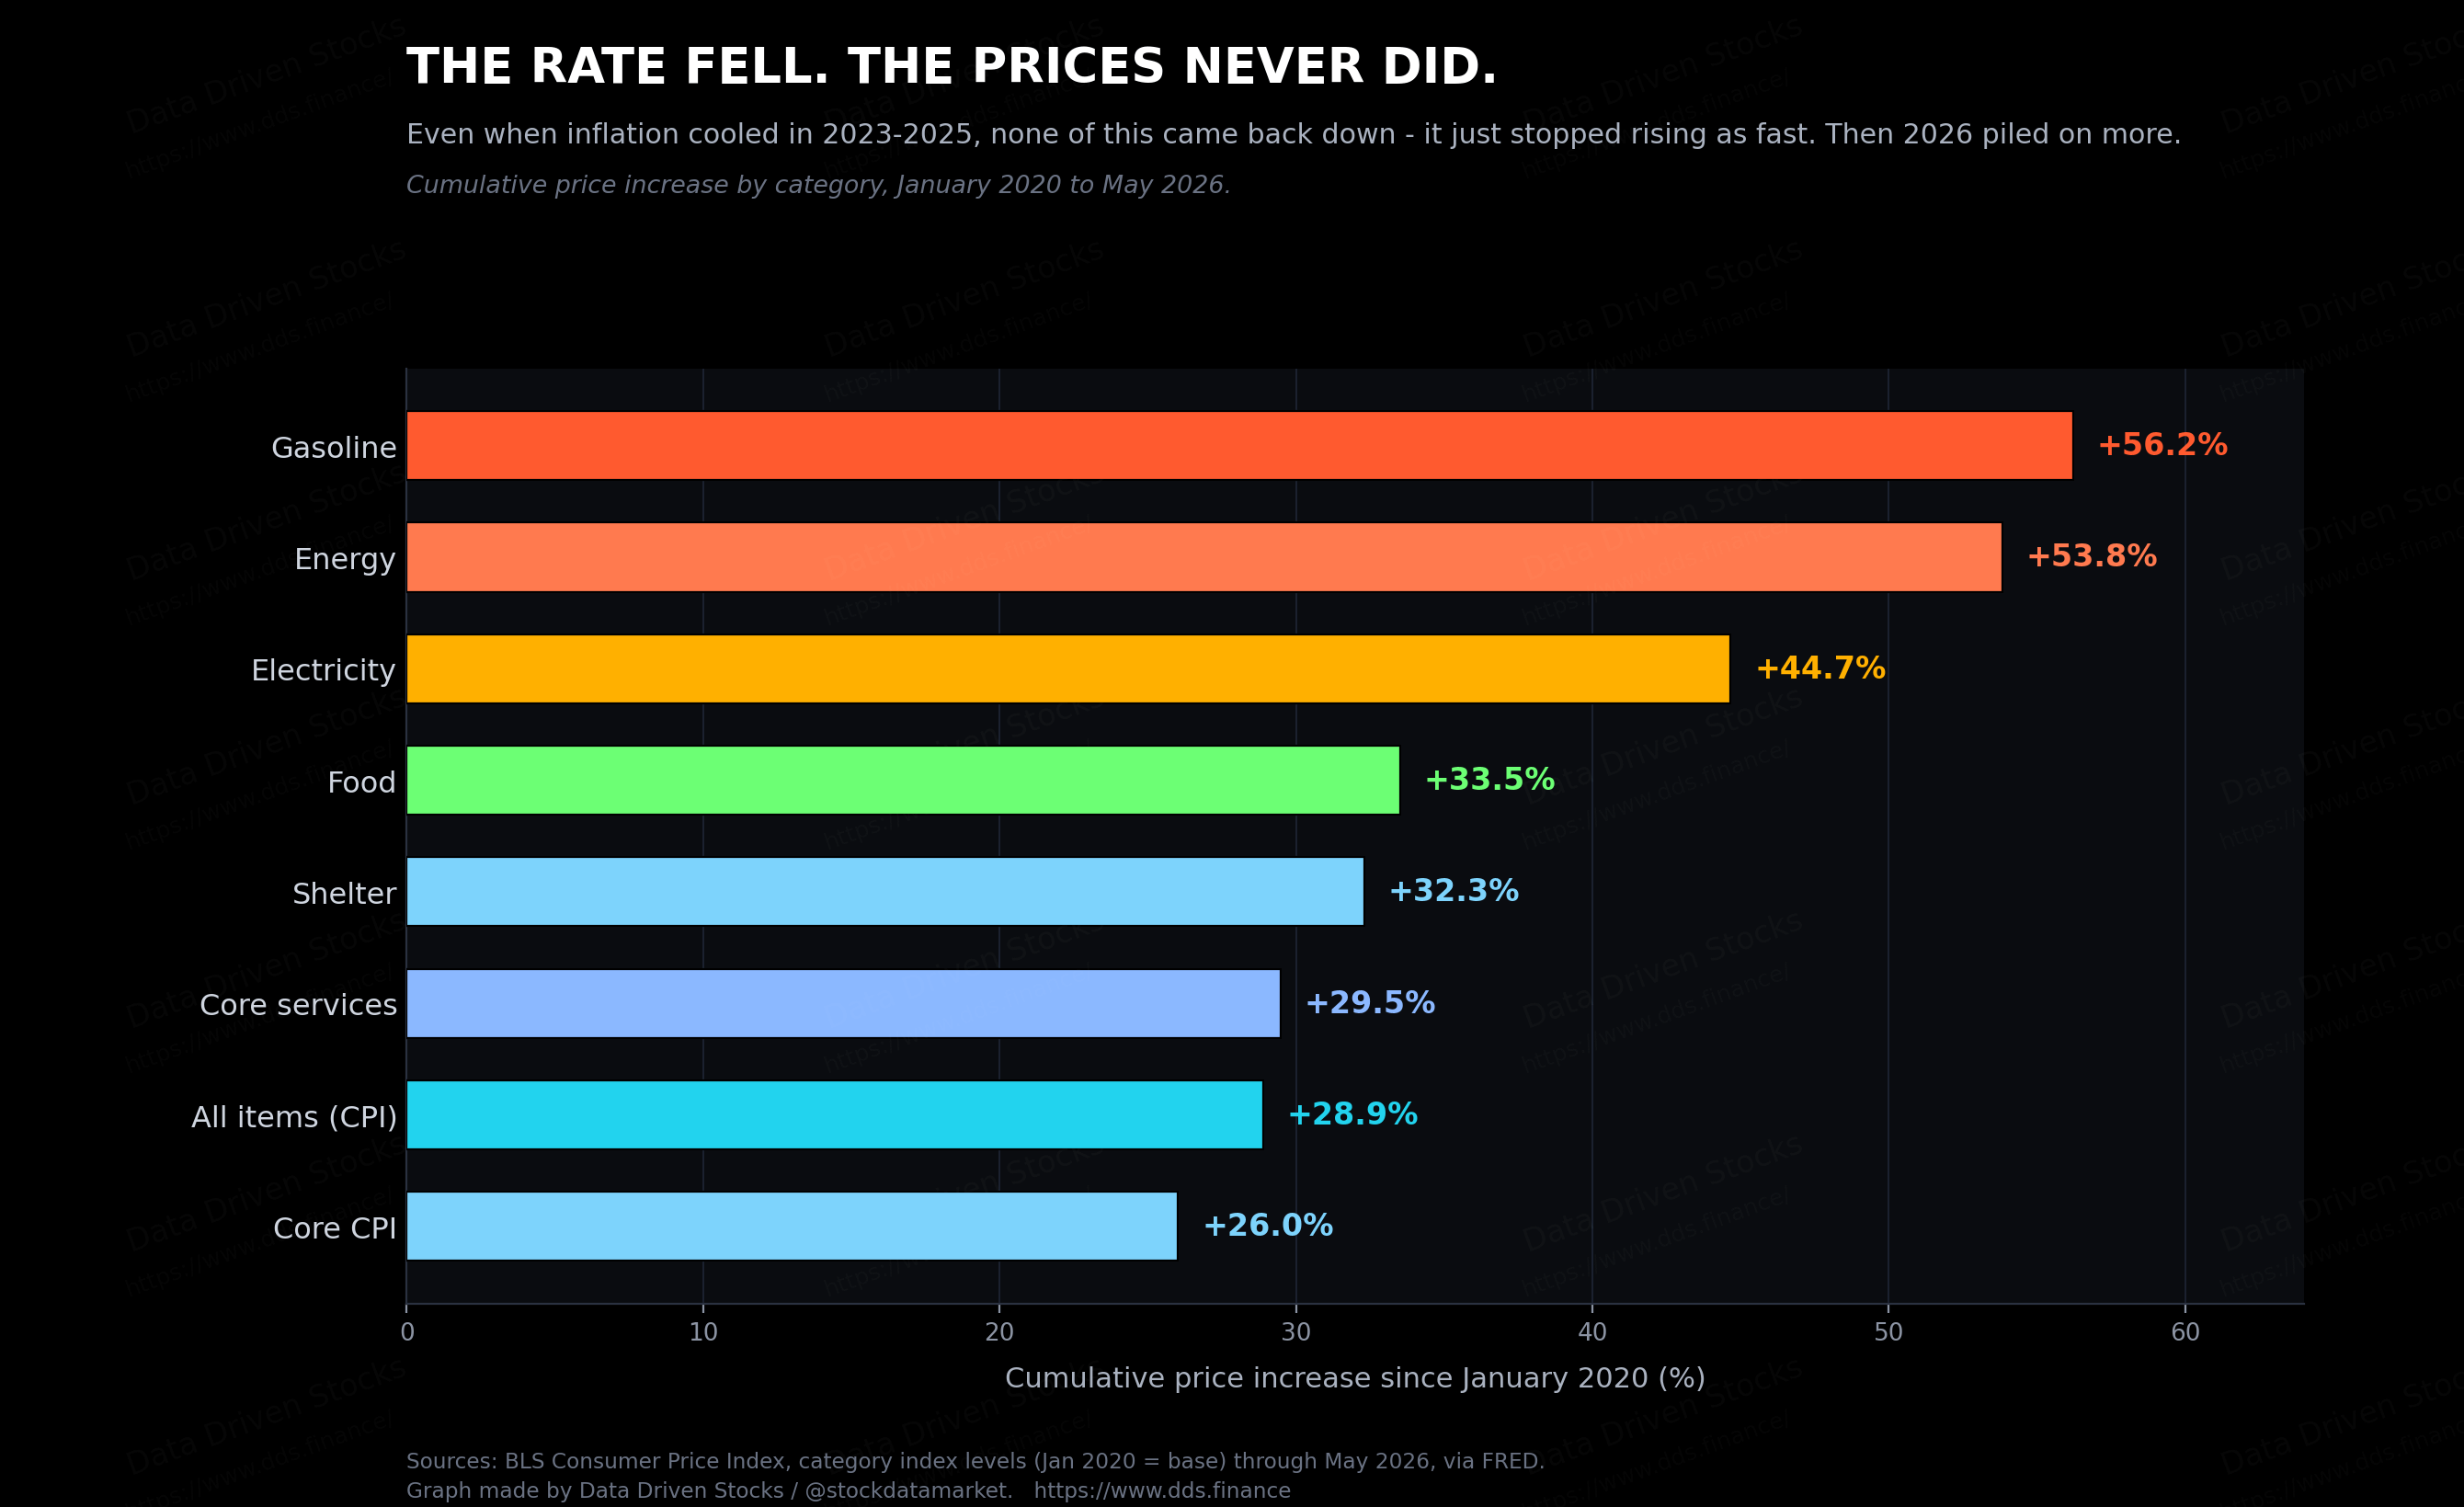
It is worth pausing on a point that gets lost every time the conversation turns to whether inflation is “coming down.” When economists and headlines say inflation is falling, they mean the rate of increase is slowing. They do not mean prices are falling. Prices almost never fall. What happened across 2023 to 2025 was disinflation - the annual rate dropped from 9% toward 3% - but the price level just kept grinding higher the whole time, only more slowly.
Stack it up since January 2020 and the scale of it is sobering. The overall consumer basket is up nearly 29%. Gasoline is up 56%, energy 54%, electricity 45%, food 34%, shelter 32%. Core CPI, the supposedly calm measure, is up 26%. None of that came back when inflation “cooled.” It just stopped climbing as fast - and then 2026 piled another energy shock on top of an already much higher base. This is why the politics of inflation are so much angrier than the year-over-year rate suggests: households are not comparing today to a year ago, they are comparing today to 2019, and on that scale nothing has been given back.
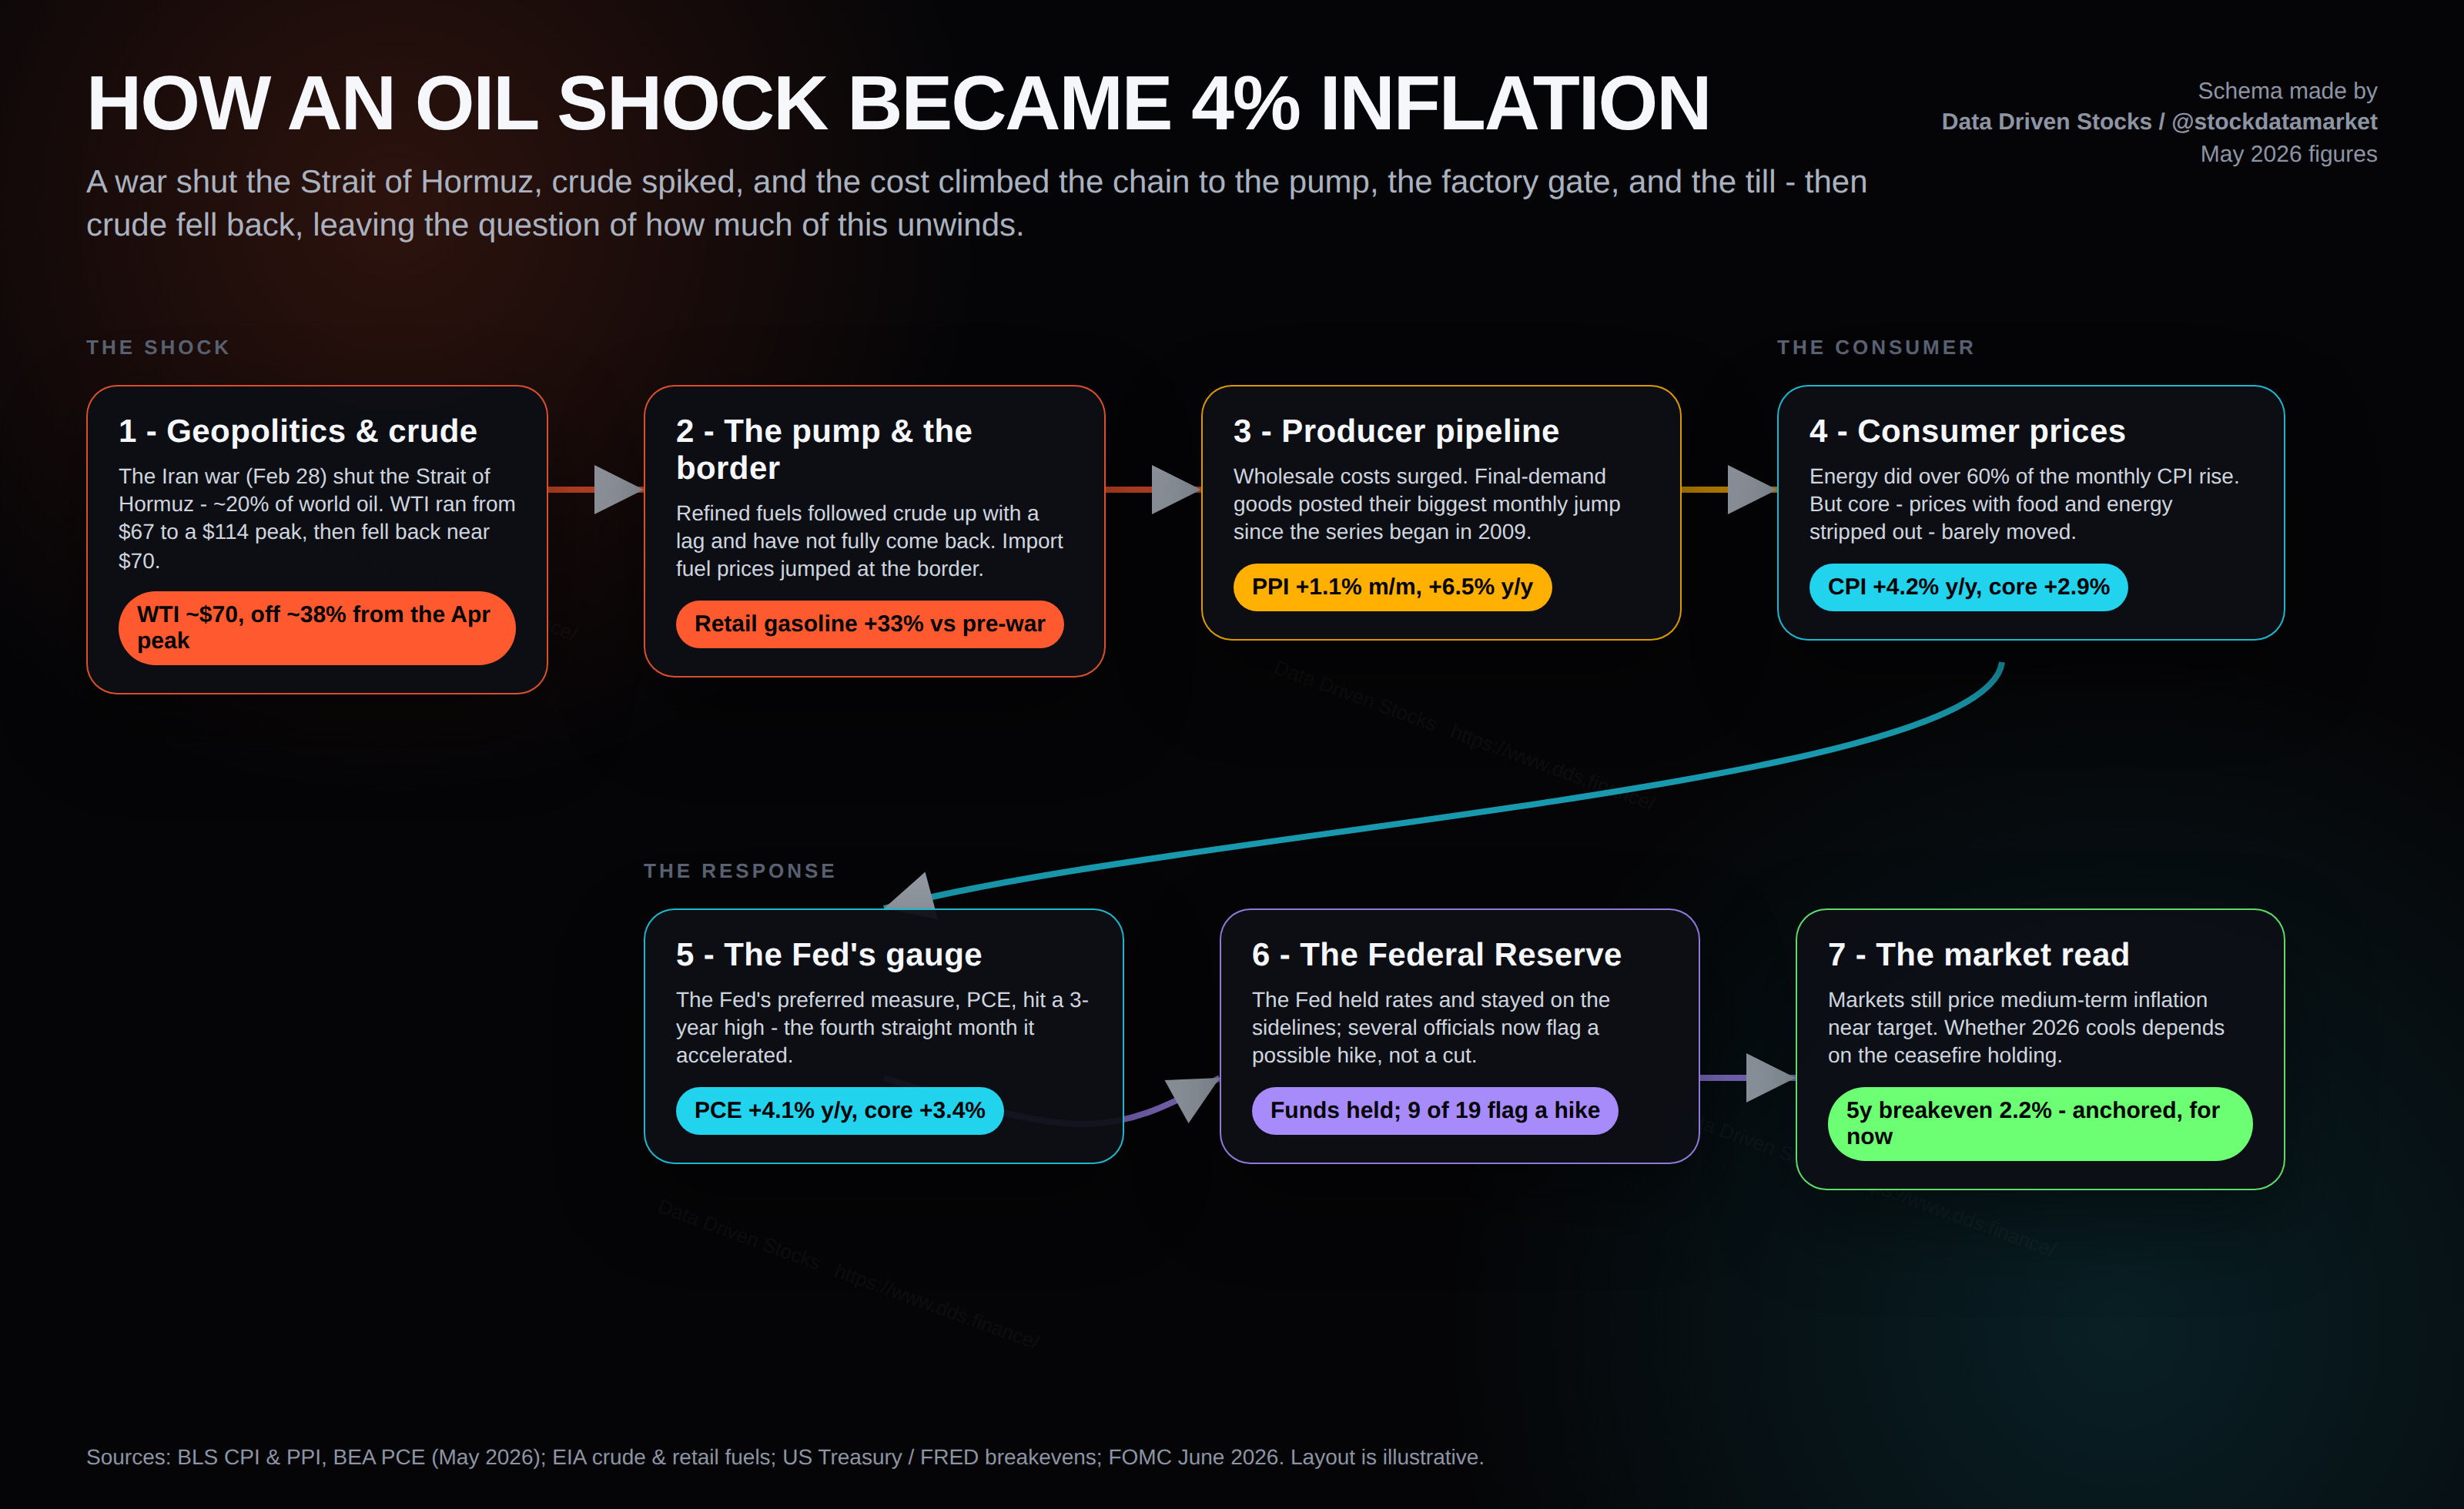
How the whole thing connects
If you want the entire mechanism on one page, it runs like a relay. Geopolitics shuts a shipping lane, which spikes crude, which raises the price of fuel at the pump and at the border, which lifts producer costs at the factory gate, which finally shows up at the till as consumer inflation - and then lands on the Fed’s desk and in the bond market’s pricing. Each handoff in that chain has a verified number on it right now, and laying them side by side makes clear why headline ran so far ahead of core: the shock entered through energy and is still mostly sitting in energy, with only a modest bleed into the rest.
The Fed: stuck between a shock it can’t fix and an expectation it can’t ignore
A central bank cannot drill oil or reopen a strait. An energy supply shock is exactly the kind of inflation monetary policy is worst at treating, because raising rates does nothing to add a barrel to the market - it only cools demand that, in this case, was already softening. So the Fed has done the only sensible thing and sat still, holding its policy rate at the June 17 meeting and signalling patience.
What has changed is the tone. Where the debate a year ago was about how many rate cuts 2026 would bring, several officials on the committee now flag a possible rate hike in their latest projections, and futures markets have swung to pricing essentially no cuts this year, with the next move - if there is one - potentially being up rather than down. The reason is not core inflation, which is behaving. It is the fear that a long enough stretch of 4% headline prints starts to unanchor what households and businesses expect, and expectations have a way of becoming self-fulfilling.
That fear is where the data gets genuinely interesting, because it splits in two. The market does not believe in an inflation problem: on June 25 the five-year and ten-year breakeven rates (those are not bond yields, but breakeven rates) - what bond investors are effectively pricing for future inflation - sat at 2.23% and 2.21%, both within a whisker of the 2% target. Households, living the price increases directly, are a different story. The University of Michigan’s one-year inflation expectation was 4.6% in June, and while that is down from May’s spike, it is still far above the 3.4% it read in February before the war began. The New York Fed’s survey had households at 3.5% one year out. The gap between a bond market that sees this blowing over and households that are living it is the single most important tension in the whole picture - and it is, in the end, a bet on whether the ceasefire holds.
Where this goes: the next few months decide it
Forecasting inflation right now is really forecasting one thing - oil - and oil is really forecasting one thing, which is whether a 60-day truce signed under threat actually sticks. So rather than pretend to a single point forecast, it is more honest to lay out the paths and be explicit about what each one assumes.
The baseline, anchored to where the Philadelphia Fed’s panel of professional forecasters sees things, assumes the ceasefire holds and crude stays near $70. In that world the energy base effect does the heavy lifting: as this year’s spiked energy prices start being compared against last year’s already-high readings, the year-over-year energy contribution fades fast, and headline CPI drifts back toward 3% by the end of 2026 and lower into 2027, with the forecasting panel pencilling in roughly 3.5% for the fourth quarter of this year and a long-run rate back near the 2% target. The sticky case assumes the truce breaks, Hormuz closes again, and crude re-spikes - in which case headline simply stays stuck above 4% and the conversation turns to rate hikes. The cool-down case assumes energy unwinds even faster than the base effect alone implies, dragging headline toward the low 2s by early 2027. These are illustrative scenarios built on stated assumptions, not predictions and not investment advice - but they bracket the real risk, and the thing to notice is that two of the three paths bend down, and the one that does not is entirely about the strait.
Also oil futures may simply prince-in a delusional future that does not exist. So the oil futures may be simply wrong.
The bottom line
The honest read of May 2026 is that both halves of the story are true at once, and you have to hold them together. Inflation really did break 4% for the first time in three years, the producer pipeline is genuinely hot, and households are right to feel that prices - measured against where they were before the pandemic - have run away and never come back.
The core questions are:
Are the oil futures pricing something real, or it’s a delusional wish thinking ?
Is the Strait of Hormuz going to be open, or it will be in the status quo for months or years ?
How much of oil will transfer into the actual inflation in the future?
Sources
U.S. Bureau of Labor Statistics, Consumer Price Index - May 2026 (released June 10, 2026): https://www.bls.gov/news.release/archives/cpi_06102026.htm and CPI home: https://www.bls.gov/cpi/
U.S. Bureau of Labor Statistics, Producer Price Index - May 2026 (released June 11, 2026): https://www.bls.gov/news.release/pdf/ppi.pdf and “Producer Price Index up 6.5 percent over year ending May 2026”: https://www.bls.gov/opub/ted/2026/producer-price-index-up-6-5-percent-over-year-ending-may-2026.htm
U.S. Bureau of Economic Analysis, Personal Income and Outlays, May 2026 (released June 25, 2026): https://www.bea.gov/news/2026/personal-income-and-outlays-may-2026
U.S. Bureau of Economic Analysis, GDP (Third Estimate), 1st Quarter 2026 (released June 25, 2026): https://www.bea.gov/news/2026/gdp-third-estimate-industries-corporate-profits-state-gdp-and-state-personal-income-1st
Federal Reserve Bank of St. Louis (FRED), price and energy series: CPIAUCSL, CPILFESL, PPIFIS, WPSFD49116, PCEPI, PCEPILFE, CPIENGSL, CUSR0000SETB01, CUSR0000SAH1, MCOILWTICO, DCOILWTICO, DCOILBRENTEU, GASREGW, GASDESW, T5YIE, T10YIE: https://fred.stlouisfed.org/
U.S. Energy Information Administration, petroleum spot prices and weekly retail fuel prices: https://www.eia.gov/petroleum/
CNBC, “CPI inflation report May 2026”: https://www.cnbc.com/2026/06/10/cpi-inflation-report-may-2026.html and “Producer price index May 2026”: https://www.cnbc.com/2026/06/11/producer-price-index-may-2026-.html
CNBC, oil market coverage, June 2026: https://www.cnbc.com/2026/06/19/oil-prices-wti-brent-crude-us-iran-deal-strait-hormuz-shipping-recovery.html and https://www.cnbc.com/2026/06/22/oil-prices-wti-brent-crude-trump-iran-threat-strait-hormuz-closure.html
Al Jazeera, “Oil prices back to pre-war levels on rising Middle East supply” (June 25, 2026): https://www.aljazeera.com/news/2026/6/25/oil-prices-back-to-pre-war-levels-on-rising-middle-east-supply
University of Michigan, Surveys of Consumers, June 2026: https://www.sca.isr.umich.edu/ ; Michigan inflation expectations via Trading Economics: https://tradingeconomics.com/united-states/michigan-inflation-expectations
Federal Reserve Bank of New York, Survey of Consumer Expectations, May 2026 (released June 8, 2026): https://www.newyorkfed.org/newsevents/news/research/2026/20260608
Federal Reserve Bank of Philadelphia, Second Quarter 2026 Survey of Professional Forecasters: https://www.philadelphiafed.org/surveys-and-data/real-time-data-research/spf-q2-2026
Federal Reserve Bank of Cleveland, Inflation Nowcasting: https://www.clevelandfed.org/indicators-and-data/inflation-nowcasting
Trading Economics, US producer prices and Brent crude reference data: https://tradingeconomics.com/united-states/producer-prices-change and https://tradingeconomics.com/commodity/brent-crude-oil
“2026 Iran war fuel crisis,” background on the Strait of Hormuz disruption and IEA characterization: https://en.wikipedia.org/wiki/2026_Iran_war_fuel_crisis