US Inflation Just Broke 4% - and the Oil Price Is Falling on a Ceasefire That Hasn’t Been Signed
The May 2026 CPI and PPI reports, the Hormuz oil shock, the 23-year-low inventories underneath it, and where prices actually go from here.
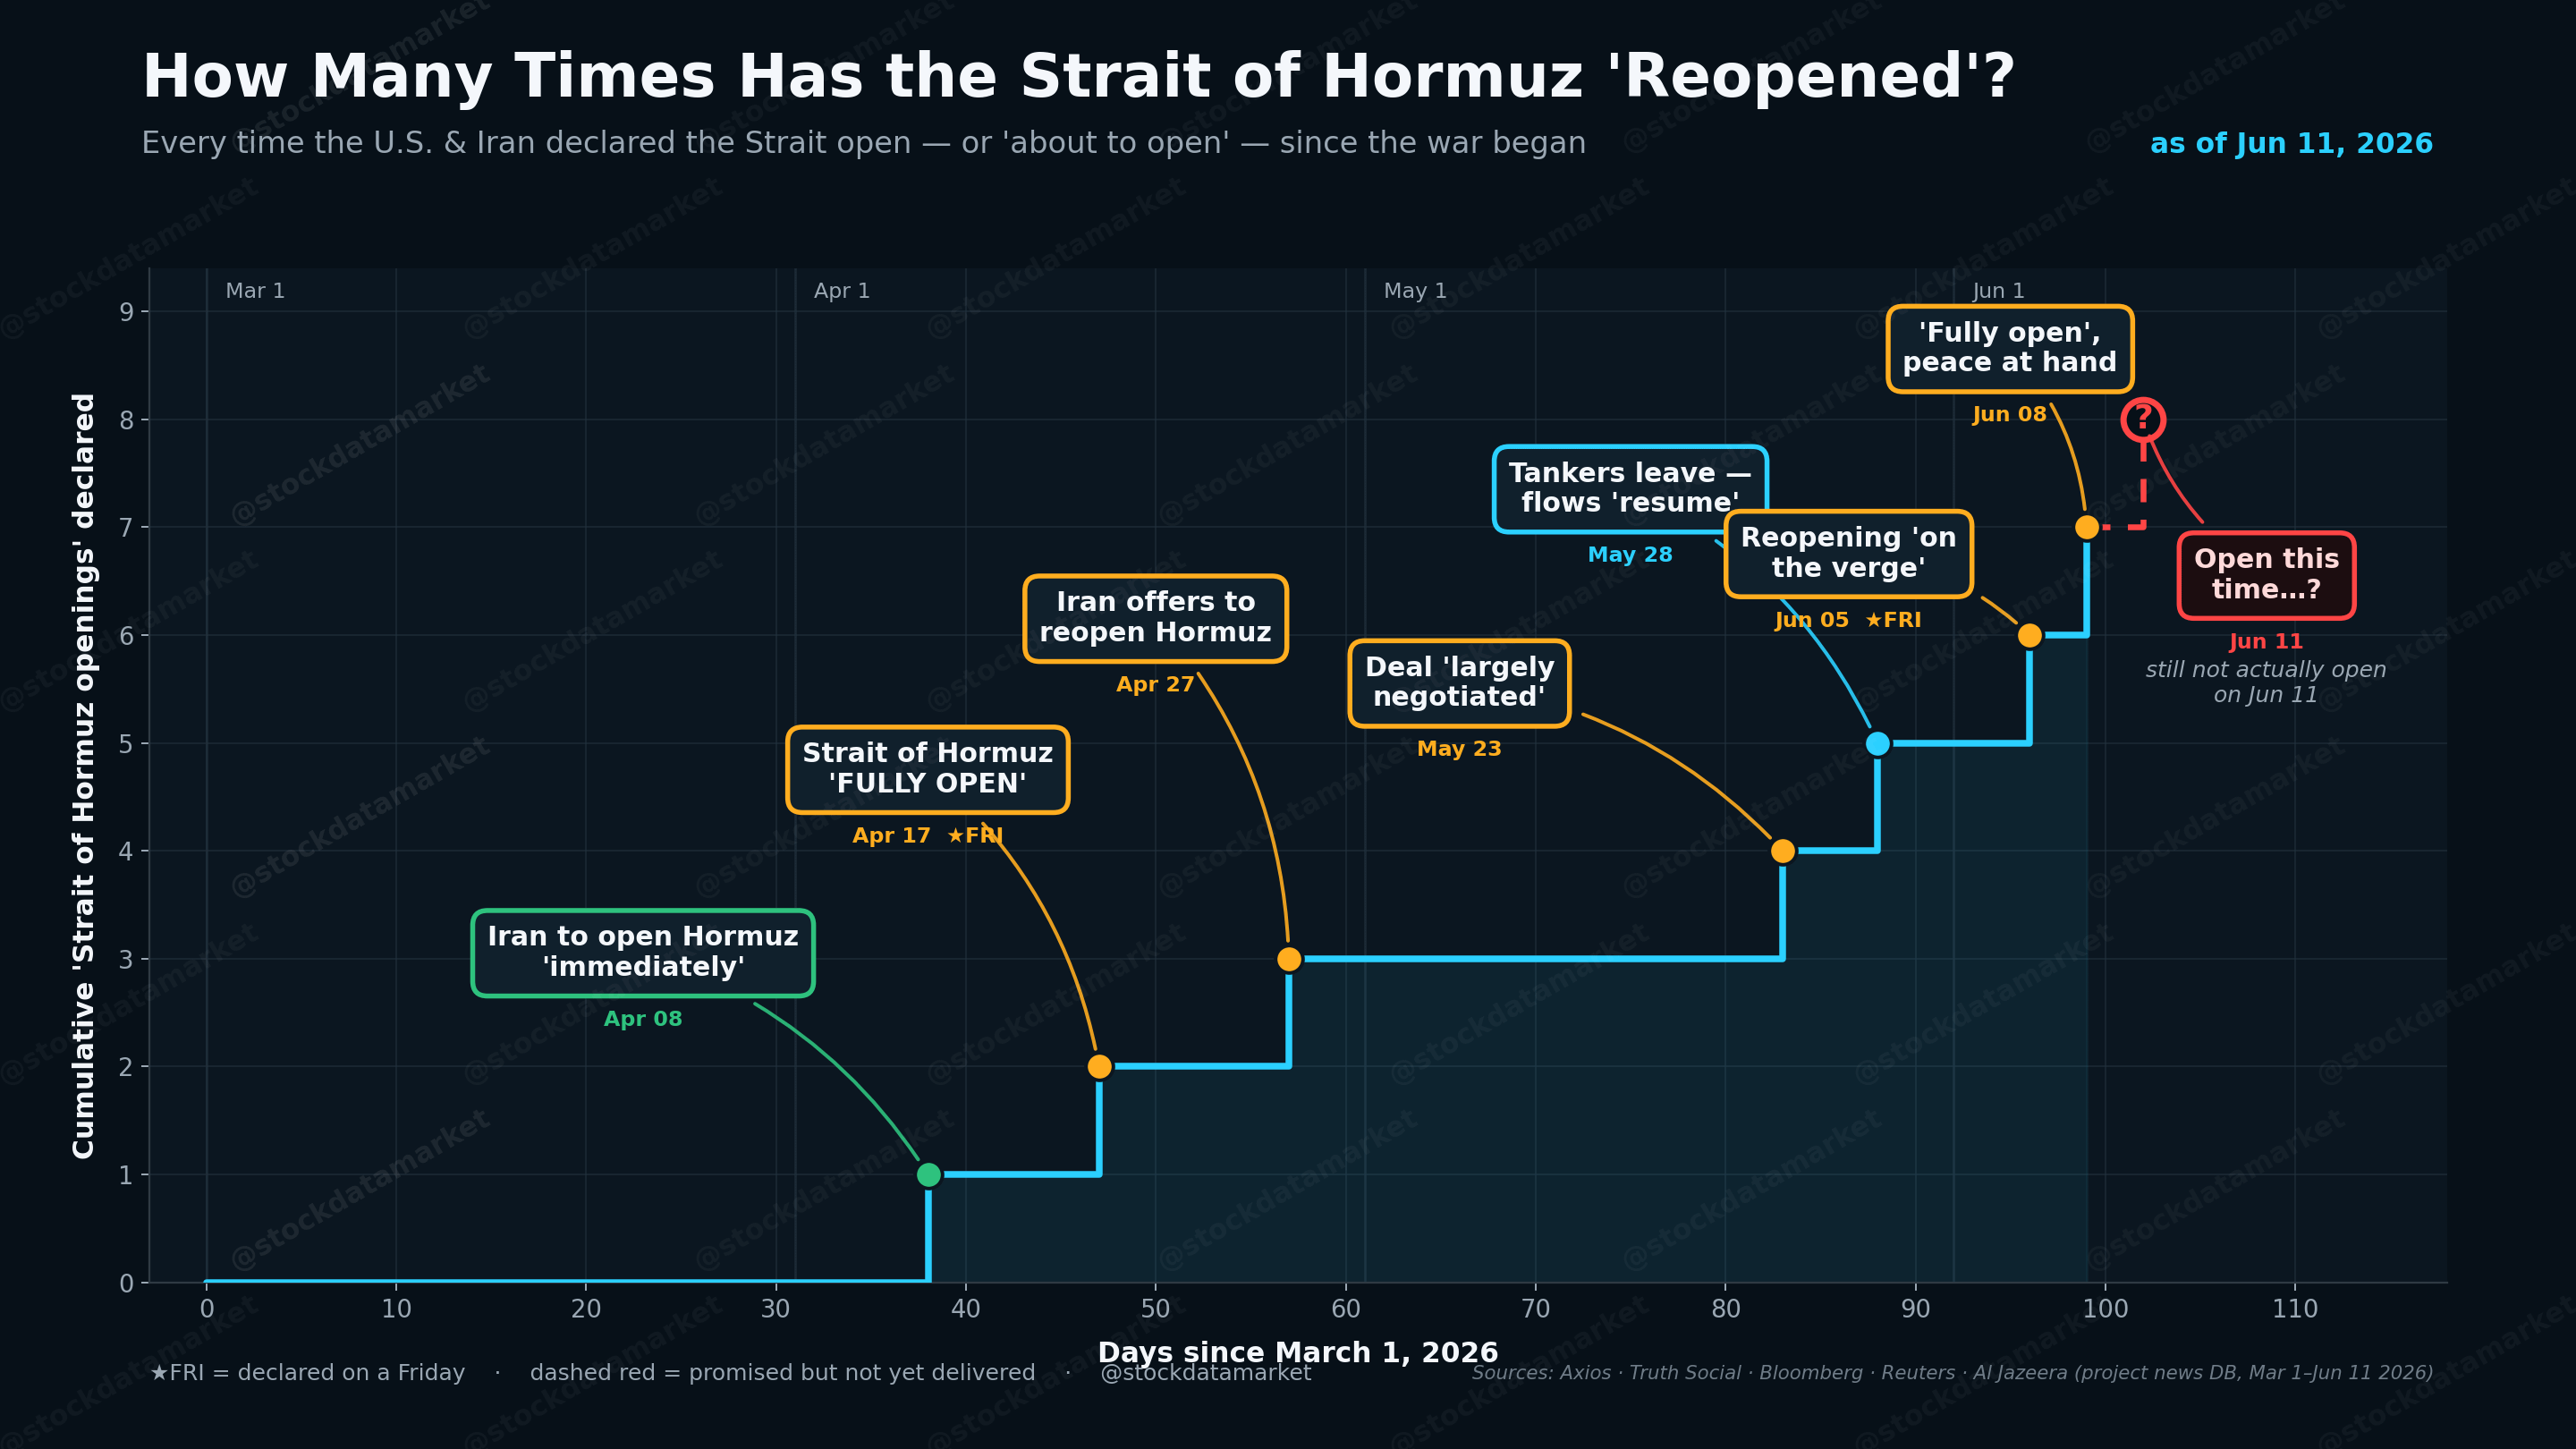
So another peace deal with Iran came today. We even had another Strait of Hormuz opening. But inflation is going up and up and up and up!
The number that landed this week is what matters to you: US inflation just crossed 4% for the first time in three years.
And here’s the twist that makes this report worth more than a headline. The thing that pushed inflation over 4% - the oil shock from the war with Iran - looked like it was fading by the time the data printed. Crude peaked, rolled over, and slid back toward $86 a barrel while economists were still writing up the May numbers. But “looked like” is doing a lot of work in that sentence, because the price is falling for one reason - hope that a ceasefire reopens the Strait of Hormuz - while the physical oil market is quietly draining to its lowest level in 23 years. So the real question isn’t “is inflation back.” It’s whether the cheap-oil relief is the end of the shock or just the eye of the storm.
Let’s get into it.

The scoreboard: a new three-year high
Start with the consumer number, because it’s the one that makes the news.
Headline CPI rose 0.5% in May and 4.2% over the past year. That’s the highest annual reading since April 2023, it’s above 4% for the first time in three years, and it’s the third straight month inflation has accelerated. The monthly pace actually slowed a touch from April’s 0.6%, but the annual rate kept climbing because last year’s comparison months were soft. Both numbers landed right where economists expected.
The energy story inside that number is brutal. Energy rose 3.9% on the month and 23.5% over the year, and the BLS said energy alone accounted for more than 60% of the entire monthly CPI increase. Gasoline jumped 7% in May and is now up 40.5% from a year ago. Fuel oil is up almost 59%. This was, very plainly, an energy-driven print.
But here’s where it gets interesting, and where most of the headlines missed the real story. Strip out food and energy, and core CPI rose just 0.2% on the month - below the 0.3% economists expected, and down from 0.4% in April. The annual core rate ticked up to 2.9%, a new high since September 2025, but the monthly number is the tell. Core commodities actually fell 0.1%. The consumer core, the part the Fed truly cares about, did not break. The heat is still almost entirely energy.

Now the producer side, which is where the warning sign actually lives.
Producer prices for final demand rose 1.1% in May and 6.5% over the year - the hottest annual reading since November 2022. Goods prices alone jumped 2.8% on the month, the biggest monthly increase since the PPI series began in December 2009, with about four-fifths of it coming from energy and a 23.4% surge in wholesale gasoline. That part is just the oil shock working through the pipeline, and it’ll fade with crude.
The part that won’t necessarily fade is this: producer prices excluding food, energy, and trade services rose 0.8% on the month - the sharpest jump since March 2022 - and 5.1% over the year, the highest since October 2022. That’s the cleanest measure of underlying wholesale pressure, and it’s the one number in this whole release that should make a central banker uncomfortable. It says the shock isn’t only passing through volatile energy. It’s starting to show up in the core of the production chain.
One footnote worth flagging, because it matters for trust in the data: April’s PPI was revised down. The original 1.4% monthly and 6.0% annual readings became 1.1% and 5.7%. So part of what looked like relentless acceleration was a touch softer than first reported. The trend is still up. It’s just slightly less vertical than the first cut suggested.
What’s actually driving this
If you want one sentence: energy is the fire, producer margins are the fuse, and the consumer core is the thing that hasn’t caught yet.
Energy is doing the visible damage. Gasoline up 40%, fuel oil up 59%, electricity up nearly 6%. These are the line items people feel every week, and they’re why the headline number looks scary. But energy is also the most likely thing to reverse, because the shock that caused it is already unwinding.
Food is the quiet political pain. Up 3.1% over the year, accelerating again from April. Groceries up, restaurants up. Nobody enjoys it, but it’s not the swing factor.
Shelter is the old anchor. Up 3.4% over the year and still sticky, rising 0.3% on the month. It’s not the new shock - it’s the thing that kept core inflation from falling all the way back to target even after goods cooled, and it can keep core elevated even if energy collapses.
And the core services - the medical care, the transportation services, the personal care that all printed above 3% - are the persistence risk. Transportation services are up 4.1%, medical care services 3.6%. If those keep grinding, the Fed can’t call this a clean energy blip.

The shock peaked in the data - but did it actually end?
Here’s the part that makes this report genuinely unusual, and it’s why the timing matters so much.
The war with Iran started on February 28. Crude doubled. WTI ran from under $58 in December to above $100 by April, Brent tested $114, and the IEA called it one of the largest oil supply disruptions in history. That’s the shock the May data is measuring. By the time the CPI and PPI reports came out on June 10 and 11, they were describing peak pass-through.
But the market had already moved on. By June 11, WTI had fallen back toward $86 - the lowest since April, down roughly 16% in four weeks - as ceasefire optimism built, the US suspended planned strikes, and tanker traffic through the Strait of Hormuz started picking back up. Brent dropped toward $92. President Trump suggested a deal that could reopen Hormuz might be signed within days.
So the official inflation data is, in a sense, looking backward at a fire that might already be getting put out. That’s the bull case: if crude stays down, the energy contribution that did 60% of the monthly CPI damage starts working in reverse, and headline inflation rolls over through the back half of the year. Emphasis on “if” - because as we’re about to see, the reason crude is down is a lot shakier than the price chart makes it look.
The catch - and there’s always a catch - is that oil getting cheaper is not the same as the oil problem being solved. The price is falling on hope. The physical market is falling apart. And that gap between the two is the most underappreciated risk in this entire report.

That gap in the chart - crude already falling while pump prices stay high - is the “rockets and feathers” effect economists love to talk about. Gas prices shoot up like a rocket when crude rises and drift down like a feather when it falls. It’s why the consumer is still feeling May’s pain even though the wholesale barrel is cheaper today.
The tank is draining: the crisis hiding under the falling price
Here is the thing almost nobody is talking about while they celebrate cheaper crude.
The world is burning through its oil cushion at the fastest pace ever recorded. The IEA says global inventories fell by 129 million barrels in March and another 117 million in April - the fastest depletion on record - and that the 400 million barrels of emergency reserves released by IEA members (the largest coordinated release in the agency’s history, more than double the 182 million released after Russia invaded Ukraine) has not been enough to keep up. As of May, Middle East production was running roughly 11 million barrels a day below pre-war levels, with Iran’s own storage maxing out and forcing producers to shut in even more.
Then came the number that should make everyone pause. In its June Short-Term Energy Outlook, the EIA projected that OECD oil inventories - the stockpiles held by the US, Japan, Europe and other advanced economies - will fall to just under 2.3 billion barrels by December 2026. That is the lowest level since the agency started keeping records in 2003. It works out to roughly 50 days of demand cover, down from a comfortable 70-plus days the EIA was forecasting before the war. The buffer that lets the world absorb a supply shock without a price spike is almost gone.

This is why the falling price is more fragile than it looks. WTI dropped toward $86 because traders are betting on a ceasefire and the reopening of Hormuz. But the EIA’s own base case assumes the strait does not return to normal traffic until early 2027, and under that assumption it sees Brent averaging around $105 in June and July - well above where it’s trading now. Put bluntly: the market has priced in a peace deal that hasn’t been signed, on top of an inventory situation that is genuinely critical. If the talks collapse, there is very little physical cushion left to stop the next spike, and the US has already spent most of its SPR ammunition. The cheap-oil relief in the May-to-June window could prove to be the calm in the middle of the storm, not the end of it.
That is the real two-sided risk hiding inside a friendly-looking inflation report. The base case is that oil keeps fading and inflation rolls over. The tail risk is that a 23-year-low inventory base meets a broken ceasefire, and the whole energy shock comes back harder than the first wave.
A quick history, because the rate falling never gave anything back
To understand why a 4.2% print stings this much, you have to remember it’s not landing on a clean slate.
The post-2020 story in one breath: oil collapsed in the COVID crash, then goods exploded in the reopening, then wages and shelter kept the fire going, then CPI peaked at 9.1% in June 2022 after Russia invaded Ukraine, then it slowly cooled toward target through 2024 and 2025 - and now energy has dragged it back above 4%.
But that cooldown was always a cooldown in the rate, not the level. Prices never fell. They just rose more slowly for a while. Since January 2020, headline CPI is up about 29%, producer prices about 32%, and energy and gasoline are up more than half. A lower inflation rate doesn’t feel like relief to a household. It feels like the bleeding slowed down.

That’s the psychological weight here. The 2026 oil shock didn’t arrive on top of cheap everything. It arrived on top of six years of accumulated price-level damage, and people are tired. So a headline back above 4% reads less like a data point and more like a betrayal of the “we beat inflation” story everyone wanted to believe in 2025.
How the whole thing connects
If you zoom out, the transmission chain is the same machine it’s always been - it’s just running in a slightly different gear this month.

The Fed: Warsh’s first test, and it’s a hard one
The Federal Reserve walks into its June 16-17 meeting with a genuinely awkward hand.
It’s Kevin Warsh’s first meeting as chair. He was sworn in on May 22, taking over from Jerome Powell, who stayed on the board. Warsh is generally seen as preferring lower rates, but he’s inherited an inflation problem that does not cooperate with that preference. The funds rate has sat at 3.50% to 3.75% since December, held steady through January, March, and April. The April decision drew four hawkish dissents, the most since the early 1990s.
The market consensus for June is a hold, with the bigger story being a likely shift in the Fed’s stance - from a bias toward eventual cuts to an explicitly neutral posture. Traders have moved from pricing cuts in 2026 to pricing essentially none, with a rising probability that the next move is actually a hike. J.P. Morgan’s base case now has the Fed on hold through 2026 and potentially hiking in late 2027 if inflation refuses to behave. “Higher for longer” is back, and Warsh’s first press conference and dot plot will tell us how hard he’s willing to lean against the easing instinct he’s known for.
The Fed’s real dilemma is the same one the data poses. If the oil cooldown is real and core stays calm, this was a one-quarter energy tax and they can look through it. If the core wholesale pressure - that 5.1% PPI ex-energy-and-trade reading - bleeds into consumer services and expectations, then they have a policy problem that rate holds alone won’t fix.
Where this goes: the next few months decide it
So where does inflation actually land?
The honest answer is that the path forks over the summer, and the fork depends almost entirely on oil and pass-through. The Philadelphia Fed’s Survey of Professional Forecasters, in its Q2 2026 reading, sees current-quarter headline CPI running hot at a 6% annualized pace, then full-year 2026 averaging around 3.5%, with core near 2.9% and the long-run drifting back toward 2.4%. That’s the professional baseline: a shock that peaks soon and fades.

The baseline case: headline CPI probably grinds a bit higher into the summer as the last of the energy pass-through works through, peaks somewhere near 4.5%, and then - because oil has already rolled over and base effects turn favorable, also economy slows down - fades back toward the mid-3s by year-end and toward target through 2027. This is the most likely path, and the early oil reversal is the reason to believe it.
The sticky case: energy doesn’t fully reverse, the ceasefire wobbles, and that core wholesale pressure keeps leaking into services. Inflation hangs around 4% into 2027, and the Fed is stuck choosing between weaker growth and its own credibility. This is the case that 5.1% PPI-ex number is quietly arguing for - and the one the 23-year-low inventory base makes genuinely dangerous, because there’s almost no physical cushion left to stop a second spike if Hormuz stays shut.
The cool-down case: the ceasefire holds, Hormuz reopens, crude keeps sliding toward the $60s that some forecasters expect once flows normalize, and the whole energy contribution swings negative. Inflation drops faster than the consensus thinks, and the conversation flips back to rate cuts by early 2027.
Right now, the early oil reversal tilts the odds toward the baseline and even the cool-down. But the burden of proof is on the data, and the single most important thing to watch is simple: does core services inflation cool while energy fades? If it does, this was an energy tax. If it doesn’t, it’s a wave.
Bottom line
This is not 2022 again. It’s also not nothing.
The US has a fresh inflation flare-up - headline back above 4%, producer prices at a three-year high - sitting on top of a permanently elevated post-2020 price level. The May CPI showed the consumer hit. The May PPI showed the pipeline hit, and hinted the shock is reaching the core. And all of it was measuring a fire whose fuel supply - the world’s oil cushion - is more depleted than at any point this century.
The most likely outcome is that inflation peaks this summer and fades into 2027 as the oil reversal does its work or just a recession hits hard.
Sources
US Bureau of Labor Statistics, Consumer Price Index - May 2026, released June 10, 2026: https://www.bls.gov/news.release/cpi.nr0.htm - source for CPI +0.5% m/m and +4.2% y/y (highest since April 2023), core CPI +0.2% m/m and +2.9% y/y, energy +3.9% m/m and +23.5% y/y, gasoline +7.0% m/m and +40.5% y/y, fuel oil +58.9% y/y, shelter +3.4% y/y, food +3.1% y/y, electricity +5.9% y/y, and the statement that energy accounted for over 60% of the monthly all-items increase.
US Bureau of Labor Statistics, Producer Price Indexes - May 2026, released June 11, 2026: https://www.bls.gov/news.release/archives/ppi_06112026.htm - source for final-demand PPI +1.1% m/m and +6.5% y/y (highest since November 2022), final-demand goods +2.8% m/m (largest since the series began in December 2009), core PPI +0.4% m/m and +4.9% y/y, PPI excluding food, energy and trade services +0.8% m/m and +5.1% y/y, wholesale gasoline +23.4%, and the downward revision of April PPI to +1.1% m/m and 5.7% y/y.
US Bureau of Economic Analysis, Personal Income and Outlays, April 2026, released May 28, 2026: https://www.bea.gov/news/2026/personal-income-and-outlays-april-2026 - source for the April PCE price index at +3.8% y/y and core PCE at +3.3% y/y, headline PCE +0.4% m/m.
Federal Reserve Bank of Philadelphia, Second Quarter 2026 Survey of Professional Forecasters, released May 2026: https://www.philadelphiafed.org/surveys-and-data/real-time-data-research/spf-q2-2026 - source for the current-quarter headline CPI forecast of 6.0% annualized, core CPI 3.2%, fourth-quarter 2026 headline CPI 3.5% and core 2.9%, and the 10-year average CPI of 2.4%.
US Energy Information Administration, Short-Term Energy Outlook, June 2026 (released June 9-10, 2026): https://www.eia.gov/outlooks/steo/ - source for the projection that OECD oil inventories fall to about 2,287 million barrels (just under 2.3 billion) by December 2026, the lowest since records began in 2003, equivalent to roughly 50 days of demand cover; global inventory draws averaging 6.3 million barrels per day in Q2 and 7.6 million in Q3 2026; Middle East production shut-ins of 11.3 million barrels per day in May; a Brent forecast of about $105 per barrel for June-July; and the assumption that the Strait of Hormuz does not return to normal traffic until early 2027.
International Energy Agency, Oil Market Report, May 2026 (released May 13, 2026): https://www.iea.org/reports/oil-market-report-may-2026 - source for global inventory drawdowns of 129 million barrels in March and 117 million in April (the fastest depletion on record), the record 400-million-barrel coordinated emergency reserve release by IEA members, and the “record pace” framing of the stock drawdown. Reuters, Kitco, AP, Euronews and Korea Times reporting corroborate these figures.
US Energy Information Administration and market reporting on crude prices through June 11, 2026 (CNBC, Fortune, Trading Economics): WTI falling toward $86 and Brent toward $92, down roughly 16% over four weeks; the US Strategic Petroleum Reserve at its lowest level since the 1980s; tanker traffic through the Strait of Hormuz increasing amid ceasefire negotiations. https://tradingeconomics.com/commodity/crude-oil and https://fortune.com/article/price-of-oil-06-11-2026/
AAA national average gasoline price, June 2026: national average around $4.13-$4.26 per gallon, down from a mid-May peak near $4.50 even as the barrel fell faster - the lagged “rockets and feathers” pass-through. https://gasprices.aaa.com
Federal Reserve communications and market reporting on the June 16-17, 2026 FOMC meeting: Kevin Warsh sworn in as chair on May 22, 2026; federal funds target held at 3.50%-3.75% since December 2025; markets pricing a June hold with an expected shift from an easing bias to a neutral stance, cuts priced out of 2026, and rising hike probability. Reporting via Chase, Charles Schwab and Polymarket coverage of the meeting.
International Energy Agency, Oil Market Report (2026 editions): context for the scale of the Hormuz supply disruption and the doubling of crude after the February 28, 2026 onset of the conflict. https://www.iea.org/reports/oil-market-report
Federal Reserve Bank of St. Louis, FRED economic data: series CPIAUCSL, CPILFESL, PPIFIS, WPSFD49116, PCEPI, PCEPILFE, MCOILWTICO, DCOILWTICO, DCOILBRENTEU, CPIENGSL, CUSR0000SETB01, CPIUFDSL, CUSR0000SAH1, GASREGW, GASDESW. These series provide the time-series history, the cumulative price-level arithmetic, the indexed fuel chain, and the projection base. https://fred.stlouisfed.org


