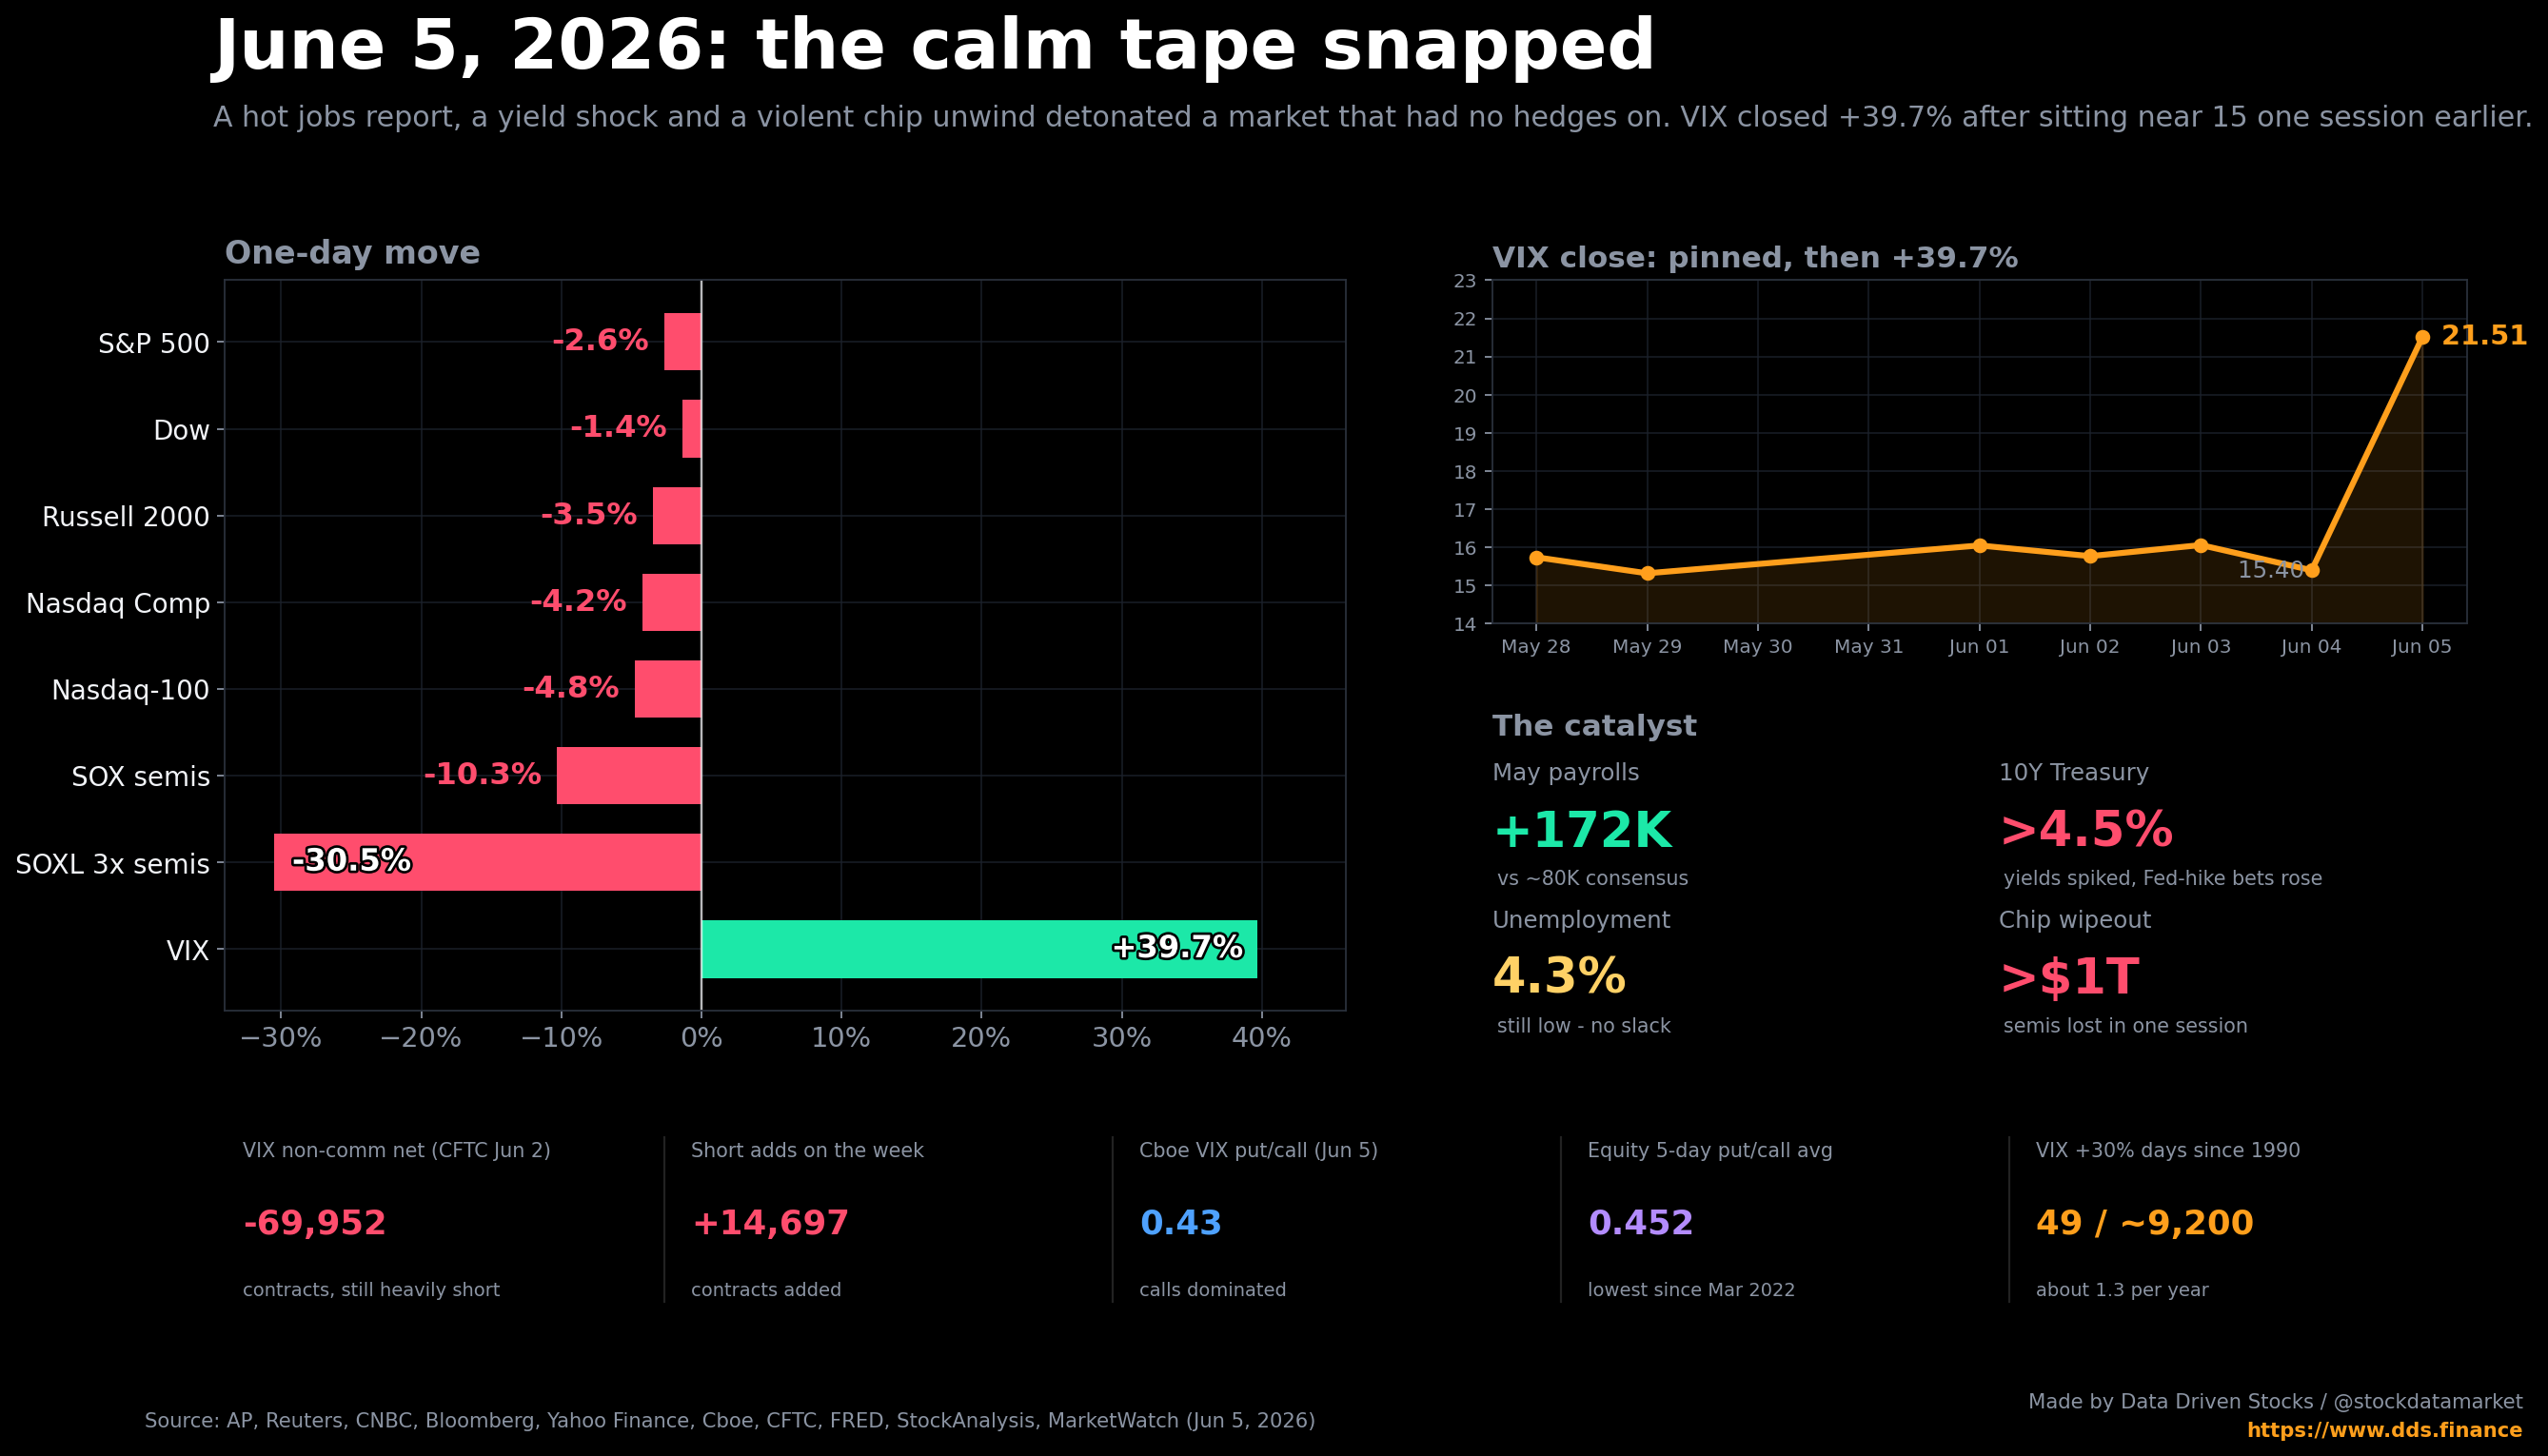
The Volatility Bomb Nobody Hedged: Why the Market Crashed on Friday, June 5, 2026 - and Why I Bought VIX Calls Two Days Early. Then after a S&P 500 -2.64%, Nasdaq -4.18%, VIX +39.7%
A hot jobs print, a yield shock and a violent chip unwind lit the fuse. But the real story is a market that spent weeks selling volatility into the calm, and then got squeezed the moment it mattered.

First, a quick thank you. To everyone who just subscribed on Substack this week, to the new followers over on X at @stockdatamarket, and to the people who have been here reading the boring positioning charts for months while the market melted up - thank you. Genuinely. The audience has roughly doubled in the last two weeks, and a lot of you found this corner of the internet because of one chart and one trade. So welcome.
Most of you probably landed here right after Friday’s drop, wondering how anyone could have seen a 39% VIX explosion coming when the index was sitting at record highs forty-eight hours earlier. Fair question. Let me walk you through it from the beginning, the same way I was reading it in real time. None of this is a victory lap. It is a checklist of warning signs that kept stacking up until the trade got obvious.
Here is the thing I want you to take away before we even start: Friday was not really about the jobs report. The jobs report was the match. The market itself was the dry brush. We had been pouring gasoline on it for weeks by selling volatility into a one-way tape, and almost nobody was holding a hedge.
1. The first omen: a VIX that kept getting sold into the calm
If you have traded volatility for any length of time, you know the VIX behaves differently when it is sitting in a low regime. When the index is calm and the VIX hangs out in the mid-teens, there is a constant, structural pressure to sell it. Systematic short-volatility carry strategies harvest the premium. Dealers who are long volatility from customer hedges lean against it. Vol-control and risk-parity funds quietly add exposure because realized volatility is low. And speculators pile into the trade because it has been printing money. None of this is a literal rule that “every algorithm shorts the VIX below 25.” It is more subtle and more dangerous than that: in a calm regime, the whole machine is wired to keep selling volatility, right up until it cannot.
The problem is that this trade builds enormous short-squeeze potential underneath the surface. Sell enough volatility into a quiet market and you create a coiled spring. When the move finally comes, the people who were short have to cover into a rising VIX, and that covering pushes volatility even higher. We will come back to that loop later, because it is the entire ballgame.
For the last two weeks, the tape under the VIX looked wrong to me. There was persistent, heavy VIX call buying showing up on the options floor - exactly the kind of flow you see when somebody with size wants cheap insurance and is willing to pay up for it while everyone else is asleep.


Then there was the futures picture. The front-month VIX future, the one that actually drives the products people trade, drifted down to its lowest level since Christmas. And here is why that matters: the holidays are almost always a low-volatility window. Markets are thin, news flow dries up, and implied vol naturally bleeds lower into year-end. So a low print around Christmas is normal and means very little. Getting that same low print in early June, with oil spiking on Middle East tension, a packed economic calendar and a Fed that had not blinked, is a completely different signal. It tells you the market was pricing holiday-level calm into a decidedly un-holiday-like backdrop.

And it was not just a feel. The Commitments of Traders data backed it up cold. As of the June 2 CFTC report, non-commercial accounts - the speculators - were net short roughly 70,000 VIX futures contracts. They held about 111,000 longs against 181,000 shorts, and the shorts had grown by almost 15,000 contracts on the week. So into the most fragile setup of the year, the fast money was leaning harder on the short-volatility trade, not lighter.

Now, here is the historical reason this kind of setup keeps me up at night. We have seen what happens when a crowded short-volatility trade meets a sudden move.
2. A short history of how this breaks: Volmageddon
On February 5, 2018, the VIX closed up 115.6% in a single day, from 17.31 to 37.32. That is still the largest one-day jump in the index’s history, and it earned a nickname: “Volmageddon.” Here is the part that matters. It was not triggered by a war, a bankruptcy, or some shocking headline. The S&P 500 fell only about 4% that day. What detonated was structure - the plumbing of the volatility market itself.

The poster child was a product called XIV, an inverse-VIX exchange-traded note issued by Credit Suisse. The ticker was literally “VIX” spelled backwards, because the whole point was to profit when volatility stayed low - a packaged short-volatility bet. For years it worked beautifully. From its launch in 2010 to early 2018 it returned more than 1,000%, it had swollen to around $1.9 billion in assets, and shorting vol through it had become one of the most crowded trades on the street.
Then came that Monday afternoon. As the front VIX future ripped from around 16 to the low 30s, XIV’s value cratered in the final fifteen minutes of trading, collapsing 96% from $108.37 to $4.22. The note’s own fine print contained a kill switch: if its intraday value ever fell to 20% or less of the prior day’s close, the issuer could accelerate - that is, terminate - the note. It did. Credit Suisse announced the acceleration the next morning and wound XIV down within weeks. The competing minus-one-times product, ProShares’ SVXY, fell about 91% and barely survived; ProShares later cut its leverage in half, to minus-0.5x, specifically so that a single day could never zero it again.
Now, did Credit Suisse itself get wiped out? This is the part most people get wrong. The bank said it was fully hedged - that for all the drama, its own book was roughly a wash - and it had actually owned a large slice of the notes. Its chief executive at the time called the product “legitimate” and said investors had taken their own risk. Furious XIV holders sued, alleging the bank had manipulated the unwind to protect itself; Credit Suisse denied it. So the squeeze did not really burn the bank’s profit and loss. It vaporized the people who were short volatility without a hedge - somewhere between one-and-a-half and nearly two billion dollars of investor money - and it forced the bank to kill its flagship volatility product and spend the next year fighting lawsuits. The lesson is not “Credit Suisse blew up.” The lesson is that the short-vol trade can erase years of gains in fifteen minutes, and the wrapper you used to put it on will not save you.
Here is the mechanism, because once you see it you see it everywhere. An inverse-VIX product holds a short position in VIX futures sized to its assets. To keep that exposure at a constant minus-one-times every single day, it has to rebalance at the close. When the futures fall, it sells a little and life is easy. But when the futures rise, two things happen at once: the fund loses money, and its short position is suddenly too large relative to its now-smaller pile of assets. To reset back to minus-one-times, it has to buy futures back - and the bigger the day’s move, the more it has to buy. So a rising VIX forces these products to buy volatility into the very rally that is destroying them. That buying pushes the futures higher, which forces more buying, which pushes them higher still. The selloff in stocks was only the spark. The forced rebalancing was the bomb.

You can put rough numbers on that loop, and they explain why the same setup is sometimes a shrug and sometimes a catastrophe. Picture a moderate shock, say the futures get knocked up 35% by some macro catalyst. In a calm market with a thin short-vol book, the forced buying is small, the move gets absorbed, and volatility settles down and mean-reverts. But as more and more money piles into the short-vol trade during the quiet times, the forced-buying response to any given move gets larger, and that same 35% shock amplifies into something far bigger. Past a certain level of crowding, the amplified move is large enough - roughly 100% on the futures - to take an inverse product all the way to zero. That is exactly what February 2018 was.

The technical word for this is reflexivity: the market’s reaction to a move becomes the next move. Below a critical level of crowding, shocks dampen out and volatility behaves itself. Above it, shocks feed on themselves and you get a vertical spike. The danger is never the headline. It is how much forced buying is coiled up underneath, waiting for any excuse to fire.

The reason I keep this loop taped to my monitor is that the ingredients never change: a calm tape, crowded short-volatility positioning, and then one fast move. The wrappers evolve - XIV is gone, SVXY runs at half the leverage, and these days far more of the short-vol exposure lives in systematic strategies and in the daily tidal wave of 0DTE option selling - but it is the same machine wearing different paint. In late May and early June of 2026, every one of those ingredients was back. The names change. The math never does.
3. A market in distribution while the VIX kept falling
Step back from volatility for a second and look at the index itself. For weeks the S&P 500 had been grinding into the 7,600 zone, and on June 2 it closed above 7,600 for the first time ever (June 1 finished fractionally below, at 7,599.96). That is the kind of milestone that gets celebrated on financial TV. But milestones at the top of a long run are often where distribution quietly begins - where the people who rode the whole move start handing shares to the people who just want in.
What caught my eye was not the new high. It was the rejection that followed, and the divergence underneath it. The index kept poking at the same upper band and getting pushed back, while momentum was rolling over beneath the surface. A bearish RSI divergence flashed as price made a marginally higher high on weaker internals. On its own, a divergence is not a sell signal - markets can diverge for a long time. But it is a tell that the move is running on fumes.

Then there was the relationship that should have been impossible to ignore. The VIX and the S&P 500 are usually inversely correlated - when stocks grind higher, volatility eases; when stocks fall, volatility rises. But in the back half of May, the index stopped going up while the VIX kept going down. That is the market paying less and less for protection on a rally that had already stalled. When the thing you are supposed to fear gets cheaper while the thing you own stops climbing, the asymmetry is no longer in your favor.
4. The put/call ratio at extreme greed: nobody was hedged
If you want a single number that captures how lopsided sentiment had gotten, look at the put/call ratio. The ratio is exactly what it sounds like: the volume of put options traded divided by the volume of calls. Puts are bets on, or protection against, a decline. Calls are bets on a rise. When everyone is buying calls and nobody is buying puts, the ratio drops, and that is usually a contrarian warning - it means the crowd is all leaning the same way, with no insurance on.
By late May, the Cboe equity-only put/call ratio’s five-day average had fallen to 0.452, the lowest reading since March 30, 2022. CNN’s Fear and Greed gauge, which uses a version of the same ratio, was sitting at extreme greed with a five-day put/call print around 0.58. Either way you cut it, this was a market that had stopped paying for downside protection almost entirely.

I want to be careful here, because this is where people overclaim. The put/call ratio is not a timing tool. A market can stay complacent for weeks. But complacency is a condition, not a trigger. It tells you that if a trigger shows up, there is no shock absorber underneath. On June 5, the trigger showed up.

5. The hedging regime quietly flipped
Here is the signal that actually got me to put the trade on, and it is the most under-the-radar one. When I monitor S&P 500 options flow, I am watching not just how much is trading but on which side of the market it prints. In a calm bull tape, the dominant flow in index puts is selling - desks collect premium by selling downside that, week after week, expires worthless. It is the same short-volatility instinct, just expressed in puts.
For most of the rally, the big SPX downside strikes were being sold. Then, in the last week of May, the flow in a far-out SPX put - the 7000 strike expiring in September - flipped. It went from steady premium selling to heavy, aggressive buying. The volume swelled and the bids stacked up on the downside.

That flip is the part that rang the bell. When a market stops surging and slides into distribution, and then the options flow rotates from selling puts to buying them, some large pool of capital is paying real money to be protected. It does not tell you exactly what they are afraid of - bad news, a technical correction, a rate scare - but it tells you the regime is changing. Smart money does not buy expensive far-out insurance at the highs for no reason.
6. The peace-deal trade stopped working
To understand why the market was so vulnerable, you have to understand what had been driving it up. Since the spring, two engines did most of the work. The first was AI mania, the relentless bid under anything tied to chips and data centers. The second was a steady drip of risk-on geopolitics - markets that had been conditioned to rally on every sign of progress toward a US-Iran de-escalation, with oil sliding each time the headlines pointed toward peace.
If you watch around 5:05 you will see that SPY stopped reacting to the news. This a red flag for bulls if index became insensitive to the news.
That conditioning was real and well documented. In late May, global stocks hit record closing highs and oil slid as markets eyed progress in the talks. Secretary of State Marco Rubio reported “slight progress” and “some good signs,” with the usual caveats around the Strait of Hormuz. By early June, there were reports that Tehran had agreed to discuss aspects of its nuclear program that had previously been off the table. On paper, these were serious diplomatic headlines from the actual top of the State Department, not rumor-mill chatter.
And yet, by June 3 and 4, the magic stopped. Oil climbed back toward $100 as renewed hostilities threatened the ceasefire, and the rally that peace headlines used to deliver simply did not show up. The Dow could still tag a record on June 4, but the Nasdaq was already cracking under Broadcom and the chip complex. By Friday, even genuinely market-moving diplomatic progress could not lift equities. The tape had a bigger problem - rates and tech - and it overpowered the risk-on impulse completely.
That is the real signal in the peace-deal story. It is not that “the algorithms only bought peace.” It is that the market’s sensitivity changed. When good news stops working, you are usually closer to a top than a bottom.
7. The second omen: NVIDIA leaking and SOXL going parabolic
Now to the part of the market that actually broke first. The single most important stock on the planet right now is NVIDIA, and it had a tell of its own. Heading into Broadcom’s earnings, NVDA kept getting rejected every time it pushed toward the 230 area, and it leaked lower from there. When the generals start retreating before the index does, that is a problem, because the index is leaning on those generals more than ever.

How much is the market leaning on a handful of names? More than at almost any point in history. By June 5, the top ten S&P 500 constituents accounted for about 38% of the entire index, and NVIDIA alone was 7.41% of it. When your benchmark is that concentrated, weakness in mega-cap chips is not a sector story. It is an index story.

It also matters that this was happening at the tail end of a heavily bullish earnings season. When earnings season ends on a high note, there is a natural tendency for profit-taking - the catalysts are spent, guidance is digested, and the easy bid fades. Layer that seasonal lull on top of a top-heavy index that had just gone parabolic, and you have a market with no obvious reason to keep pushing higher and a lot of crowded positioning to unwind.
Nowhere was the froth more obvious than in the leveraged semiconductor products. SOXL, the 3x daily semiconductor bull fund, ripped into June 3, with its closing price topping out near $281 after a near-vertical run. Leveraged daily products like this are wonderful on the way up and brutal on the way down, because the same daily-reset math that compounds gains in a trend compounds losses in a reversal. There was no room for a soft landing.

The technical readings confirmed how stretched it was. In the snapshot I captured early on June 5, SOXL’s RSI was sitting above 70 across the 10, 14 and 20-day windows - textbook overbought. (A timestamp note matters here, because once the crash hit, several services flipped those RSI readings sharply lower within hours. The overbought reading describes the setup going in, not the wreckage coming out.)
8. So I put the trade on
Add it all up. A VIX getting structurally sold into a low regime, with heavy call buying and crowded net-short futures underneath. A top-heavy index in distribution, rejecting the same band while momentum diverged. A put/call ratio at extreme greed. A hedging flow that had just flipped from selling puts to buying them. A peace-deal trade that stopped working. The most important stock in the market leaking. And a leveraged chip complex going parabolic into an overbought blow-off.
That is not one signal. That is a stack of them all pointing the same direction. So I asked the simple question: if this breaks, when does it break? And the answer is almost always Friday or Monday.
Friday is dangerous because of options. Weekly expirations concentrate dealer positioning and 0DTE flow, so a directional miss can snowball into the close instead of mean-reverting. Monday is dangerous for a different reason: the weekend gap. Everything that happened Friday night, Saturday and Sunday gets repriced in one shot at the Sunday-evening globex open, when liquidity is thin and a move can travel much further than it would mid-week. Those two sessions are where volatility events cluster.
So on Wednesday evening, June 3, I bought VIX calls and said so publicly. Timestamp and all.

9. The one thing most people get wrong: shorting VIX and puts squeezes the market down
Before I get to Friday itself, I need to clear up the single biggest misconception I see in my replies. Whenever I mention a “short squeeze,” half the comments assume that means prices are about to rocket higher. GameStop did that to everyone’s brain. But a short squeeze does not have a direction of its own. It runs in the direction of whatever was sold short.
When traders are short a stock and it rallies, they cover by buying shares, and that buying pushes the price up. Squeeze goes up. Simple. But on June 5, the crowded shorts were not in stocks. They were in volatility and in puts. And when you squeeze those, the market goes down.

Here is the chain. Desks are short volatility and short puts, collecting premium in a calm bull tape. Stocks slip. Now the puts those desks are short gain value, and the VIX they are short rises - both positions are losing. To cover, they buy back puts and buy VIX futures. But there is a second layer underneath: the dealers who are now short those same puts have to sell index futures to stay hedged, because their position has negative gamma - the lower the market goes, the more they have to sell. So you get covering on top of hedging on top of more covering, and every link in the chain is a seller of the index or a buyer of volatility. The squeeze pushes down, not up.
This is why the people who think “shorts always get squeezed higher” got run over on Friday. They were right that there was a squeeze. They were wrong about which way it pointed.
10. Friday’s open confirmed it
Friday morning was almost a perfect illustration of the cascade. The futures came in modestly red overnight, nothing dramatic. But when you looked under the hood at the open, the crowd was leaning maximally bullish. People were buying 0DTE calls and longer-dated calls. Puts were being sold by default. The VIX was being sold by default. Everyone was positioned for the dip to be bought, the way it had been bought all year.


The trouble was that the tape was already sliding, and it kept sliding. Within minutes, all those fresh call buyers were offside. The calls started decaying fast, demand rotated into puts, and implied volatility began to climb. That forced the short-gamma dealers to sell index futures to stay hedged, which pushed the market lower, which lifted volatility more, which forced the VIX shorts to start covering. Each step fed the next. This cycle was continouing into the market close. Because more and puts were forced to be bought!

By the closing bell the loop had done its work. The VIX, which had been sitting at 15.40 on Thursday, closed at 21.51, up 39.7%.

For a sense of how the whole thing unfolded in motion, the same week looks like this when you play it forward.
11. The real catalyst: a good-looking jobs report ran straight into hot inflation
I have spent this whole piece arguing that Friday was a positioning event, and it was. But positioning still needs a match, and the match was the May jobs report that hit the tape Friday morning. Here is the trap, though, and it is the part most people get backwards: the jobs report was a problem precisely because it looked good.
On the surface it was strong. The Bureau of Labor Statistics reported that the US economy added 172,000 nonfarm jobs in May, against a consensus of roughly 80,000 - more than double what Wall Street expected. The unemployment rate held at 4.3%, low by any historical standard, and March and April were revised higher. The gains were broad, led as usual by the private sector and by services. A few economists waved at the World Cup, which kicks off in the US on June 11, as a one-off hiring booster. But booster or not, the print landed as unambiguously hot.

Normally a strong jobs report is good news for stocks. A growing economy means growing earnings. The reason this one was toxic is the backdrop it landed against: inflation was not only high, it was rising again. The most recent reading had headline CPI running at 3.8% over the prior year, the hottest since May 2023, with core inflation at 2.8%, both well above the Federal Reserve’s 2% target. The driver was energy - the war with Iran had pushed crude and gasoline sharply higher, with energy up 17.9% and gasoline up 28.4% over the year. Disinflation had stalled out near 2.4% and then reversed.

Put the two together and you get the squeeze that actually drove Friday. A hot labor market on its own, the Fed might look through. Hot inflation on its own, alongside a weakening jobs market, the Fed might still ease into. But a hot labor market on top of already-hot, re-accelerating inflation takes easing off the table entirely - and starts to push the conversation toward tightening. That is exactly what the market did. Traders repriced the next Fed move away from a cut and toward a hike, to the point of almost fully pricing a quarter-point increase by year-end, with the funds rate already sitting at 3.5% to 3.75%. This is the textbook “good news is bad news” regime: a strong economy that the market reads as a reason for higher rates.
The first place that repricing showed up was the bond market. Treasury yields jumped across the curve on Friday, and the sharpest move came at the short end, which is the most sensitive to Fed expectations. The 2-year yield spiked about 11 basis points to 4.16%, a multi-month high. The 10-year rose about 6 basis points to 4.54%, its highest since May 21. The 30-year pushed back above 5%. When the risk-free rate jumps like that in a single session, every other asset has to reprice against it.

From there the chain runs in a fairly straight line, and it is worth seeing it laid out, because each link pulled hard on the next.

The link that adds the most fuel is the dollar. The US Dollar Index, or DXY, measures the dollar against a basket of major currencies - the euro, yen, pound and a few others. It matters for stocks because a soft, falling dollar is a quiet tailwind for risk assets: it inflates nominal asset prices, eases global financial conditions and flatters the foreign earnings of US multinationals. A spiking dollar does the opposite, and it usually spikes for exactly the reason it did on Friday - higher US yields pulling capital in.
And the dollar was primed to spike, because it had been deeply oversold. It bottomed around 98 in mid-May, the low of this whole stretch, after grinding lower for weeks while everything risk-on ran. Underneath the price, the RSI was quietly carving a bullish divergence: the dollar ground to a marginally lower low in May while momentum turned up and made a higher low. That is the classic snap-back tell, and it rarely resolves gently. The snap came on Friday. The very same hot jobs report and yield surge that hammered the chips sent the dollar ripping 0.66% to 100.07, a two-month high. Yields up, dollar up, tech down - all three rhymed off the exact same catalyst.

So when you hear “it was just the jobs report,” remember it was never just one thing, and it was never really about the jobs at all. A good-looking print collided with hot inflation, that combination lit yields, yields lit the dollar, and an oversold dollar snapping back to a two-month high pulled one more support out from under a tape that was already leaning the wrong way.
So how rare is a one-day VIX explosion like Friday’s? Rarer than you might think. Going back to 1990, there have been only about 49 trading days where the VIX closed up 30% or more in a single session, out of roughly 9,200 trading days. That is around half of one percent of all days, or roughly 1.3 times per year on average - and they cluster in crises. The 2010s alone produced 22 of them, the 2020s have already produced 15, and the single biggest of all time remains that February 2018 Volmageddon close of +116%.

There is a more useful way to ask the question, though, because a single-day +30% print is a high bar and Friday’s setup was specific: a VIX sitting near a multi-month low that then rips higher. So I went back through every day since 1990 and counted only the squeezes that match what we actually traded - the VIX coming off a three-month low and then jumping 20% or more within the next two weeks. That has happened 81 times in 36 years, which works out to about 2.2 times a year. And here is the part that surprised even me: 62 of those 81 squeezes landed right inside the 20% to 40% band. Friday’s +39.7% sat at the top of the normal range, not off the charts.
The natural follow-up is whether these are becoming more common as markets get more systematic and more short-volatility product floods in. The honest answer from the data is no, not really. Slice it into five-year buckets and the rate barely moves - it sits between roughly 1.4 and 2.8 squeezes a year in every single period since 1990, with no clear trend up or down. A VIX squeeze off a low base is not some new, exotic risk born of modern market structure. It is a structural feature of how volatility behaves, roughly twice a year, every year, for as long as the index has existed. Which means the only real question was never if, but when - and whether you were positioned for it or against it.

12. The summary: I wanted a vol squeeze, and a vol squeeze is what we got
In the end the setup played out almost exactly as the checklist suggested. A market that had spent weeks selling volatility into a melt-up, with crowded short-vol positioning, no hedges, a flipped put-buying signal, a leaking NVIDIA and a parabolic chip complex, met a hot jobs report and a yield shock on the single most volatility-prone day of the week. The shorts got squeezed in volatility and in puts, the dealers hedged into the move, and the index cascaded lower.

The chip selloff alone wiped more than a trillion dollars of market value off the board, with Broadcom down nearly 8%, Marvell and Micron down double digits, and Intel and AMD off around 11%. The Mag 7 fell together - Tesla was the hardest-hit mega-cap at roughly 6.6%, with Nvidia and Meta in the mid-single digits and even the steadiest names finishing in the red.

None of this means the bull market is over. One violent session does not end a trend, and a 39% VIX spike is exactly the kind of move that can mean-revert quickly if the positioning resets and the dip-buyers come back. But it is a useful reminder of how these things actually work. The market does not crash because the news is bad. It crashes because everyone is positioned the same way, nobody is hedged, and a perfectly ordinary catalyst lands on a coiled spring.
Watch the volatility complex, not just the index. Watch who is hedged and who is not. Watch the flow flip before the price does. That is the whole edge, and it is hiding in plain sight in the data every single week.
I will keep posting the charts. Thanks for reading.
Nothing here is investment advice. I am sharing my own reasoning and my own positioning, and I can be wrong. Do your own work and size your risk accordingly.
Sources
S&P 500, Nasdaq, Dow and Russell 2000 closing levels and the June 5 selloff narrative: Associated Press (https://apnews.com/article/b9d2661cbba6cc326c618c06769d8291); CNBC (https://www.cnbc.com/2026/06/04/stock-market-today-live-updates.html); Bloomberg (https://www.bloomberg.com/news/articles/2026-06-04/asian-stocks-poised-to-edge-lower-oil-steadies-markets-wrap); TheStreet (https://www.thestreet.com/stock-market-today/stock-market-today-dow-jones-sp-500-nasdaq-updates-june-05-2026).
VIX close of 21.51 (+39.68%) and prior close of 15.40: Cboe VIX product page (https://www.cboe.com/en/tradable-products/vix/); Yahoo Finance VIX history (https://finance.yahoo.com/quote/%5EVIX/history/). VIX daily-close history since 1990 used for the spike-frequency analysis: FRED VIXCLS (https://fred.stlouisfed.org/series/VIXCLS); Cboe VIX historical data (https://www.cboe.com/tradable_products/vix/vix_historical_data/).
Chip selloff erasing more than $1 trillion in value, and individual semiconductor moves (Broadcom, Marvell, Micron, Intel, AMD) and the PHLX Semiconductor Index drop: Reuters (https://www.reuters.com/business/media-telecom/chip-selloff-erases-over-1-trillion-stock-market-value-2026-06-05/); Trading Economics US market summary (https://tradingeconomics.com/united-states/stock-market). Hot jobs report, rising Treasury yields and the tech unwind: Reuters (https://www.reuters.com/business/quote-box-hot-jobs-report-rising-rates-send-wall-streets-tech-favorites-2026-06-05/); MarketWatch (https://www.marketwatch.com/story/large-cap-chip-stocks-are-leading-markets-sharp-friday-selloff-here-are-3-reasons-why-97b7ea9b).
US employment data - total nonfarm payrolls, private and government employment, service-providing employment, the unemployment rate and average hourly earnings: US Bureau of Labor Statistics via FRED (PAYEMS https://fred.stlouisfed.org/series/PAYEMS; USPRIV https://fred.stlouisfed.org/series/USPRIV; USGOVT https://fred.stlouisfed.org/series/USGOVT; SRVPRD https://fred.stlouisfed.org/series/SRVPRD; UNRATE https://fred.stlouisfed.org/series/UNRATE). S&P 500 and Nasdaq Composite index history: FRED (https://fred.stlouisfed.org/series/SP500; https://fred.stlouisfed.org/series/NASDAQCOM). Treasury yields and the June 5 spike (2-year, 10-year and 30-year): FRED (DGS2 https://fred.stlouisfed.org/series/DGS2; DGS10 https://fred.stlouisfed.org/series/DGS10; DGS30 https://fred.stlouisfed.org/series/DGS30) through June 4, with the June 5 closing levels from CNBC (https://www.cnbc.com/2026/06/05/treasury-yields-ease-as-traders-await-key-labor-market-data-.html), TradingEconomics (https://tradingeconomics.com/united-states/government-bond-yield) and Charles Schwab (https://www.schwab.com/learn/story/weekly-traders-outlook), all of which also describe the market repricing the next Fed move toward a hike.
Inflation - the April 2026 CPI running at 3.8% headline (highest since May 2023) and 2.8% core, with energy up 17.9% and gasoline up 28.4% over the year, and the federal funds rate at 3.5% to 3.75%: CNBC’s April 2026 CPI report (https://www.cnbc.com/2026/05/12/cpi-inflation-april-2026-.html); the U.S. Bureau of Labor Statistics CPI release (https://www.bls.gov/news.release/cpi.nr0.htm and https://www.bls.gov/cpi/); CNBC’s April 2026 PPI report on the rate path (https://www.cnbc.com/2026/05/13/ppi-inflation-report-april-2026-.html).
US Dollar Index (DXY) - the June 5 close of 100.07 (+0.66%) and the two-month-high context: TradingEconomics (https://tradingeconomics.com/united-states/currency); the May 29 ICE close (98.94) cross-checked at Yahoo Finance (https://finance.yahoo.com/quote/DX-Y.NYB/history/). The March 30 to May 29 daily path was reconstructed from Federal Reserve H.10 reference exchange rates using the ICE U.S. Dollar Index weighting formula (DEXUSEU https://fred.stlouisfed.org/series/DEXUSEU; DEXJPUS https://fred.stlouisfed.org/series/DEXJPUS; DEXUSUK https://fred.stlouisfed.org/series/DEXUSUK; DEXCAUS https://fred.stlouisfed.org/series/DEXCAUS; DEXSDUS https://fred.stlouisfed.org/series/DEXSDUS; DEXSZUS https://fred.stlouisfed.org/series/DEXSZUS).
VIX futures positioning (non-commercial longs, shorts and net): CFTC Commitments of Traders, VIX Futures (https://www.cftc.gov/dea/futures/deacboelf.htm). Put/call ratios and the equity-only five-day average at the lowest since March 30, 2022: Cboe daily market statistics (https://www.cboe.com/markets/us/options/market-statistics/daily/); MarketWatch (https://www.marketwatch.com/story/investors-are-piling-into-bullish-options-bets-another-sign-that-the-stock-market-is-getting-overheated-96c5fd15); Investopedia put/call ratio explainer (https://www.investopedia.com/ask/answers/06/putcallratio.asp).
S&P 500 weights and concentration, and mega-cap snapshots: SlickCharts (https://www.slickcharts.com/sp500). SOXL daily prices and the 30.5% decline: StockAnalysis (https://stockanalysis.com/etf/soxl/history/); SOXL technical snapshot: AASTOCKS (https://www.aastocks.com/en/usq/quote/quote.aspx?symbol=SOXL).
Volmageddon, the XIV collapse and the February 2018 short-volatility unwind: Credit Suisse’s XIV acceleration announcement, SEC Form 6-K dated February 6, 2018 (https://www.sec.gov/Archives/edgar/data/0001053092/000095010318001572/dp86358_ex9901.htm); etf.com on the inverse-VIX product shutdown and its $1.9 billion in assets (https://www.etf.com/sections/news/inverse-vix-etn-shuts-down); The Motley Fool on the XIV and SVXY net-asset-value collapse from $108.37 to $4.22 (https://www.fool.com/investing/2018/02/06/the-simple-math-behind-the-inverse-volatility-etf.aspx); CNBC on the investor lawsuit and Credit Suisse’s response that it had hedged the product and that it was legitimate (https://www.cnbc.com/2018/03/14/credit-suisse-lawsuit-velocityshares-daily-inverse-vix-short-term-etn.html); CFA Institute (https://rpc.cfainstitute.org/research/financial-analysts-journal/2021/volmageddon-failure-short-volatility-products); AMF France research on the February 2018 volatility episode (https://www.amf-france.org/sites/institutionnel/files/contenu_simple/lettre_ou_cahier/risques_tendances/Heightened%20volatility%20in%20early%20February%202018%20the%20impact%20of%20VIX%20products.pdf). The reflexive-feedback simulation is a stylized illustration; the underlying leveraged and inverse-fund rebalancing mechanics follow S&P Global VIX-futures research (https://www.spglobal.com/spdji/en/documents/campaigns/accesstovolatilityvialistedfutures_update_nov11_final.pdf) and Cboe VIX futures specifications (https://www.cboe.com/tradable_products/vix/vix_futures/).
US-Iran diplomacy and the peace-headline backdrop: Reuters (https://www.reuters.com/world/china/global-markets-global-markets-2026-05-27/); Associated Press (https://apnews.com/article/iran-us-rubio-talks-c4be639e938fa57533f28f9fd62fb43b; https://apnews.com/article/c1bbda07dfff9f35be657b65f344202b); Al Jazeera (https://www.aljazeera.com/news/2026/6/2/irans-supreme-leader-appears-more-active-as-talks-continue-uss-rubio); Reuters Broadcom/Nasdaq futures (https://www.reuters.com/business/nasdaq-futures-lead-declines-after-broadcom-drop-2026-06-04/); Investing.com (https://www.investing.com/news/stock-market-news/us-stock-futures-rise-with-focus-on-iran-peace-deal-payrolls-4717974).


Interesting reading. Thank you