
The VIX: When Wall Street Starts Sweating Part 1 — The “fear gauge” explained like you’re not a quant.
If the stock market had a stress thermometer, it’d be the VIX.

You’ll see it on red days. You’ll hear it on CNBC. And if you’ve ever thought “okay… but what is this number?” — this is your Part 1.
This article is all about the basics:
what the VIX is (in normal-person language)
why it was created (quick origin story)
how it’s calculated (no math torture)
how stocks push the VIX around
and how the VIX can push stocks right back
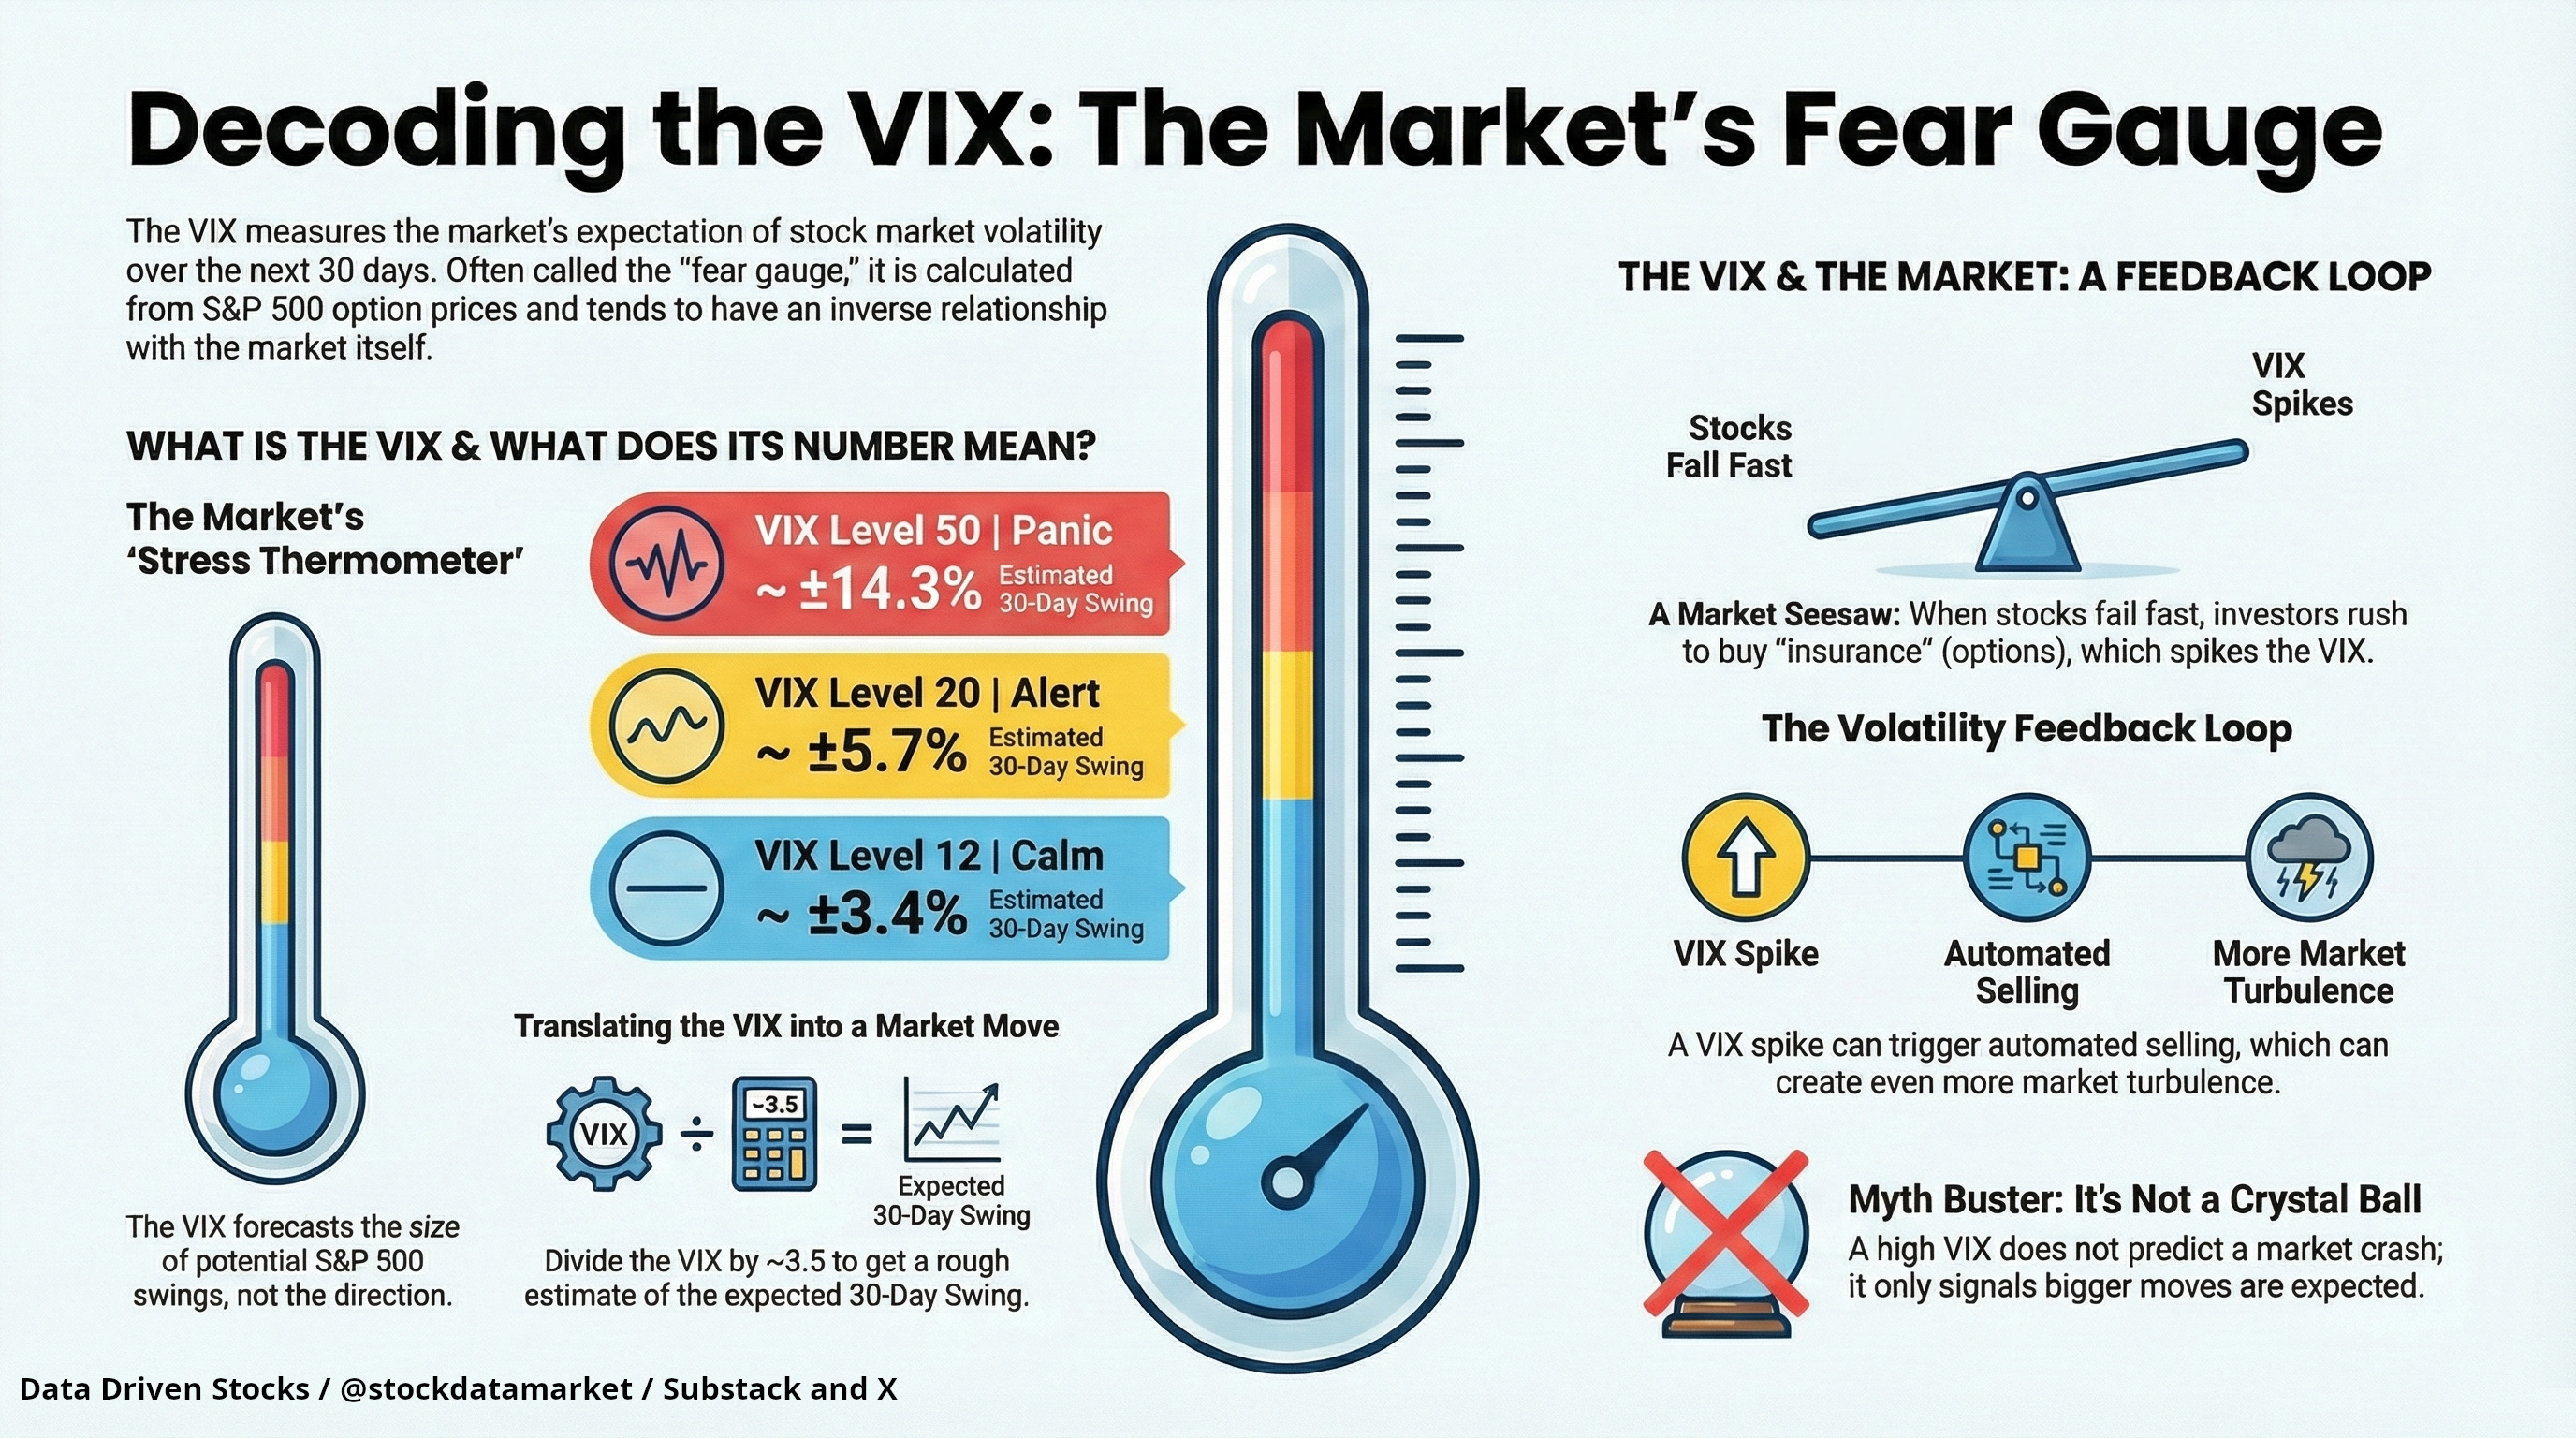
So… what is the VIX?
The VIX is a number that estimates how wild the S&P 500 might swing over the next ~30 days.
Not “up” or “down.” Just how violent the moves could be.
Think of it like:
Weather forecast: “Stormy” doesn’t tell you which direction the wind blows. It tells you how bad it might get.
Insurance price: When people are scared, they buy more insurance → insurance gets expensive → VIX goes up.
That’s why the VIX gets nicknames like “fear gauge.” The VIX is basically the market saying:
“I’m not sure what’s next, so I’m paying up for protection.”
The mini origin story: how VIX started (and why)
Back in 1993, Cboe launched the VIX as a way to measure the market’s expectation of 30‑day volatility using at‑the‑money S&P 100 (OEX) option prices.
Translation:
People wanted a simple, real-time volatility benchmark. A dashboard number for “how nervous is the market?”
Then in 2003, Cboe (working with Goldman Sachs) updated the VIX methodology into what most people mean by “VIX” today:
based on S&P 500 (SPX) options
using a wide range of strike prices (not just at-the-money)
designed to represent a cleaner “expected volatility” signal from options prices
After that, volatility went from “concept” to “thing you can actually trade/hedge” (but we’ll save the trading products for Part 2).
What “expected volatility” actually means
Expected volatility = the market’s best guess of how bumpy the next month might be. Not whether we go up or down — just how big the swings could be.
A super normal-person analogy:
Expected volatility is the weather forecast: “Chance of storms.”
Realized volatility is the weather that actually happened: “Yep, it poured.”
And here’s the key: the VIX is built from option prices, which are basically “insurance prices” for the S&P 500. When traders expect bigger moves, they pay more for that insurance — and that pushes the VIX higher.
One more thing (so nobody misreads the number):
Expected doesn’t mean guaranteed. The VIX is an estimate — markets can still move more (or less) than what was priced in
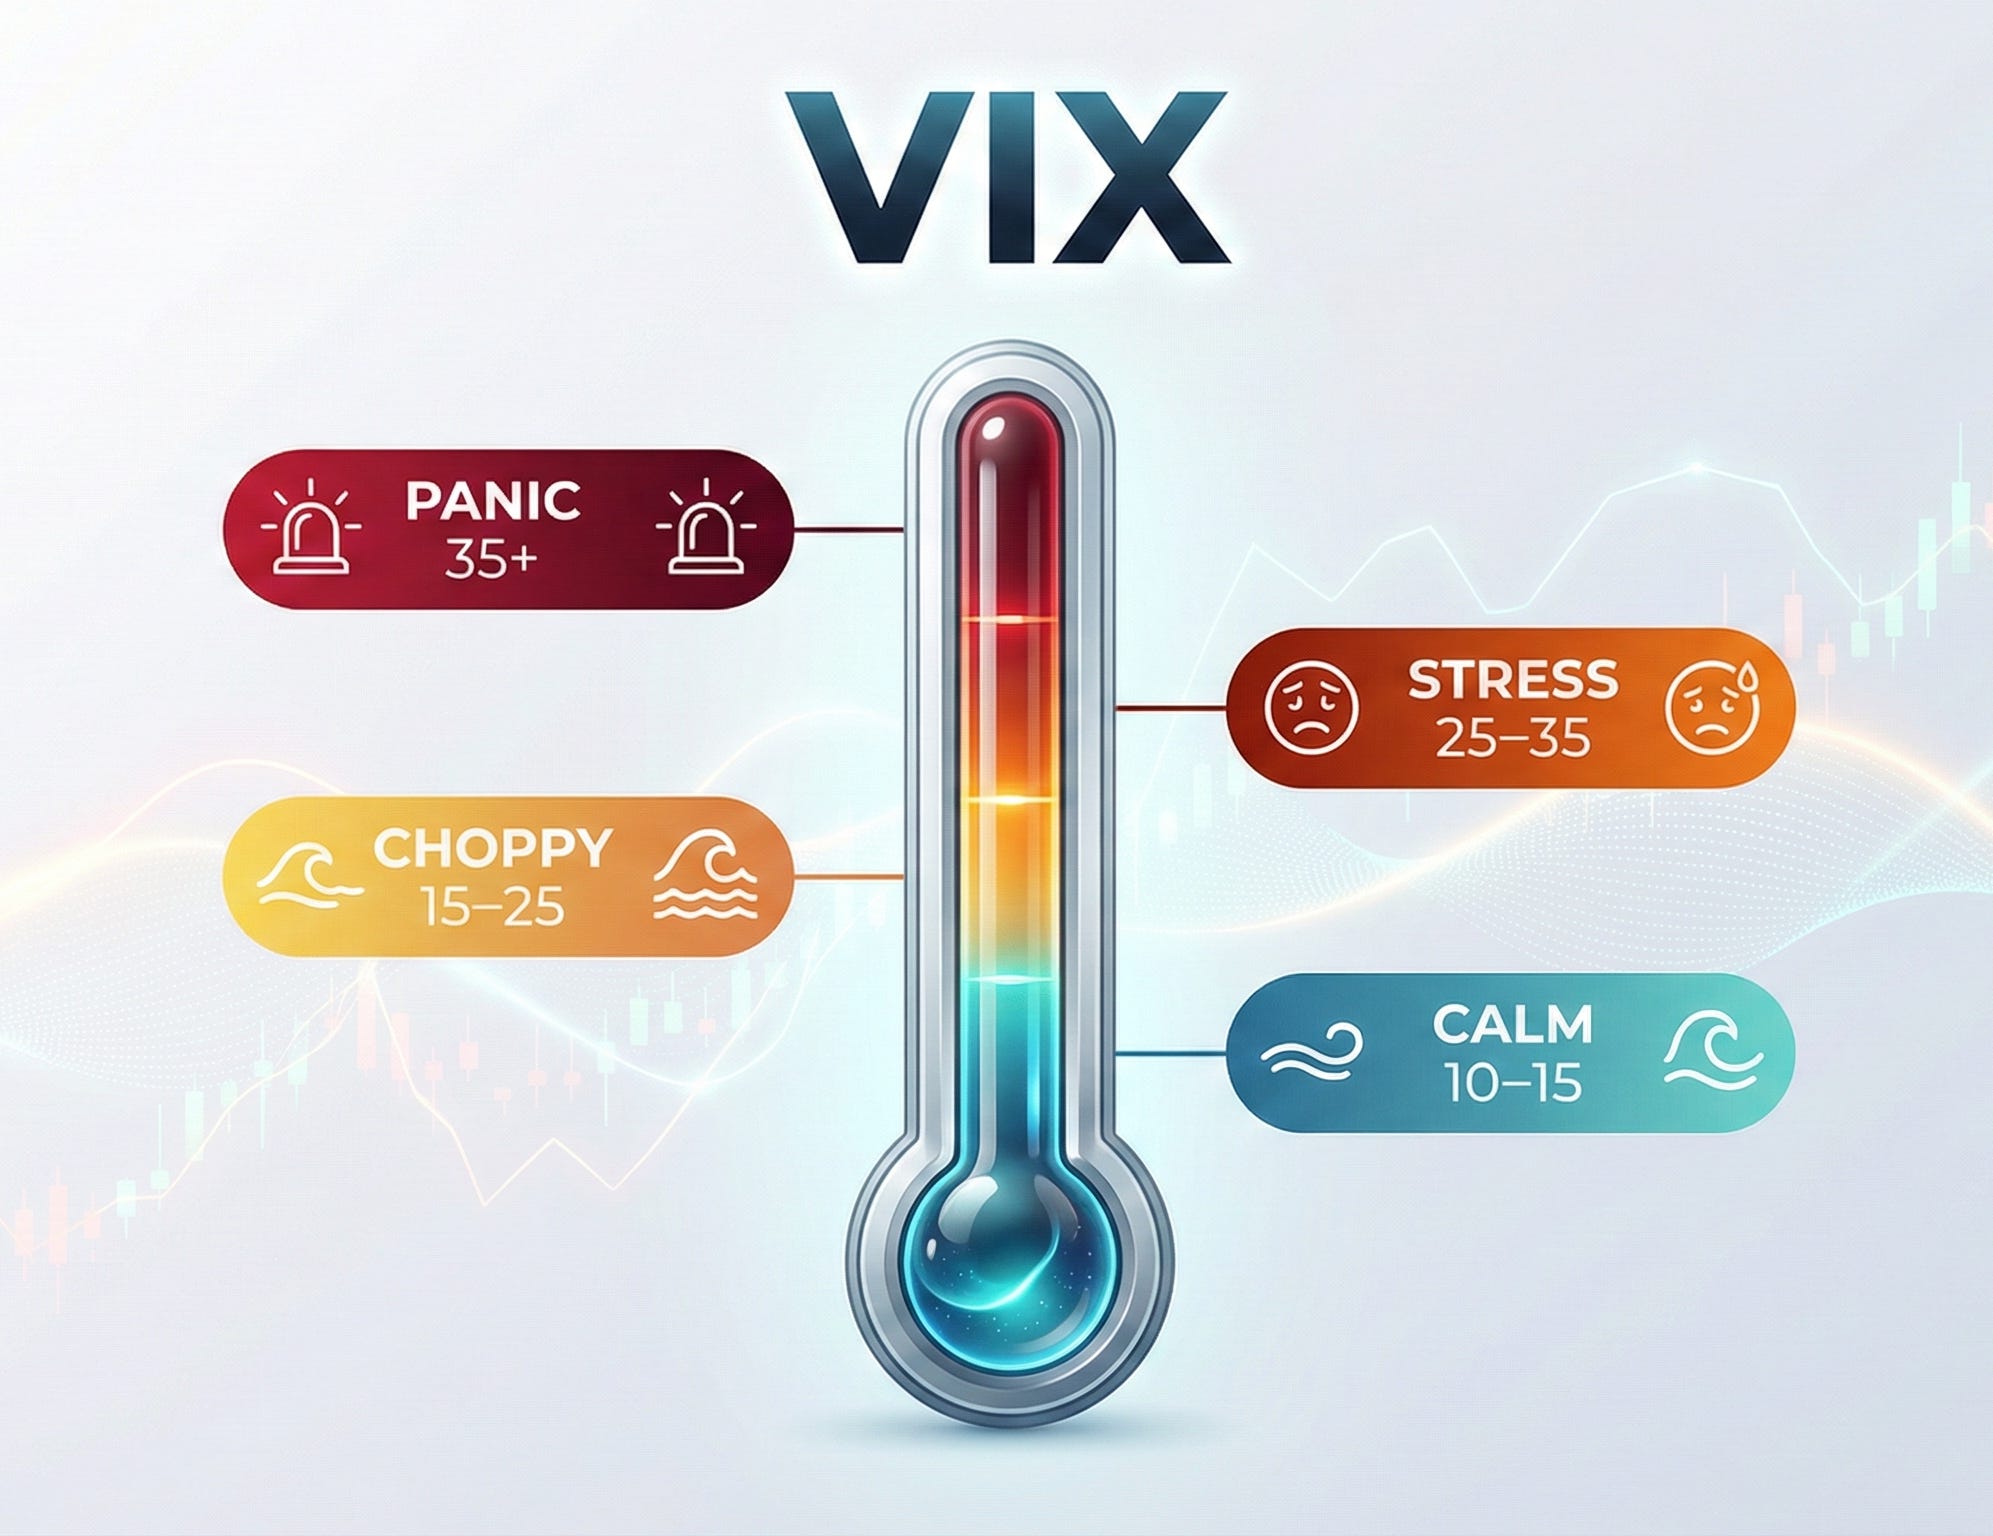
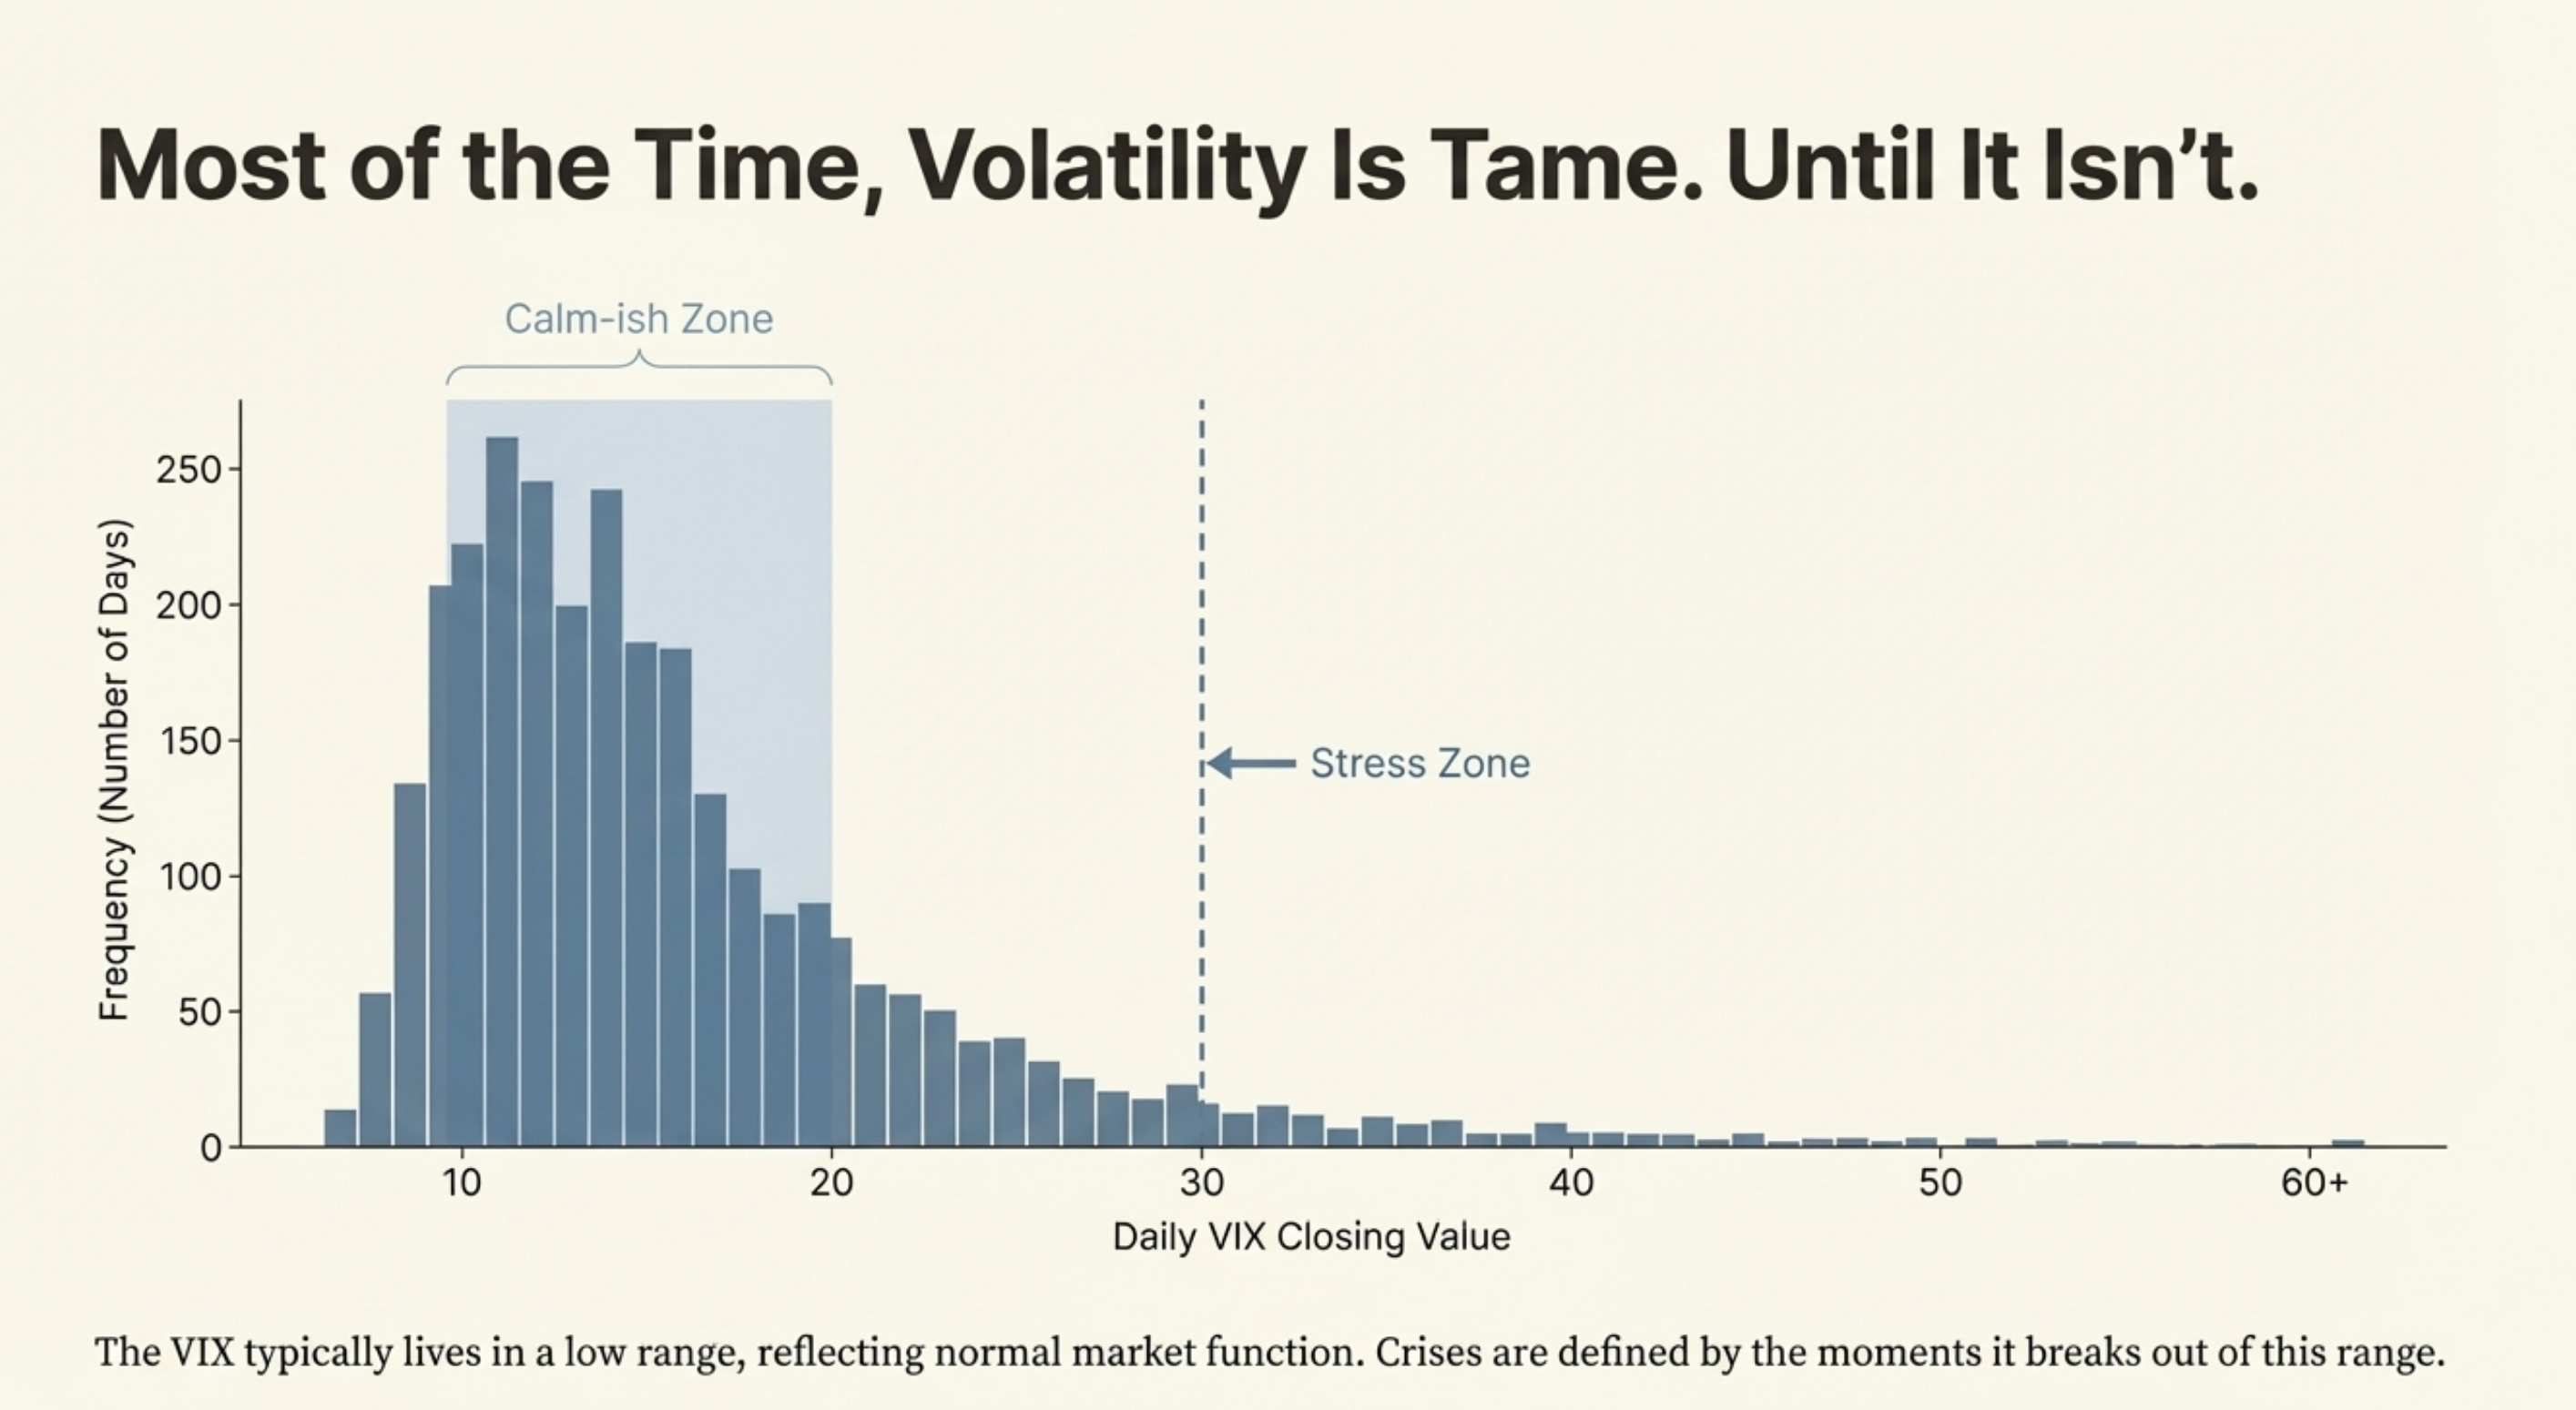
How to read the VIX number (this is the part everyone skips)
The VIX is quoted like a percentage… but it’s best thought of as annualized expected volatility.
So if the VIX is 20, the market is roughly pricing in something like 20% annual volatility.
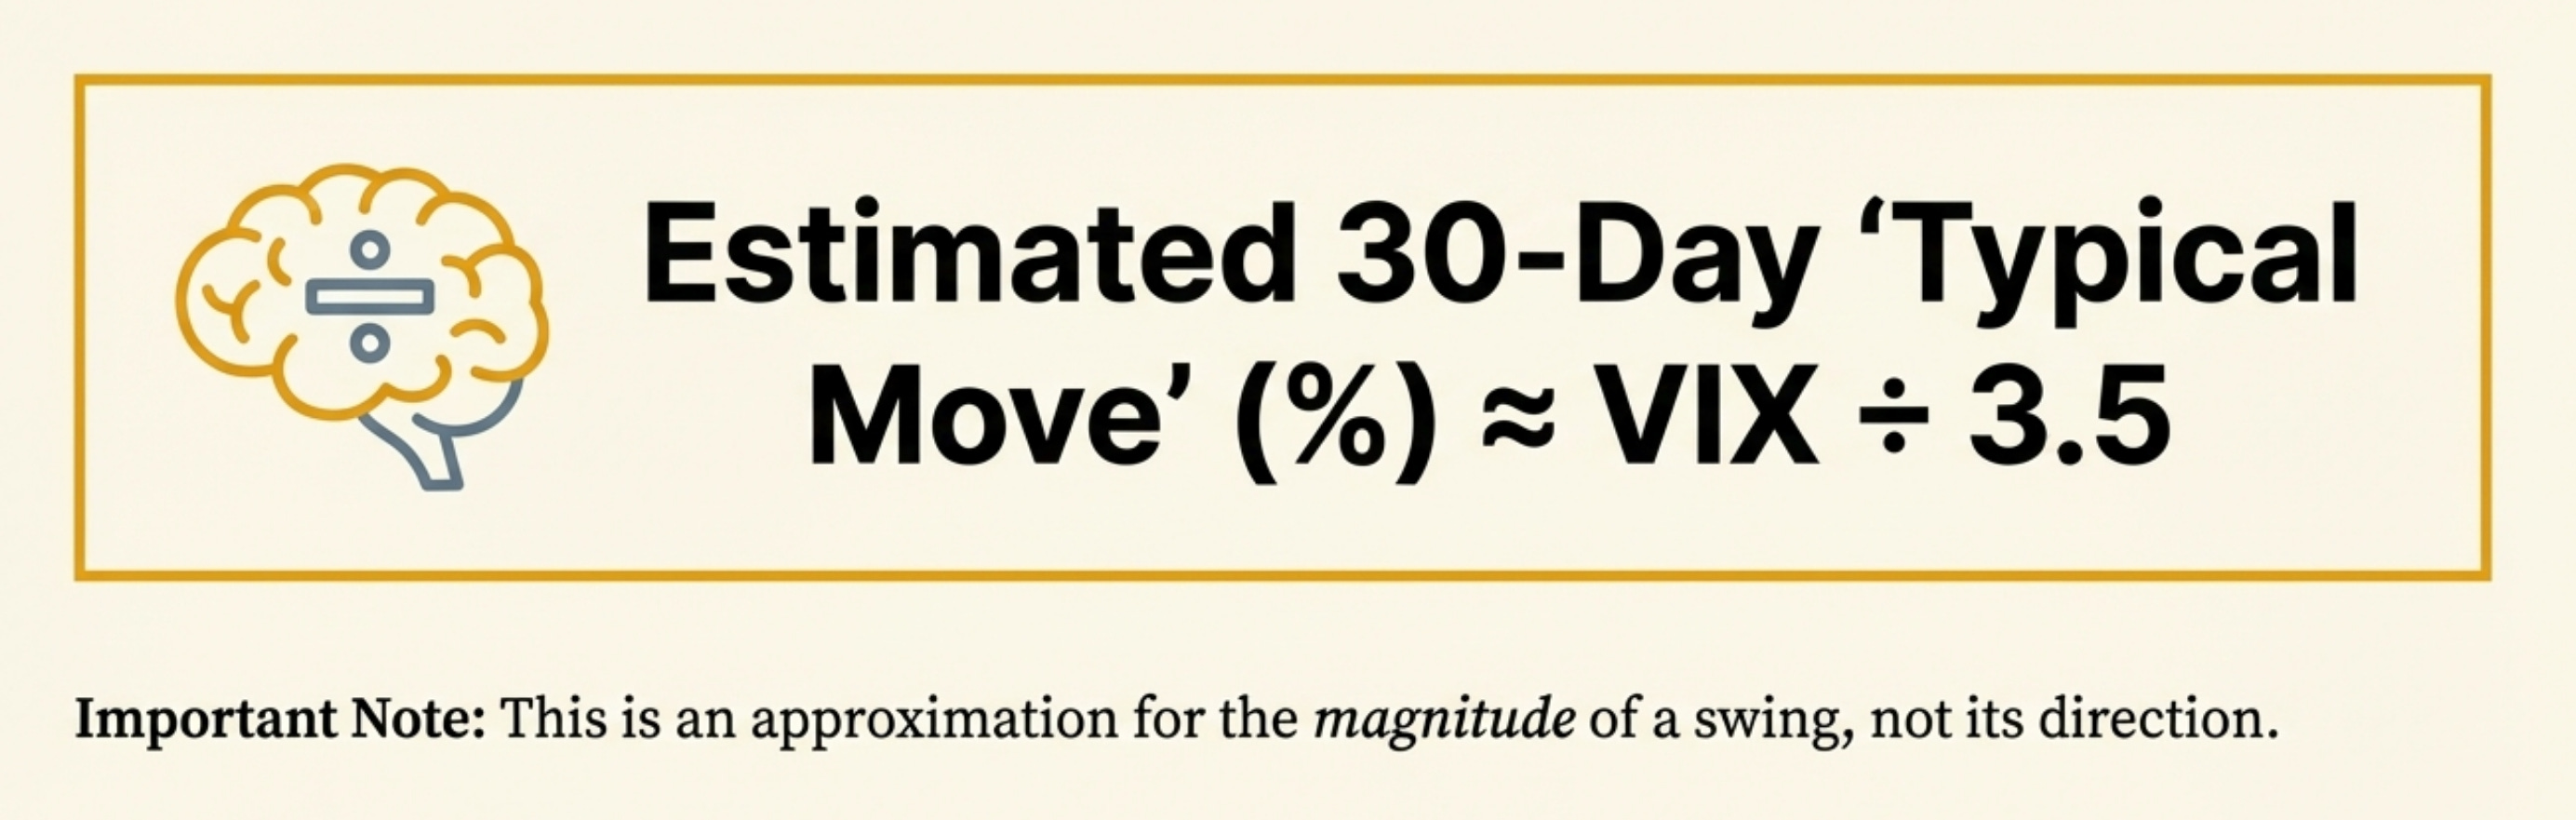
But you probably care about the next month. Here’s the simple mental math:
Estimated 30‑day “typical move” ≈ VIX ÷ 3.5
Examples (very rough, but useful):
VIX 12 → about ±3.4% over ~30 days (typical swing)
VIX 20 → about ±5.7%
VIX 30 → about ±8.6%
VIX 50 → about ±14.3%
Two important “don’t-get-it-twisted” notes:
This is about magnitude, not direction.
It’s an expectation, not a promise. Markets can easily do more (or less).
How the VIX is calculated (no, you don’t need the full formula)
Under the hood, the VIX is built from S&P 500 index option prices.
What options prices really contain is the market’s collective opinion about future volatility — because option prices rise when traders expect bigger swings.
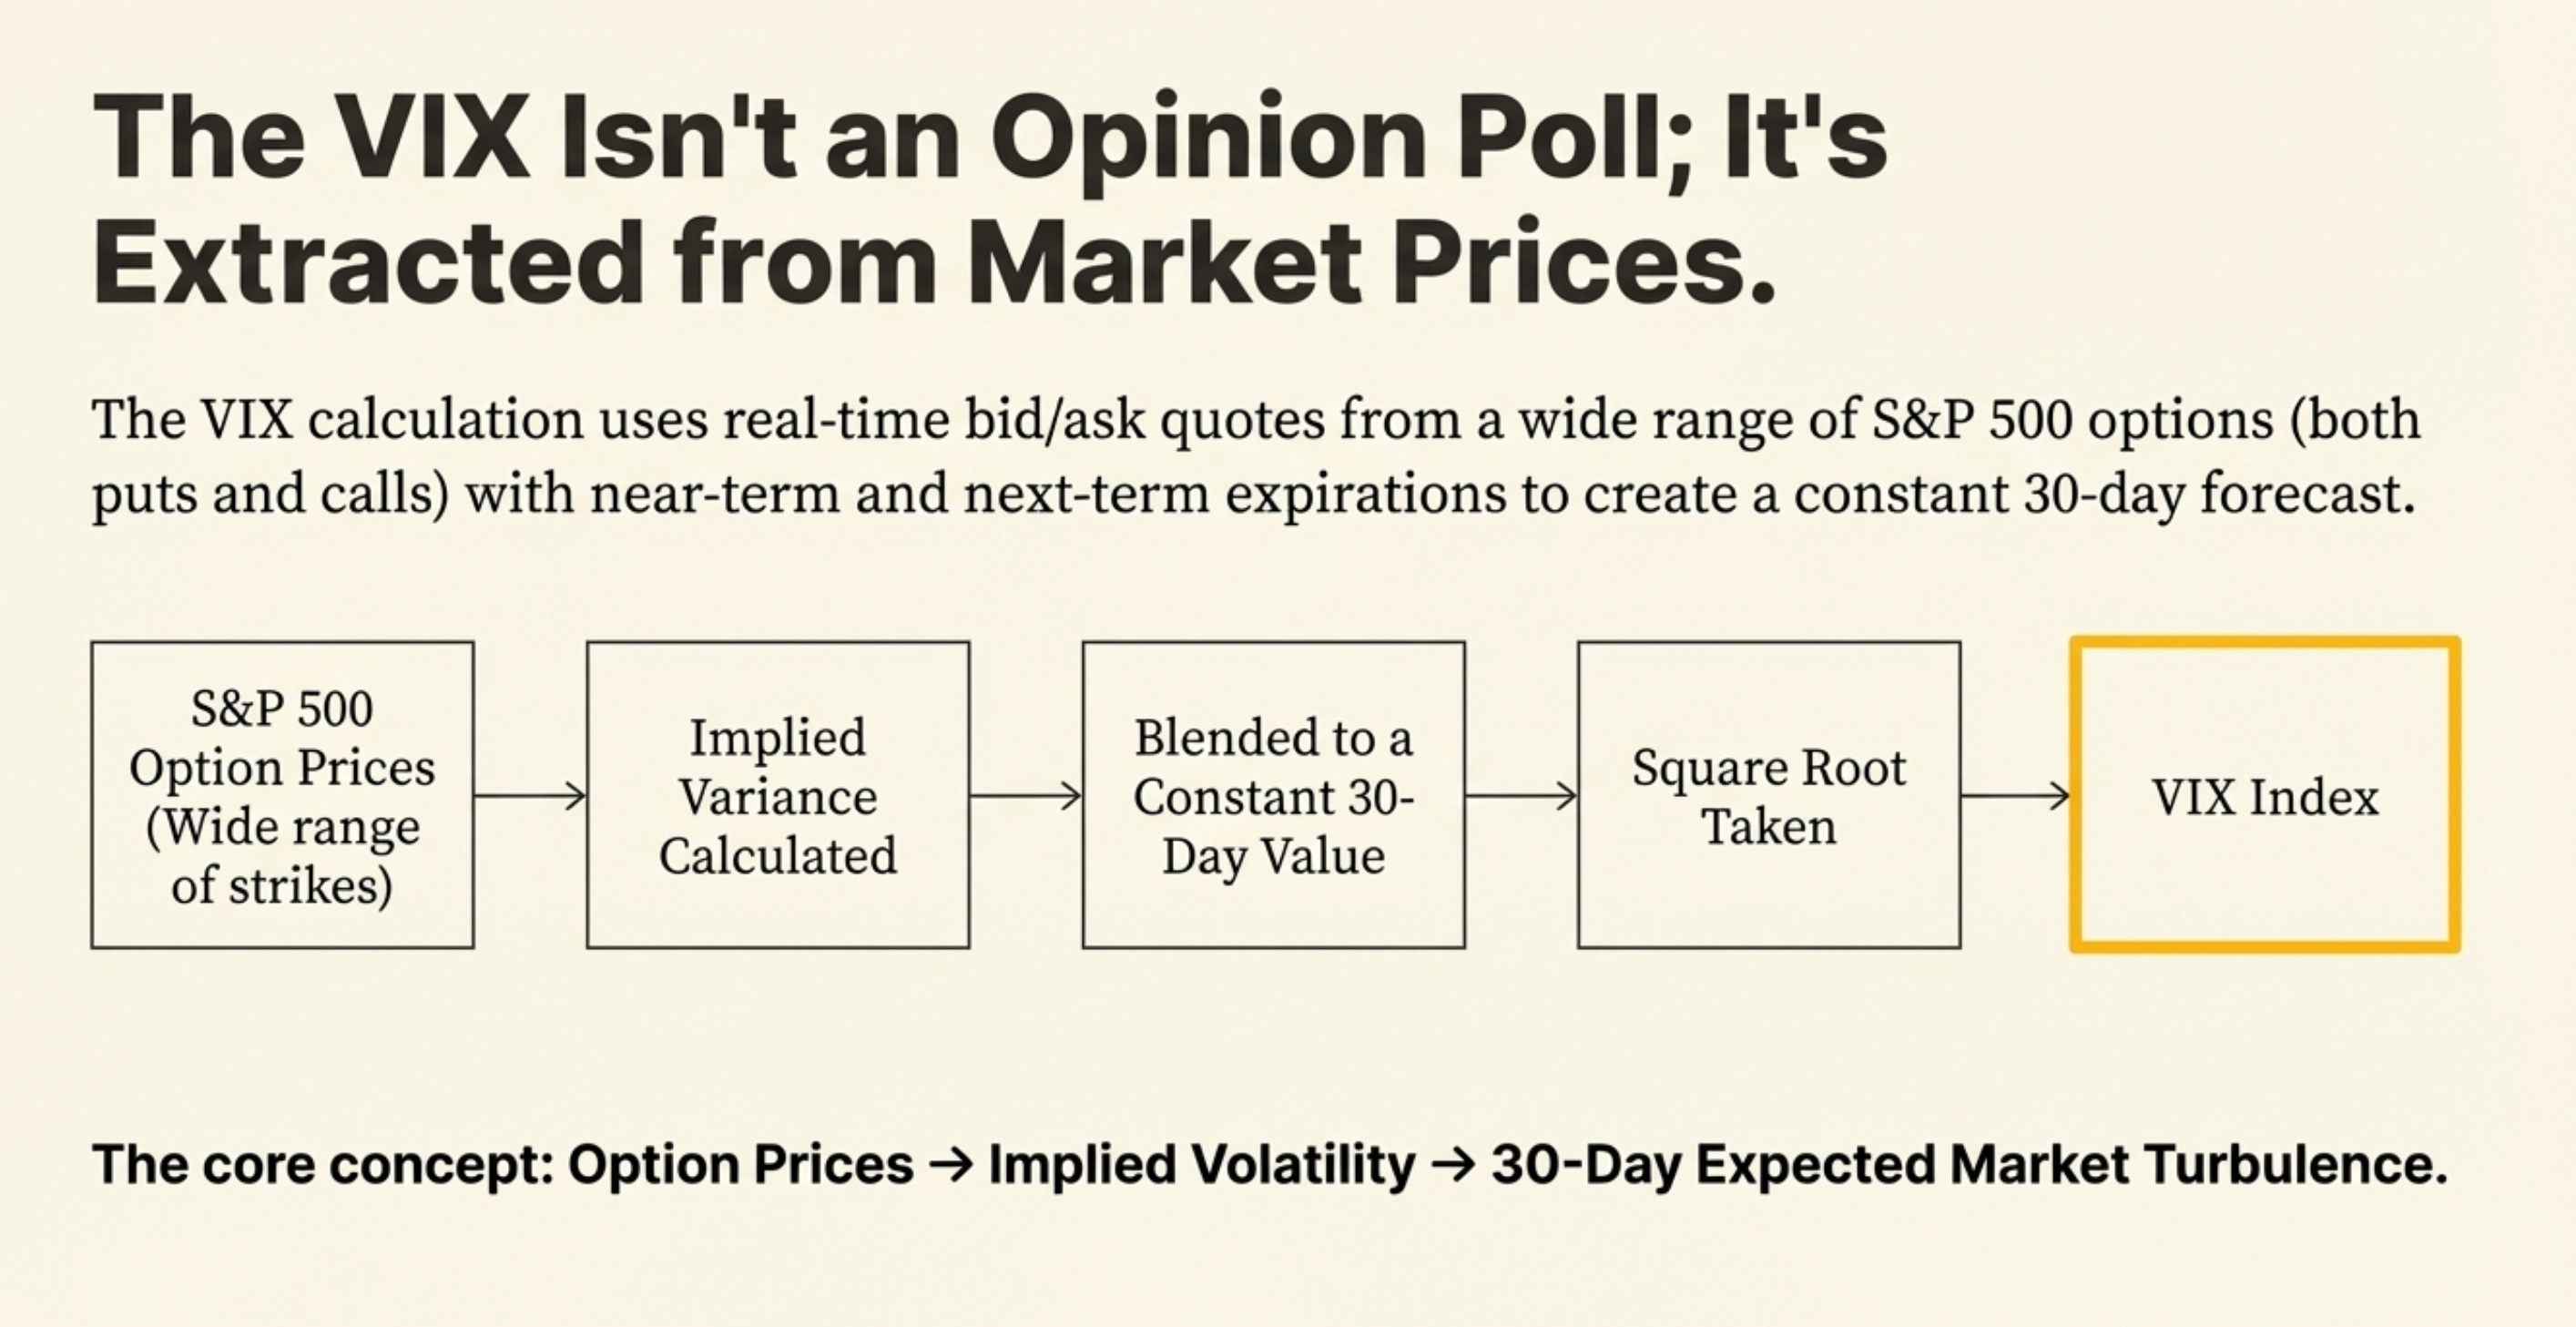
Here’s the “human version” of the VIX calculation:
Step 1: Look at S&P 500 options near 30 days out
The VIX uses two option expirations:
a near-term set
a next-term set
…chosen so the result can be blended into a constant 30‑day measure.
Step 2: Use real option prices (not vibes)
It uses the midpoint of bid/ask quotes for lots of options.
Step 3: Use lots of strikes, especially out-of-the-money
Not just one option. Not just at-the-money.
The VIX aggregates information from a range of strike prices (puts and calls).
Step 4: Turn that into “expected variance,” then take a square root
The math produces an implied variance estimate (variance = volatility squared).
Then it takes the square root (to get volatility) and scales it to a VIX number.
The key concept:
Option prices → implied volatility → 30‑day expected market turbulence
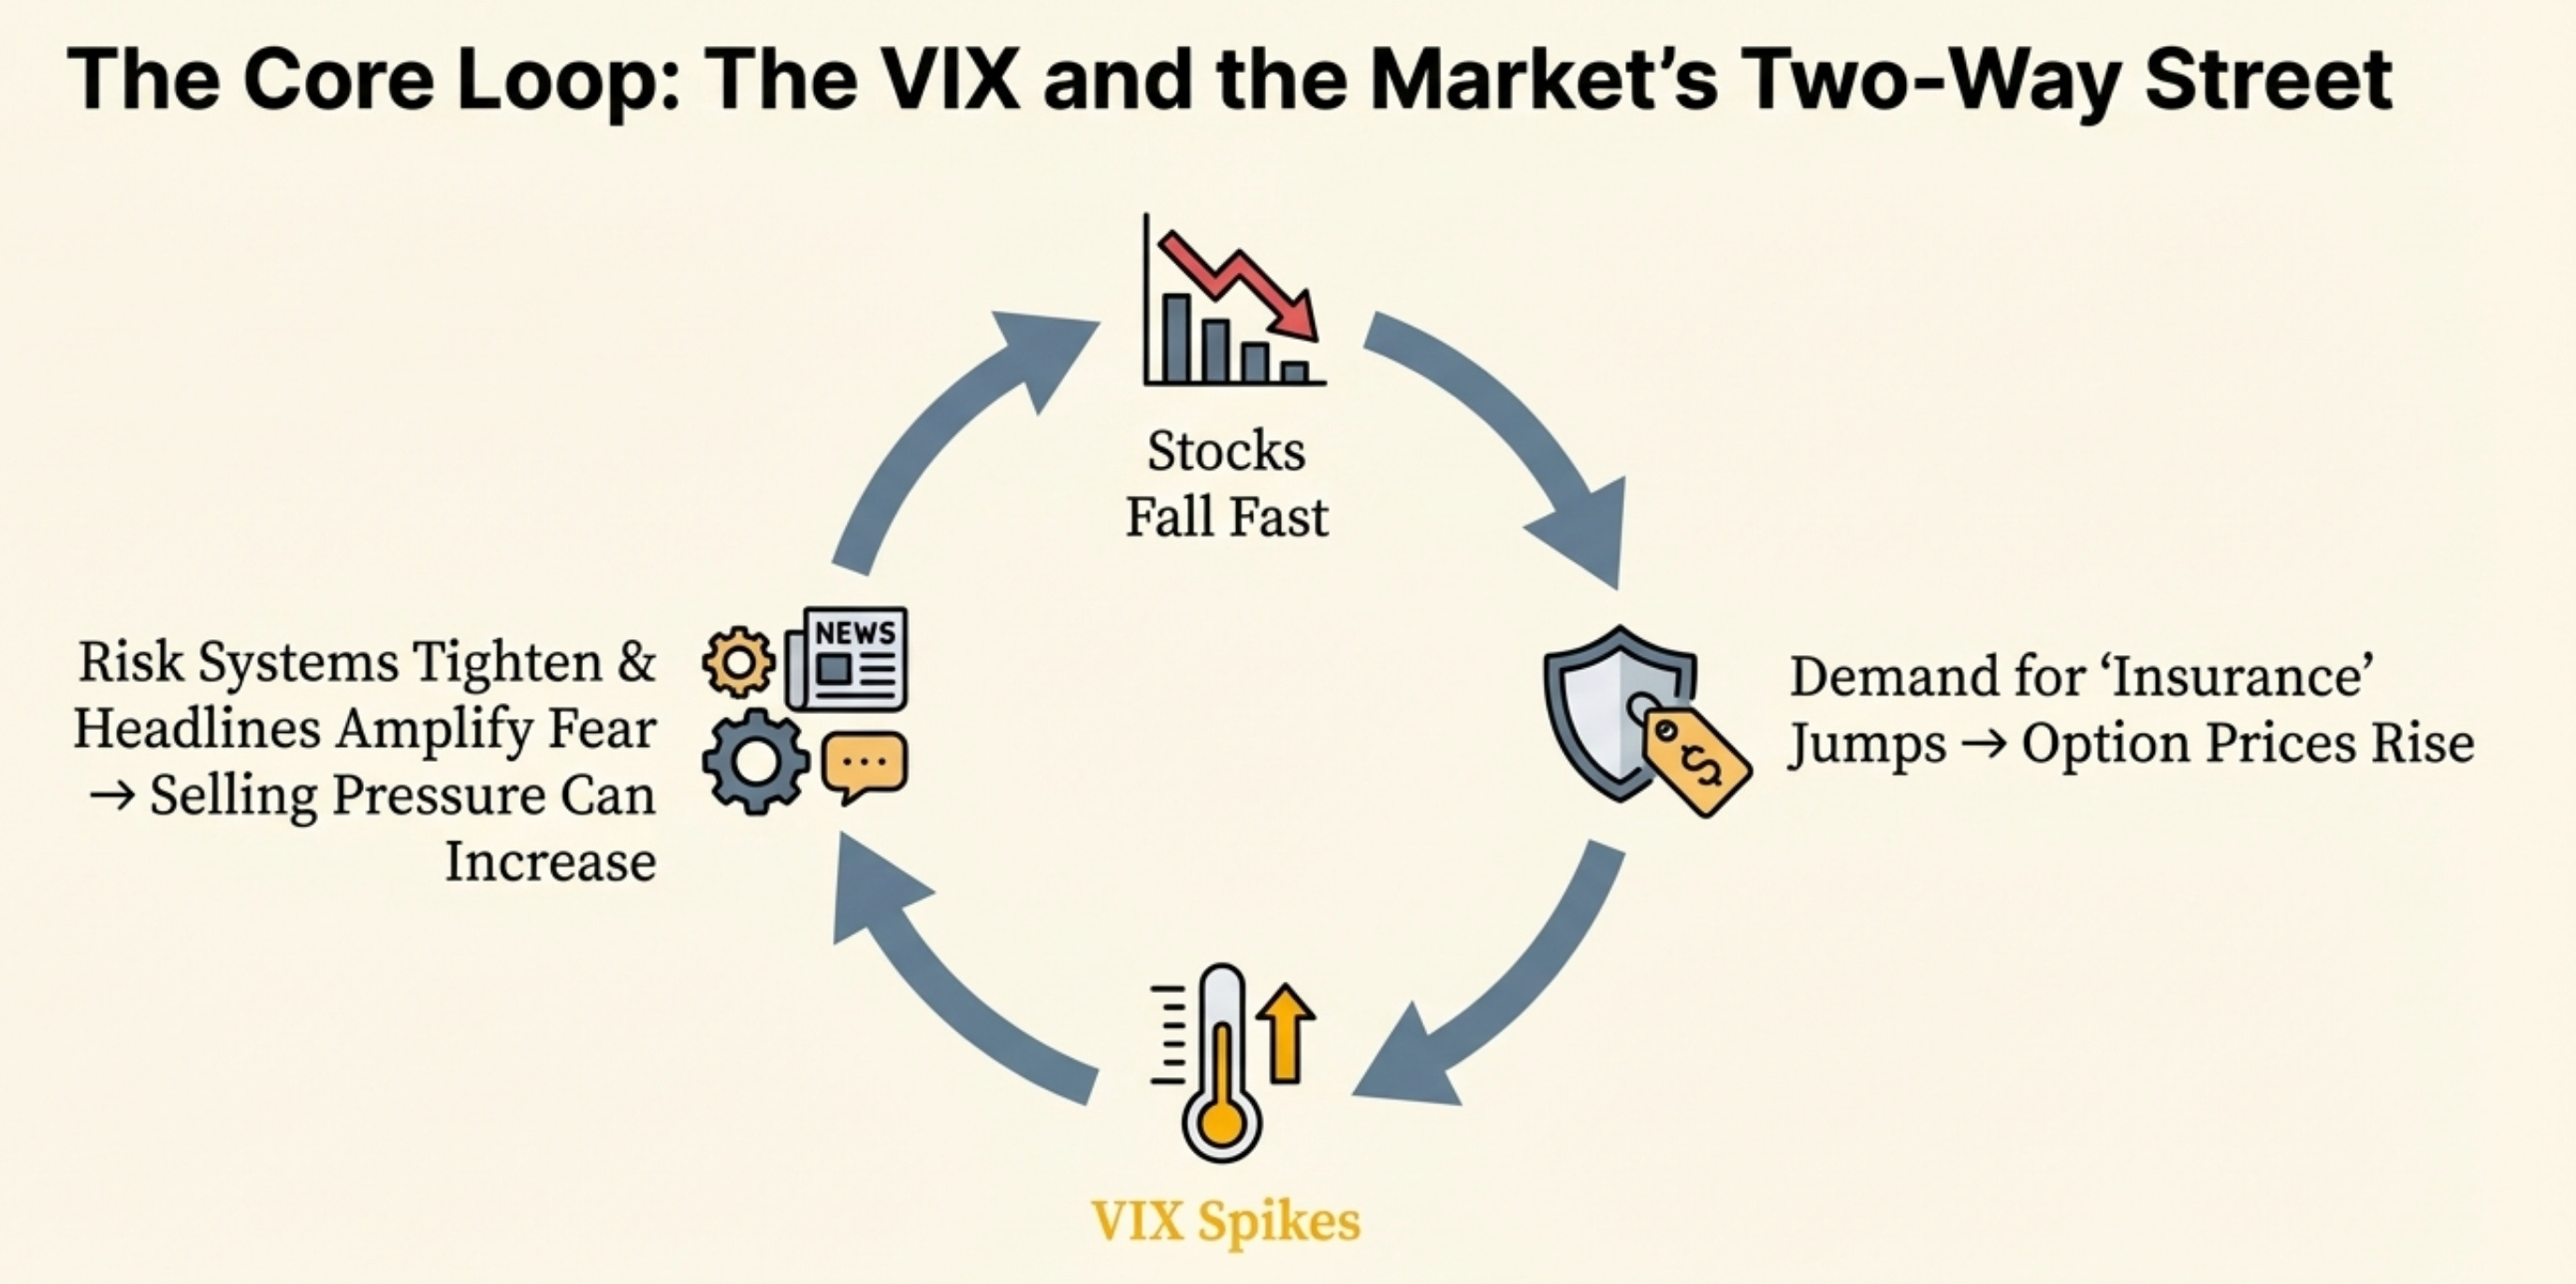
How the stock market influences the VIX
This relationship is why the VIX feels like it has a personality.
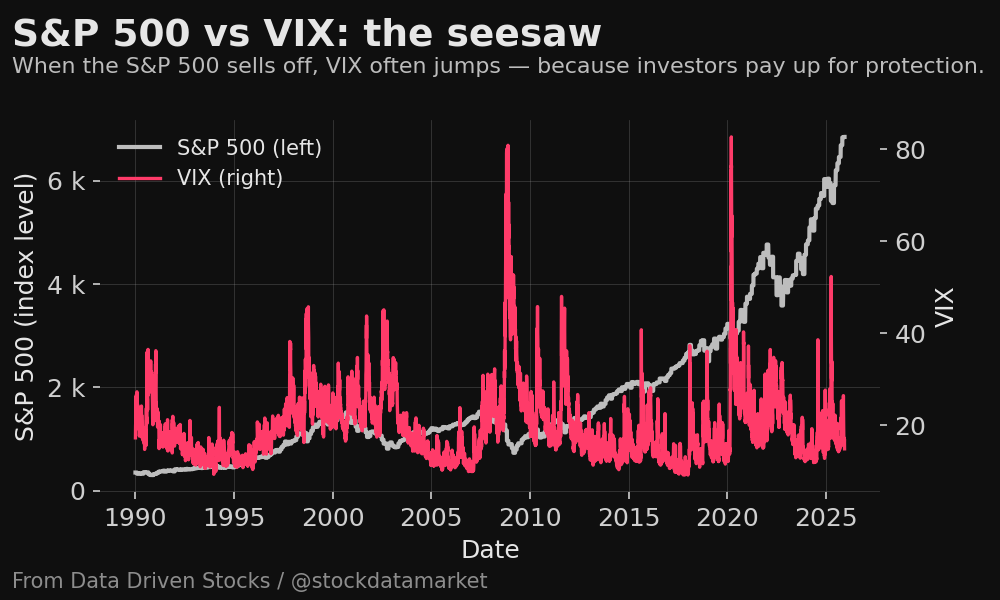
When stocks drop fast → VIX usually spikes
Why?
Because people rush to buy protection (puts).
More demand for protection → higher option prices → higher implied volatility → higher VIX.
Also, markets tend to fall faster than they rise. That “downside panic” effect gets priced into options quickly.
When stocks grind up calmly → VIX tends to fade
No one’s buying “insurance” aggressively.
Volatility expectations chill out.
VIX drifts lower.
So yes, the VIX often moves like an inverse shadow of the S&P 500.
Not always tick-for-tick. But the relationship is real enough to be famous.
How the VIX influences the stock market (the feedback loop)
Important framing: VIX is mostly a measurement, not a remote control.
But measurement can become influence when enough big money uses it.
Here are the main “feedback loop” channels:
1) Risk management kicks in
When volatility rises, a lot of strategies automatically reduce risk:
volatility targeting funds
risk parity approaches
some systematic trend/CTA setups (depending on design)
Higher VIX → “risk looks expensive” → reduce exposure → selling pressure.
2) Options hedging can amplify moves
When volatility rises and the market moves sharply, option market makers may hedge dynamically. That hedging activity can add fuel to short-term moves (especially during stress).
3) Psychology + headlines
“VIX spike” becomes a headline. Headlines become positioning.
Positioning becomes price.
So the VIX can help create a self-fulfilling cycle:
fear rises → VIX rises → people de-risk → market gets choppier → VIX stays high
Again: not guaranteed, not magical. But it’s a real behavioral + mechanical loop.
What VIX is NOT
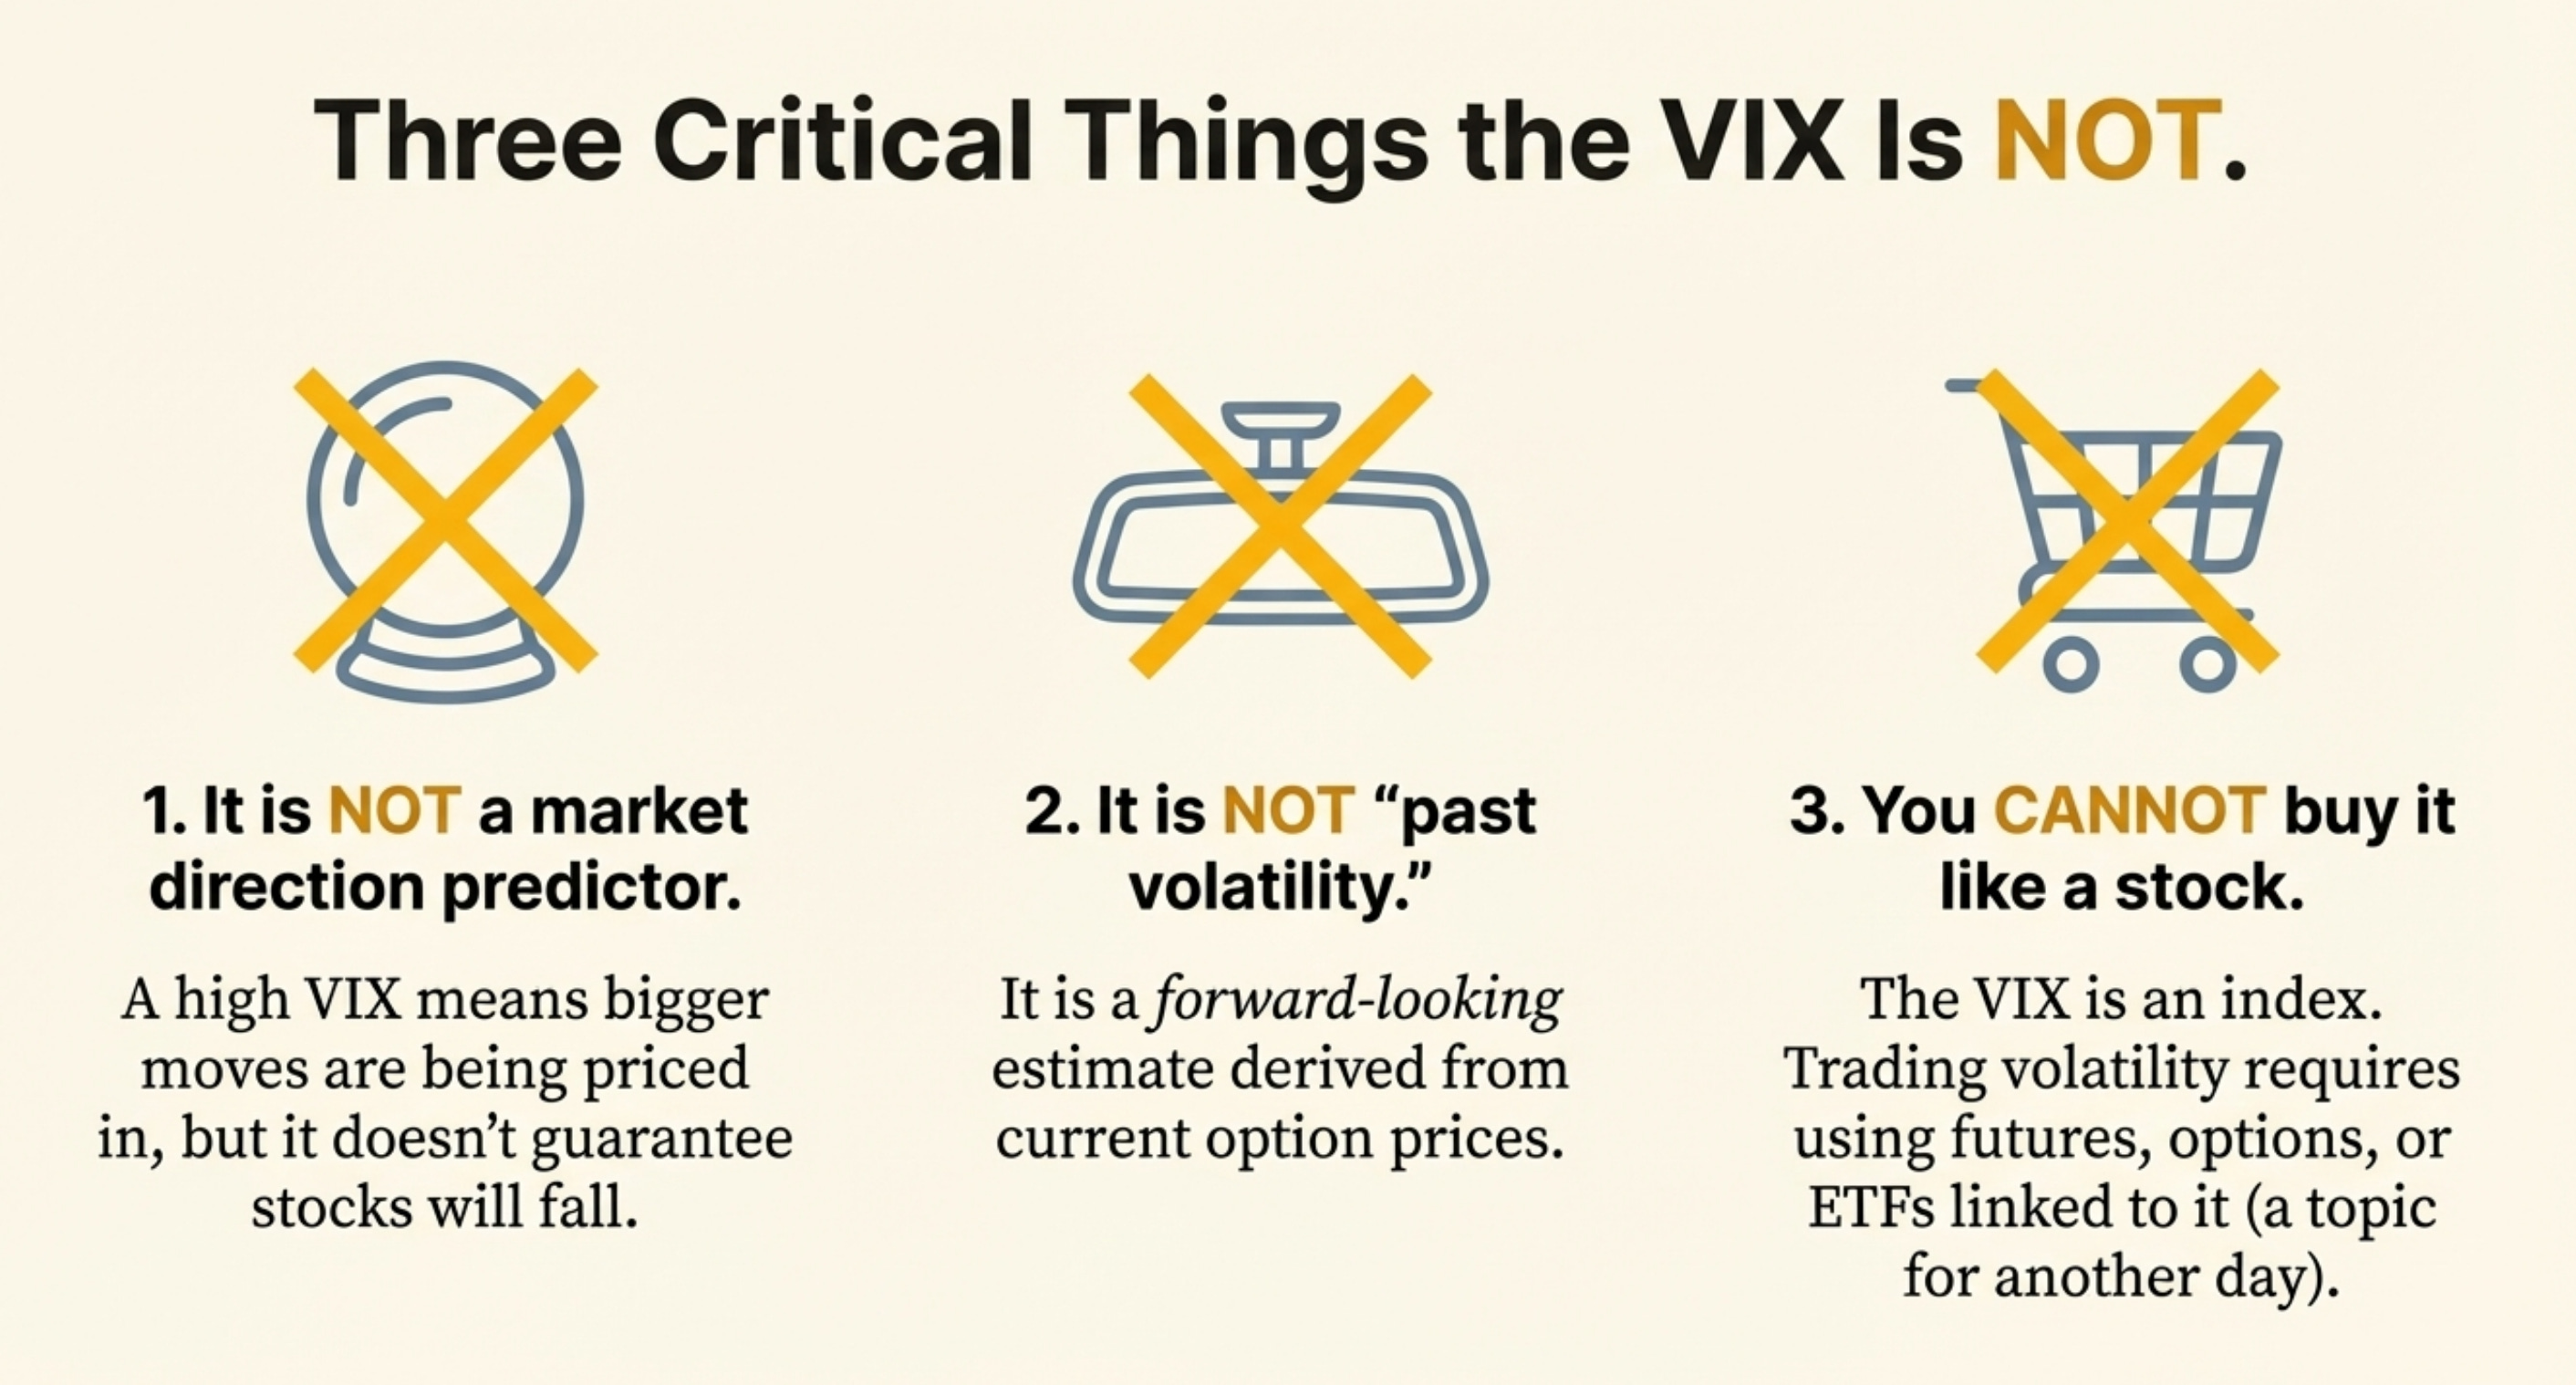
Quick myth-busting before we wrap Part 1:
VIX is not a market direction predictor.
High VIX doesn’t mean “stocks must fall tomorrow.” It means bigger moves are being priced.VIX is not “past volatility.”
It’s based on option prices → it’s forward-looking.You can’t buy the VIX like a stock.
It’s an index. (Part 2 will cover the tradable products built around it.)
Part 1 takeaway (the simplest summary)
If you remember nothing else:
VIX = the market’s 30-day stress forecast, extracted from S&P 500 option prices.
Stocks fall fast → protection demand jumps → option prices rise → VIX spikes.
VIX spikes → risk systems tighten up → markets can get even messier.
That’s the core loop.
Part 2 will go into how people trade volatility (and the traps that blow accounts up).
Sources
Cboe Global Indices — Volatility Index® Methodology: Cboe Volatility Index® (VIX® Index) (method overview, history, step-by-step calculation, definition of 30‑day expected volatility, use of SPX/SPXW options, and “fear gauge” framing).
Cboe Global Indices — Cboe Volatility Index Mathematics Methodology (near/next term selection, bracket method concept, and core variance/volatility calculation structure).
Cboe — VIX Options page (plain-language definition: VIX based on real-time S&P 500 (SPX) option prices; designed to reflect 30‑day expected volatility; commonly called “fear gauge”). (Cboe Global Markets)
Fidelity — What is the VIX? (plain-language explanation, forward-looking nature, inverse tendency vs S&P 500, and high-level “square root of expectation” description). (Fidelity)
Investopedia — Understanding the CBOE Volatility Index (VIX) in Investing (implied volatility as forward-looking signal from option prices; 30‑day expectation framing; brief history context). (Investopedia)
Federal Reserve Bank of St. Louis (FRED) — CBOE Volatility Index: VIX (VIXCLS) (definition note: market expectation of near-term volatility conveyed by stock index option prices; data source for plotting). (fred.st