
The Strait That Broke the Disinflation: How a 21-Mile Chokepoint Dragged U.S. Inflation Back to 3.8%
The Fed thought it had this beaten. Then a war closed the Strait of Hormuz, oil doubled, and every inflation gauge in America turned back up at once. Here’s the data - and where it goes next.

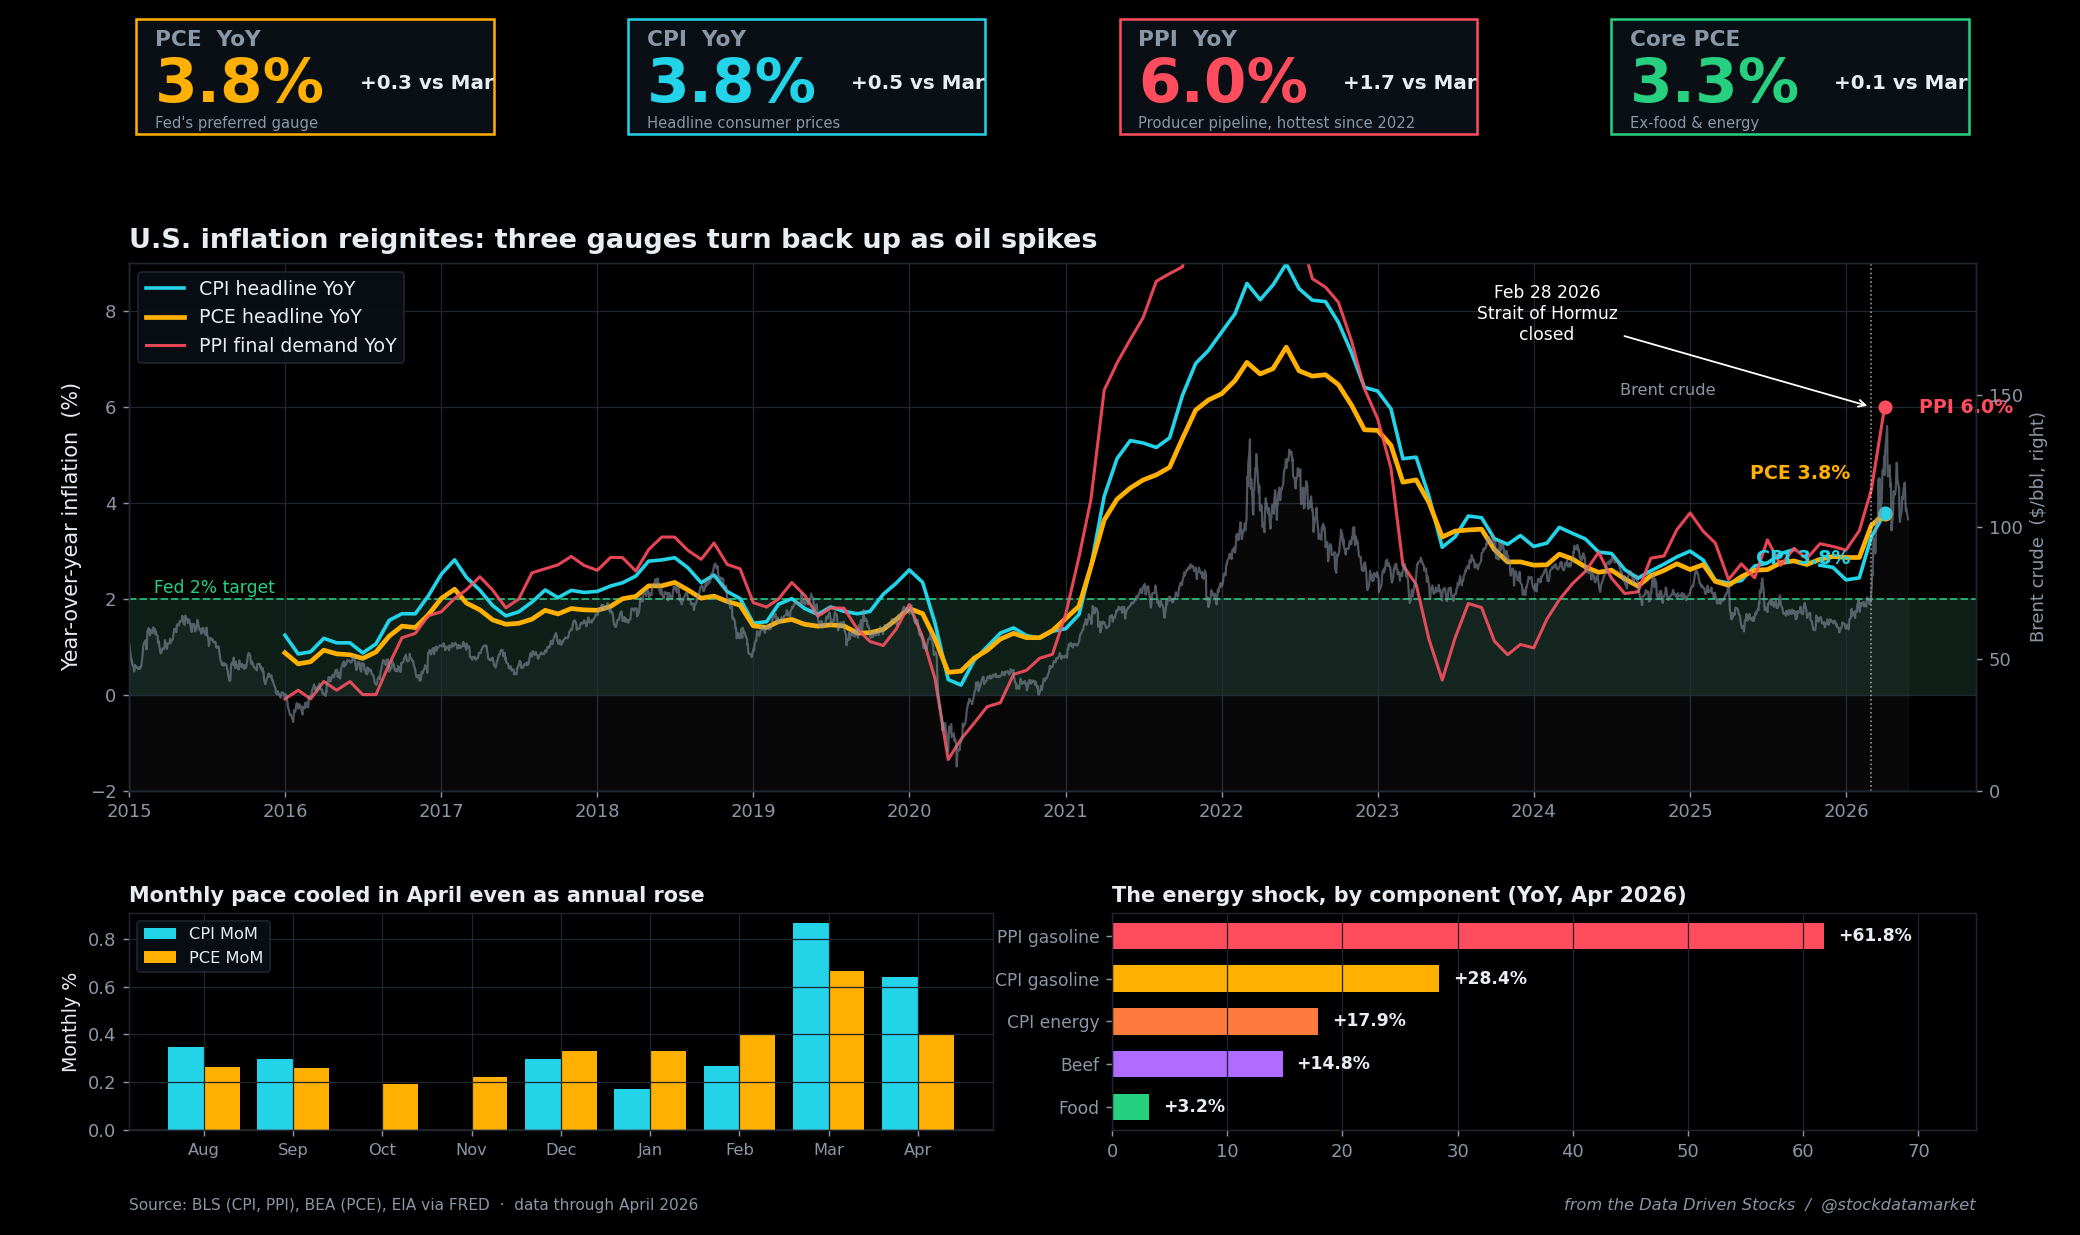
Let’s not bury the lede. The Federal Reserve’s favorite inflation gauge, core PCE, spent most of 2024 and early 2025 grinding lower in the right direction. The soft-landing crowd was taking victory laps. And then, in the space of about ten weeks, the entire story flipped.
Headline PCE inflation hit 3.8% year-over-year in April 2026 - the report dropped on May 28 - up from 3.5% in March and the highest reading in nearly three years. Strip out food and energy and core PCE still rose to 3.3%, also climbing. The Consumer Price Index? Also 3.8%. Producer prices, the stuff sitting upstream in the pipeline before it ever hits your receipt? Up a blistering 6.0%, the hottest since December 2022.
Every gauge moved the same direction. That almost never happens by accident. It happens when something big hits the system. And in this case we know exactly what hit it: a war, and a strait.
The scoreboard nobody wanted
Here’s the thing that makes this report so unsettling. It isn’t one number that’s ugly. It’s all of them.

Notice something in that lineup. The producer-price numbers are running hottest of all, and that matters because PPI tends to lead consumer prices. What shows up in a factory invoice or a wholesale fuel contract today tends to land on a store shelf weeks or months later. So when PPI prints 6.0% and core PPI prints 4.4% - the fastest in over three years - that’s not just a bad month. That’s a warning shot about the months still coming.
There’s a wrinkle worth being honest about, though, because it’s the one thing the optimists are clinging to. On a monthly basis, the pace actually cooled. CPI rose 0.6% in April after 0.9% in March. PCE rose 0.4% after 0.7%. So if you only read the month-over-month line, you’d think things were calming down.
They’re not, really. The year-over-year rate kept climbing even as the monthly pace eased, because of base effects - the comparison months a year ago were soft, so each new month stacks onto a low base and pushes the annual figure higher. It’s the difference between a car slowing down and a car that’s still accelerating, just less violently than last month. The Fed cares about the trend, and the trend is up.
The Fed’s gauge, the long view
Step back far enough and you can see how unusual this turn really is.

For two years the dominant narrative was disinflation. PCE peaked around 7% in mid-2022, then ground steadily lower, kissing the high 2s through 2024 and into 2025. That was the line in every Fed speech: bumpy, slow, but heading home to 2%.
The April data kills that line. Both headline and core have put in a clear bottom and turned. And here’s the quarterly math that should worry policymakers most: on a quarter-over-quarter annualized basis, headline PCE ran around 4.6% in the first quarter of 2026, and the three-month annualized rate through April is screaming near 6%. The short-run momentum is far hotter than the still-rising annual figure. When the recent run-rate is running well ahead of the trailing-year number, that’s the trailing-year number telling you where it’s headed: higher.
So what lit the fire? One word.
The trigger: oil
On February 28, 2026, U.S.-Israeli strikes on Iran provoked a retaliation that markets had feared for years - the effective closure of the Strait of Hormuz. That narrow waterway carries roughly a fifth of the world’s seaborne oil and liquefied natural gas. Mine it, swarm it with drones, jack up the war-risk insurance, and you don’t need to sink a single tanker to choke off supply. Shipping just stops.
The price reaction was instant and violent.

Brent crude doubled, peaking near $138 a barrel on April 7 from roughly $66 before the conflict. WTI tagged $114. And although the United States is a net energy exporter now, that doesn’t insulate American drivers one bit - domestic fuel prices track the global benchmark. So the national average for regular gasoline rocketed to $4.50 a gallon, up from around $3.14 a year earlier.
That’s the spark. Now watch how it spreads through the whole economy, link by link.
The transmission chain
This is the part people get wrong. They see “energy spike” and assume it’s a one-off that washes out. Sometimes it is. But this one is moving through the system in a very specific, traceable sequence - and it’s already past the “just energy” stage.

Start at the pump and trace it backward into the data. Producer gasoline prices are up an eye-watering 61.8% year-over-year. That’s the wholesale shock, the stuff that hasn’t fully hit consumers yet. On the consumer side, CPI gasoline is up 28.4% and the broad energy index 17.9% - energy alone drove more than 40% of April’s monthly CPI increase.
Then comes the leak. Diesel runs the trucks that move the food; freight costs feed grocery prices, which is a big reason beef is up 14.8% over the year and the overall food index is up 3.2%. Higher fuel surcharges work their way into airfares, into delivery, into a thousand small line items that have nothing to do with crude directly. And that’s exactly what the core data is now showing.

That left-hand chart is the tell. For most of 2023 through 2025, headline inflation ran below core - energy was a drag, pulling the top-line down. In April 2026 that wedge flipped to roughly +1.0 percentage point, the clean fingerprint of energy doing the opposite: yanking headline up. And the right-hand chart shows the breadth of it. This isn’t a single rogue category. It’s a gradient from the white-hot wholesale fuel numbers down through food and shelter and into the supposedly-calm core.
Core CPI itself accelerated to +0.4% month-over-month in April, up from a placid +0.2% in March. Core PCE held a touch firmer at +0.2%, which is the one genuinely encouraging data point in the whole release. But the direction of travel in core is the wrong one, and the producer pipeline behind it is still loaded.
The de-anchoring nobody can afford
Central bankers have a rule of thumb about energy shocks: ride them out, as long as people’s expectations stay anchored. A one-time jump in gas prices is tolerable. A jump that convinces households and businesses that inflation is back for good is not - because then the shock starts feeding on itself through wages and pricing decisions.
So this next chart is the one that should be keeping Jerome Powell up at night.

Households are losing the plot. University of Michigan one-year inflation expectations jumped to 4.7%, and consumer sentiment cratered to 49.8 - the kind of number you normally only see in a recession. People are angry and scared about prices, and when people expect high inflation, they behave in ways that help create it.
The slightly reassuring counterweight is the bond market. Five-year breakeven inflation - what traders are actually pricing - rose to about 2.54%, elevated but nowhere near the panic levels of 2022. So markets still believe the Fed will ultimately drag this back down. The gap between terrified households and still-composed markets is the central tension of this whole episode. One of them is wrong.
Why the Fed is stuck
Put it all together and you get the worst kind of problem for a central bank: a supply shock that pushes prices up and growth down at the same time. The textbook word is stagflation, and while we’re not at 1970s levels, the dynamics rhyme.
Look at the bind. Inflation is rising and expectations are slipping, which screams “don’t cut, maybe even hike.” But real disposable income has now fallen two months running, sentiment is in the gutter, the unemployment rate has drifted up to 4.3%, and wage growth at 3.5% is running behind inflation - which means the average worker is losing purchasing power every month. That screams “don’t hike, you’ll break the consumer.”
So the Fed has done the only thing it can do when both pedals are dangerous. Nothing. The policy rate has sat frozen at 3.64%. Markets have responded by ripping rate cuts out of the 2026 calendar entirely - the consensus has slid to a first cut in December at the earliest, with a real chance it slips into 2027. As one strategist put it after the CPI report, the upside surprise in core was the more consequential part, precisely because it’s the part the Fed can’t blame on a temporary oil spike.
A quick history lesson, because context matters
If you’ve only been watching markets since 2022, every inflation uptick feels like the apocalypse. It helps to zoom out.
Through the 2010s, U.S. inflation was boring in the best way - CPI bounced between roughly 1% and 2.5%, occasionally dipping near zero (2015-16) when oil collapsed. The pandemic blew that up: CPI peaked at 8.6% in March 2022, PCE at 6.9%, and producer prices at a ferocious 11.6%, as supply chains snarled and stimulus collided with shortages. Then came the long grind down, the disinflation that defined 2023 through 2025, with all three gauges easing back toward - though never quite reaching - the 2% target.
April 2026, at 3.8% headline, is nowhere near the 2022 peak. Let’s be clear about that and not catastrophize. But it’s also unmistakably a reacceleration off the 2024-25 lows, and it’s the first time in this cycle that an external shock has pushed every gauge higher simultaneously. The 2022 surge was demand colliding with broken supply chains. This is a cleaner, older kind of inflation: a geopolitical oil shock, the same species that mugged the U.S. economy in 1973 and 1979. Those didn’t resolve in a single month either.
Where this goes: the next eighteen months
Here’s the honest part. The entire forecast hinges on one variable - oil - and oil hinges on one thing nobody can model, which is what Iran and the Strait of Hormuz do next. So instead of pretending to a single point forecast, it’s more useful to lay out the genuine scenarios.

In the benign path, the Strait reopens gradually over the second half of 2026, oil drifts back toward $70-75 as rerouted supply and demand destruction do their work, and the base effects from this year’s spike start rolling off the annual comparison in 2027. Headline PCE humps a little higher first - into the high-3s or low-4s through mid-2026 as the pipeline empties out - then disinflates back toward the mid-2s by the end of 2027. This roughly matches what Goldman Sachs has penciled in for oil and what Rabobank sees for inflation, with the latter pegging roughly 2.8% inflation in 2027.
In the sticky path, the disruption lingers, oil holds around $100, and the energy shock keeps slow-dripping into core. Inflation never really comes home; it just plateaus in the mid-3s and eases only grudgingly. The Dallas Fed and CEPR have modeled the oil shock as adding around 0.6 percentage points to headline inflation in 2026 under a one-quarter closure - and the longer the closure runs, the bigger and stickier that lift gets.
In the ugly path, the conflict re-escalates, the Strait shuts harder, and oil spikes toward $130 again. PCE pushes toward 5%, expectations break properly, and the Fed is forced into a genuinely awful choice between fighting inflation into a weakening economy or letting it run. This is the tail nobody wants to price, but after the last few months, nobody can dismiss it either.
The base case is still disinflation - eventually. But “eventually” now sits a lot further out than it did in January, and the risks are stacked firmly to the upside.
The bottom line
Strip away the noise and the April 2026 reports say one thing clearly: the disinflation trade is over for now. A geopolitical shock did what domestic demand alone hadn’t managed to do in two years - it pushed CPI, PCE and PPI back up in unison, started leaking into the core, and rattled the expectations that the whole 2% project depends on.
For markets, the read-through is brutal in its simplicity. A frozen Fed and sticky inflation mean “higher for longer” rates, which keeps real yields elevated and presses on the long-duration growth names - the QQQ crowd - that hate nothing more than a discount rate that won’t come down. It means the first rate cut keeps sliding rightward on the calendar. And it means the single most important chart in finance for the rest of 2026 isn’t a stock or a yield. It’s the price of a barrel of Brent crude, and a map of one very narrow strait.
Watch the oil. Everything else is downstream.
Sources
U.S. Bureau of Economic Analysis, Personal Income and Outlays, April 2026 (released May 28, 2026): https://www.bea.gov/news/2026/personal-income-and-outlays-april-2026
U.S. Bureau of Labor Statistics, Consumer Price Index - April 2026 (released May 12, 2026): https://www.bls.gov/news.release/archives/cpi_05122026.pdf
U.S. Bureau of Labor Statistics, Producer Price Indexes - April 2026 (released May 13, 2026): https://www.bls.gov/news.release/archives/ppi_05132026.pdf
Federal Reserve Bank of Dallas, Trimmed Mean PCE Inflation Rate (April 2026): https://www.dallasfed.org/research/pce
Federal Reserve Bank of Dallas, Implications of the Iran war for U.S. inflation (April 17, 2026): https://www.dallasfed.org/research/economics/2026/0417
CEPR / VoxEU, Quantifying the impact of the Iran war on US inflation: https://cepr.org/voxeu/columns/quantifying-impact-iran-war-us-inflation
CNBC, Here’s the inflation breakdown for April 2026 - in one chart: https://www.cnbc.com/2026/05/12/inflation-breakdown-for-april-2026-cpi-chart.html
Fox Business, Inflation rose in April as Iran war jolted energy prices: https://www.foxbusiness.com/economy/cpi-inflation-april-2026
University of Michigan, Surveys of Consumers (sentiment and inflation expectations): http://www.sca.isr.umich.edu/
TradingEconomics, United States PCE Price Index Annual Change: https://tradingeconomics.com/united-states/pce-price-index-annual-change
TradingEconomics, United States Core PCE Price Index Annual Change: https://tradingeconomics.com/united-states/core-pce-price-index-annual-change
Federal Reserve Economic Data (FRED), St. Louis Fed - series CPIAUCSL, CPILFESL, PCEPI, PCEPILFE, PPIFIS, WPSFD49116, WPU0561, CPIENGSL, CUSR0000SETB01, CUSR0000SAH1, DCOILBRENTEU, DCOILWTICO, GASREGW, MICH, UMCSENT, T5YIE, FEDFUNDS, UNRATE, CES0500000003: https://fred.stlouisfed.org/


