The Second Wave Just Hit Europe - And The Oil Isn’t Done
The May inflation report is the one that should worry the ECB. Not because of energy - that was the first wave. Because of what energy did to everything else.
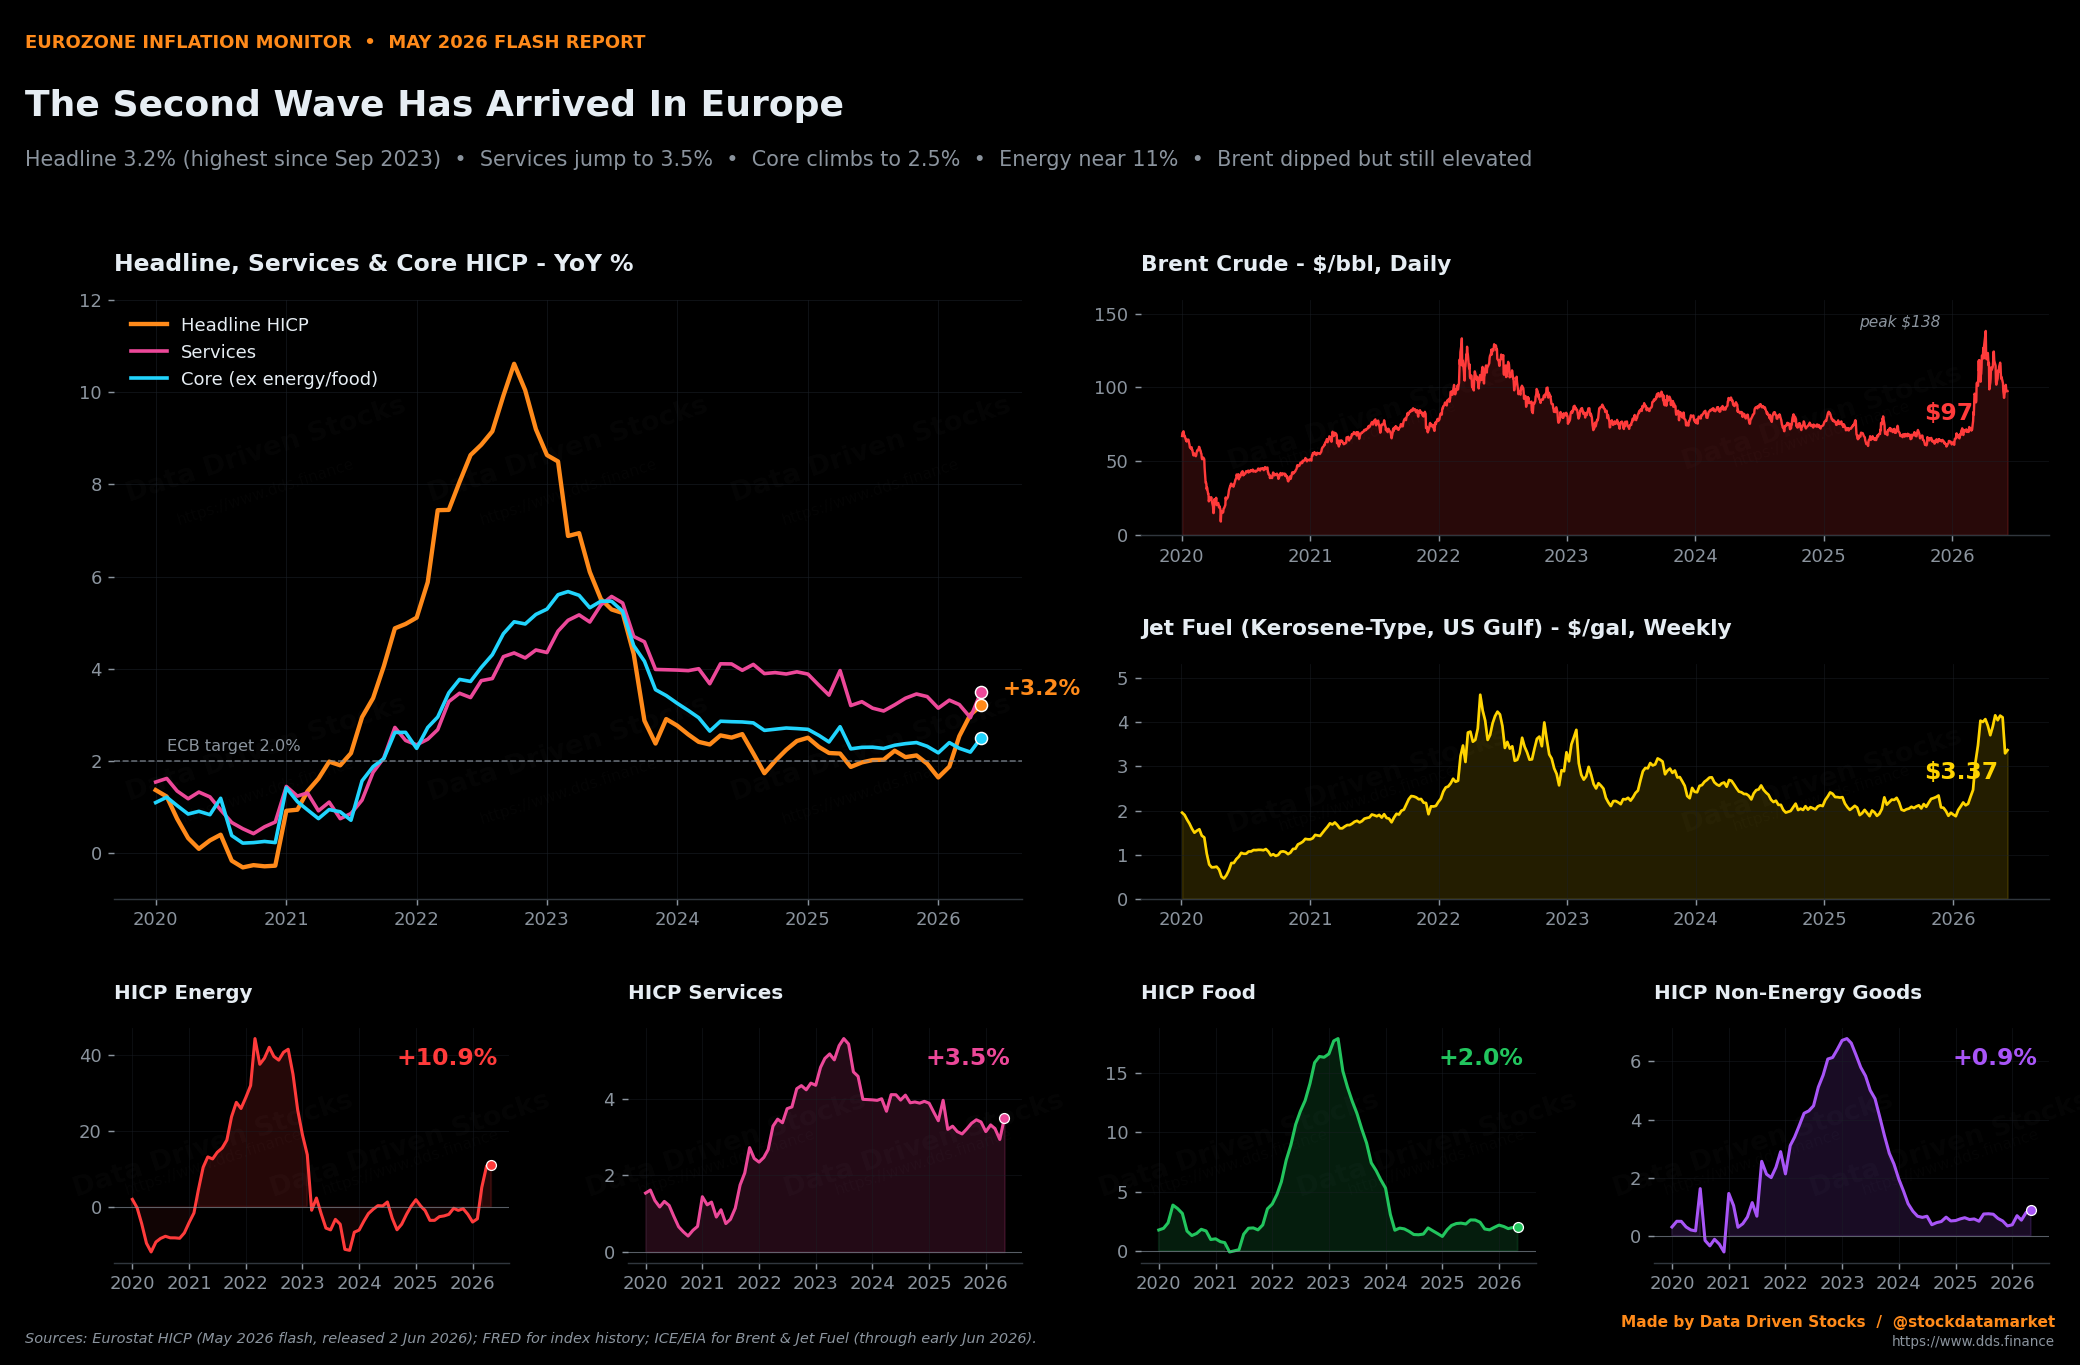
When you are reading this, you are probably either watching the European open from a desk in London or Frankfurt, or you are halfway around the world in Sydney or Singapore with the eurozone numbers buried three screens deep in your morning scroll. Either way, the May inflation report out of the euro area is the one to stop on. Not the headline number, which is bad enough. The components underneath it, which are worse.
Here is the one-line version. Euro-area headline inflation hit 3.2% in May, the highest since September 2023. Energy did most of the damage on the way up, and energy is now near 11% year-on-year. Brent crude dipped in late May - from a $117 April average to $107 in May, and to around $99 in early June - on reports that the United States and Iran were nearing a deal to reopen the Strait of Hormuz. So the comforting story is that this is a transitory energy shock that is already reversing.
That story is wrong twice over. First, the deal has not been finalised, the strait is still effectively shut, and the EIA expects Brent to average $105 in June and July and $95 for the full year - the highest annual average since 2022. The oil is not cheap; it just stopped going straight up. Second, and more important: while the oil price was wobbling, services inflation jumped from 3.0% to 3.5% in a single month, and core inflation - which strips out both energy and food - broke higher to 2.5% after grinding down to a four-year low just one month earlier. The shock has left the energy aisle and walked into the rest of the shop. This is the second wave.
The headline: three straight months of acceleration
Let’s start with the number that makes the front pages. Euro-area HICP inflation has now climbed for three consecutive months: 1.9% in February, 2.6% in March, 3.0% in April, and 3.2% in May. That is the highest reading since September 2023, and it puts headline inflation a full 1.2 percentage points above the European Central Bank’s 2% target.

To put 3.2% in context: a year earlier, in May 2025, euro-area inflation was 1.9%. The acceleration has been almost entirely a 2026 phenomenon, and it has been almost entirely driven by one input - the price of oil, which started climbing in December as the Middle East situation deteriorated. But that is where the simple story ends and the dangerous one begins.
The whole picture fits in one frame. If you map every major price component as a heat strip - blue for cold, amber-to-red for hot - the structure of this shock jumps out immediately. The shock rows at the top (crude, energy, pump fuels) are glowing red again after two years of cool blue. But look lower down: services, headline and core, the rows that move slowly and stick, have all shifted from cool to warm amber over the last few months. That is the tell. A pure energy shock lights up the top three rows and leaves the rest dark. This one is bleeding downward.

The first wave: energy did its damage - and isn’t done
Energy is the loud part of this shock. The HICP energy component swung from -3.2% year-on-year in February to +10.9% in May - a roughly 14-point move in three months. That is the steepest energy inflation rate since February 2023, back when the eurozone was still working through the aftermath of the Russian gas crisis.

Here is the part that the “transitory” camp keeps missing. Look at the two lines on that chart. Brent crude - the yellow line - came off its April peak. It hit $138 a barrel on April 7, averaged $117 for that month, then slipped to a $107 average in May and around $99 in early June as traders priced in hopes of a US-Iran deal. But “came off the peak” is not the same as “cheap.” At $99, Brent is still more than 50% above where it traded for most of 2024 and 2025, and the EIA expects it back at $105 in June and July. Meanwhile the red line - the inflation that the commodity shock causes - is still pinned near its highs, because consumer prices reset on a lag. Pump prices, heating bills and electricity tariffs catch up to the crude move over weeks and months, not days. Even if oil had collapsed, the bell already rung in April and May would still be echoing through the index.
So the energy contribution to headline inflation could ease later in 2026 if - and only if - the strait reopens and oil falls as the EIA’s base case assumes. That is a real possibility, but it is an assumption, not a fact. And the inventory data, which we turn to next, is the reason to doubt the easy version.
The oil isn’t getting cheaper - it’s draining the world’s tanks
Before we get to the second wave, a warning about the first. The story that “Brent already peaked, so the energy shock is over” rests entirely on the assumption that the oil price keeps falling from here. The inventory data says do not count on it.
On June 9, the US Energy Information Administration published its monthly Short-Term Energy Outlook, and the numbers are stark. With the Strait of Hormuz effectively closed for more than three months, Middle Eastern producers have cut output by more than 11 million barrels per day. To meet demand, the world is draining its stockpiles at an extraordinary rate - an average of 6.3 million barrels per day in the second quarter, accelerating to 7.6 million per day in the third. The result: OECD oil inventories are now on track to fall to their lowest level since 2003.

Measured in days of forward demand cover, the EIA sees OECD inventories falling to 50 days by the end of 2026. Before the conflict, back in the February outlook, the agency had expected stocks to keep building toward more than 70 days. In absolute terms, OECD commercial stocks are projected to bottom around 2.27 billion barrels in December, down from roughly 2.82 billion at the end of 2025 and far below the 3.0 billion the pre-conflict path implied. That is a 20-year low, and it matters because inventory is the shock absorber. When stocks are thin, any fresh disruption - another tanker incident, a refinery outage, a cold snap - translates straight into price with no buffer to dampen it.
This is why the late-May dip to a $107 monthly average, and the $99 daily print in early June, is not the all-clear it looks like. The EIA’s own forecast has Brent rising back to an average of $105 a barrel in June and July, and $95 for the full year - the highest annual average since 2022 - precisely because inventories keep draining. The dip happened because reports surfaced that the US and Iran were nearing a deal to reopen the strait; as of the EIA’s writing, that deal had not been finalised, most Gulf production remained shut in, and stocks kept falling. JPMorgan has warned that another full month of a de facto blockade would be consistent with Brent climbing toward $150, and that OECD inventories could hit operational stress levels as early as this month. There is a specific diesel angle too: US distillate stocks have fallen close to 100 million barrels, a threshold last breached in 2003, which is exactly the kind of tightness that feeds straight into freight and industrial costs - and, eventually, into the services prices we are about to look at. The barrel dipped on a hope. The structure underneath it - record-low stocks, a still-shut strait - is the opposite of reassuring.
The second wave: services just broke higher
This is the chart that matters. Eurozone services inflation jumped from 3.0% in April to 3.5% in May - a half-point move in a single month, in a component that normally grinds rather than jumps.

Why does this happen? Because energy is not just the stuff you put in your car. It is embedded in the cost of every service that involves moving people, heating buildings, or running machines. Restaurants pay more for deliveries and for gas. Hotels pay more for heating and for laundry. Airlines pay more for jet fuel and pass it into fares. Logistics firms pay more for diesel. And on top of the direct cost channel, there is the wage channel: when workers see their cost of living jump because of fuel and energy bills, they ask for more in the next pay round, and services - which are mostly labour - are where that shows up.
This is precisely the “second-round effect” that central bankers spend their careers worrying about. A pure energy shock that stays in the energy aisle is something a central bank can look through. An energy shock that leaks into services and wages is something that becomes self-sustaining, and the May print is the first hard evidence that the leak is underway.
Core inflation: the disinflation just reversed
If services is the symptom, core inflation is the diagnosis. The core measure - HICP excluding energy, food, alcohol and tobacco - is the cleanest read on underlying, persistent price pressure. And core just did something it had not done in a while: it turned back up.

In April, core inflation was 2.2% - the lowest reading since the post-Russia disinflation began, and a number that let the doves argue the underlying trend was still heading toward target. One month later it is 2.5%. The disinflation that everybody had penciled in did not just stall. It reversed. As Trading Economics put it in its write-up of the release, the move suggested “broadening price pressures beyond energy.” That is the whole ballgame. When the broad core measure starts climbing at the same time as the volatile energy measure, you no longer have an energy shock. You have an inflation problem.
It’s not one country - it’s all of them
One way to check whether this is a genuine euro-area phenomenon or a quirk of one big member state is to look at the national breakdown. The May data is unambiguous: every major euro-area economy is now running well above the 2% target.

Spain leads at 3.6% on the harmonized measure - a new high since June 2024. The Netherlands is at 3.4%, Italy at 3.3%, the euro-area aggregate at 3.2%, France at 2.8%, and even Germany, which actually eased slightly from April, sits at 2.7%. The spread between the hottest and coolest of the big economies is less than a percentage point, which tells you this is a common shock hitting a common currency area, not an idiosyncratic story in one place. When the dispersion is this tight and the level is this high, the central bank cannot fix it by pointing at one outlier.
The one component going the other way: food
Not everything is rising. Food, alcohol and tobacco inflation actually eased to 2.0% in May, down from 2.4% in April. This is the counter-current in the report, and it is worth understanding rather than dismissing.

Food is the slowest-moving major component because it sits at the end of the longest supply chain. The oil that spiked in April has to work its way through diesel-powered farm equipment, gas-derived fertilizer, refrigerated transport, and petrochemical packaging before it shows up on a supermarket shelf - and there is usually a layer of fixed-price supplier contracts that delays the pass-through even further. In the 2022 oil shock, food inflation did not peak until early 2023, a full year after the crude move. So the calm food number in May is not evidence that the shock is contained. It is evidence that the food channel simply has not caught up yet. If the historical lag holds, the food contribution starts climbing in the back half of 2026.
The ECB blinked
Here is the institutional confirmation that this is serious. On June 11, the ECB published its June staff macroeconomic projections, and the revision tells you everything about how the central bank now sees the world.

Six months ago, in December 2025, ECB staff projected headline inflation of 1.9% for 2026 - below target, heading lower. In March they revised that to 2.6%. In June they took it all the way to 3.0%, and the projections now see inflation peaking at 3.4% on a quarterly basis in the third and fourth quarters of 2026, and remaining above 3% into early 2027. The June projections do see inflation eventually coming back down - 2.3% in 2027 and 2.0% in 2028 - but the near-term path is a wholesale capitulation on the “transitory” framing. When a central bank moves its current-year forecast by 1.1 points in two quarters, it is not fine-tuning. It is admitting it got the regime wrong.
What the schema shows
Step back and look at the shock as a single process moving through the economy, and the structure becomes clear.

Stage one - energy - has largely played out in the index. The pump and the utility bill reset fast, and that wave has mostly landed at +10.9%. Stage two - services - is happening right now, with the May jump to 3.5% as the opening move. Stage three - core broadening and the eventual food catch-up - is just beginning. And the twist sits across the top of the whole picture: the commodity that triggered all of this dipped in late May on hopes of a ceasefire deal, but it remains elevated and the EIA expects it to climb again. The oil price leads; the inflation it causes lags. Even in the optimistic case where the barrel finally falls, the second and third waves are still rolling through services, wages and groceries.
What it means for markets
The clean way to frame the positioning question is to ask what the curve has priced versus what the ECB just told you. Before this sequence of reports, markets were pricing the ECB to be cutting through 2026 on the back of the December disinflation story. The June projections - 3.0% average inflation this year, a 3.4% quarterly peak, above-target inflation into 2027 - are flatly inconsistent with near-term cuts. Either the ECB delays easing materially, or it tolerates a sustained overshoot, or both. None of those outcomes is friendly to the front end of euro-area government bond curves, and the repricing has further to run if the next couple of prints confirm the services trend.
On the equity side, the sectoral split is the familiar energy-shock map. Energy producers and integrated oils benefit directly. Regulated utilities with cost pass-through are roughly neutral to positive. The squeeze lands on the energy-intensive and the margin-thin: airlines, road transport, chemicals, steel, cement, glass, paper, and food retailers caught between rising input costs and stretched consumers. The euro itself sits in a tug-of-war - higher-for-longer ECB rates are supportive, dollar-priced energy imports are a drag, and the net depends on which force dominates over which horizon.
What to watch next
The June flash estimate lands at the end of June, and it is the single most important data point on the calendar. If services holds at or above 3.5% and core stays at or above 2.5%, the second-round narrative is confirmed and the ECB’s 3.4% peak projection looks if anything conservative. If services slips back toward 3.0%, the optimists get a reprieve.
Watch the oil price for the mechanical relief - and watch inventories even more closely. Brent below $90 sustained means the energy contribution fades faster in the back half of the year. But with OECD stocks draining toward a 20-year low and the EIA forecasting Brent at $105 for June and July, the buffer that would normally cap a price rebound is gone. Brent back above $110 means the whole chain gets a second push just as the first one is maturing, and a thin-inventory market is exactly the kind that moves there fast.
And watch food from the third quarter onward. It is the last shoe to drop, the slowest to move, and the one that hits households hardest because it is non-discretionary. If the food aggregate starts climbing back toward 3-4% in the autumn, the 2022 playbook is replaying in full.
Bottom line
The market wants to treat May as the peak of an energy shock that is already reversing. The late-May dip in crude even seems to support that. But the dip came on a US-Iran deal that has not been signed, the strait is still shut, inventories are draining toward a 20-year low, and the EIA expects Brent back above $100 - at a 2026 average that would be the highest since 2022. The oil is not cheap; it paused. And underneath, the inflation data is telling a different and more uncomfortable story. The shock has moved on from energy. It is in services now, it is in core now, and it has not yet reached food. Even a genuine fall in crude from here would not undo the prices it already lit up in April and May, and the ECB’s own capitulation - a 2026 forecast that went from 1.9% to 3.0% in two quarters - is the clearest signal that the people who watch this most closely no longer believe the easy story.
The first wave was the price at the pump. The second wave is the price of everything the pump touches. And the second wave is only just getting started.
Sources
European Central Bank, Eurosystem staff macroeconomic projections for the euro area, June 2026 (released 11 June 2026): ecb.europa.eu/press/projections/html/ecb.projections202606_eurosystemstaff~a495110f8d.en.html
European Central Bank, ECB staff macroeconomic projections, March 2026: ecb.europa.eu/press/projections/html/ecb.projections202603_ecbstaff~ebe291cd3d.en.html
European Central Bank, Eurosystem staff macroeconomic projections, December 2025: ecb.europa.eu/press/projections/html/ecb.projections202512_eurosystemstaff~12ead61977.en.html
Eurostat, Euro area annual inflation up to 3.2% (May 2026 flash, released 2 June 2026): ec.europa.eu/eurostat/web/products-euro-indicators/w/2-02062026-ap
Eurostat, Annual inflation up to 3.0% in the euro area (April 2026 final, released 20 May 2026): ec.europa.eu/eurostat/web/products-euro-indicators/w/2-20052026-ap
Eurostat, Inflation in the euro area - Statistics Explained: ec.europa.eu/eurostat/statistics-explained/index.php?title=Inflation_in_the_euro_area
Trading Economics, Euro Area Inflation Rate and Euro Area Core Inflation Rate: tradingeconomics.com/euro-area/inflation-cpi
Trading Economics, Spain Inflation Rate: tradingeconomics.com/spain/inflation-cpi
UK House of Commons Library, Inflation international comparisons: Economic indicators: commonslibrary.parliament.uk/research-briefings/sn02794
Eurostat, Industrial producer prices up by 0.6% in the euro area (April 2026, released 3 June 2026): ec.europa.eu/eurostat/web/products-euro-indicators/w/4-03062026-ap
U.S. Energy Information Administration, Short-Term Energy Outlook (June 2026, released 9 June 2026): eia.gov/outlooks/steo and press release eia.gov/pressroom/releases/press589.php
International Energy Agency, Oil Market Report (May 2026): iea.org/reports/oil-market-report-may-2026
Institute for Energy Research and StoneX, summaries of the EIA June 2026 STEO (OECD inventory levels): instituteforenergyresearch.org; stonex.com
Federal Reserve Bank of St. Louis (FRED) - data series used for index history and charts:
Headline HICP, Euro Area: fred.stlouisfed.org/series/CP0000EZ19M086NEST
Core HICP (excl. energy, food, alcohol, tobacco): fred.stlouisfed.org/series/00XEFDEZ19M086NEST
HICP Services: fred.stlouisfed.org/series/SERV00EZ19M086NEST
HICP Energy: fred.stlouisfed.org/series/ENRGY0EZ19M086NEST
HICP Non-Energy Industrial Goods: fred.stlouisfed.org/series/IGDSXEEZ19M086NEST
Brent Crude Oil, Europe: fred.stlouisfed.org/series/DCOILBRENTEU
Kerosene-Type Jet Fuel, US Gulf Coast: fred.stlouisfed.org/series/WJFUELUSGULF
Data Driven Stocks publishes data-first analysis on financial markets, economic news and policy. Follow @stockdatamarket on X for daily updates, and visit dds.finance for the full archive. Every data point in this piece was cross-checked against its primary source.


