

The Magic Numbers: How Dealer Positioning Quietly Steers the S&P 500
So how to predict where S&P 500 goes within the next few hours

Sometimes you wonder why the S&P 500 has not moved a single point in two hours, pinned as if glued. You are scrolling through one of those cryptic dealer-positioning charts that looks like a forest of green and red bars, each one labeled with a price, each one supposedly whispering where the market wants to go.
Those charts have a strange reputation. People treat the numbers on them like magic - levels the index will “defend,” walls it “cannot break,” a flip point where everything supposedly changes character. Cross one number and the market calms down. Cross another and it falls apart. It can feel like astrology for money.
It is not magic. It is mechanics. Behind every one of those levels sits a very large, very unromantic group of firms whose entire job is to take the other side of everyone else’s options trades, and then to frantically buy and sell the index all day so they do not get run over. They are not trying to predict the market. They are trying not to lose money. But the act of protecting themselves leaves footprints, and those footprints are what the magic numbers are really measuring.
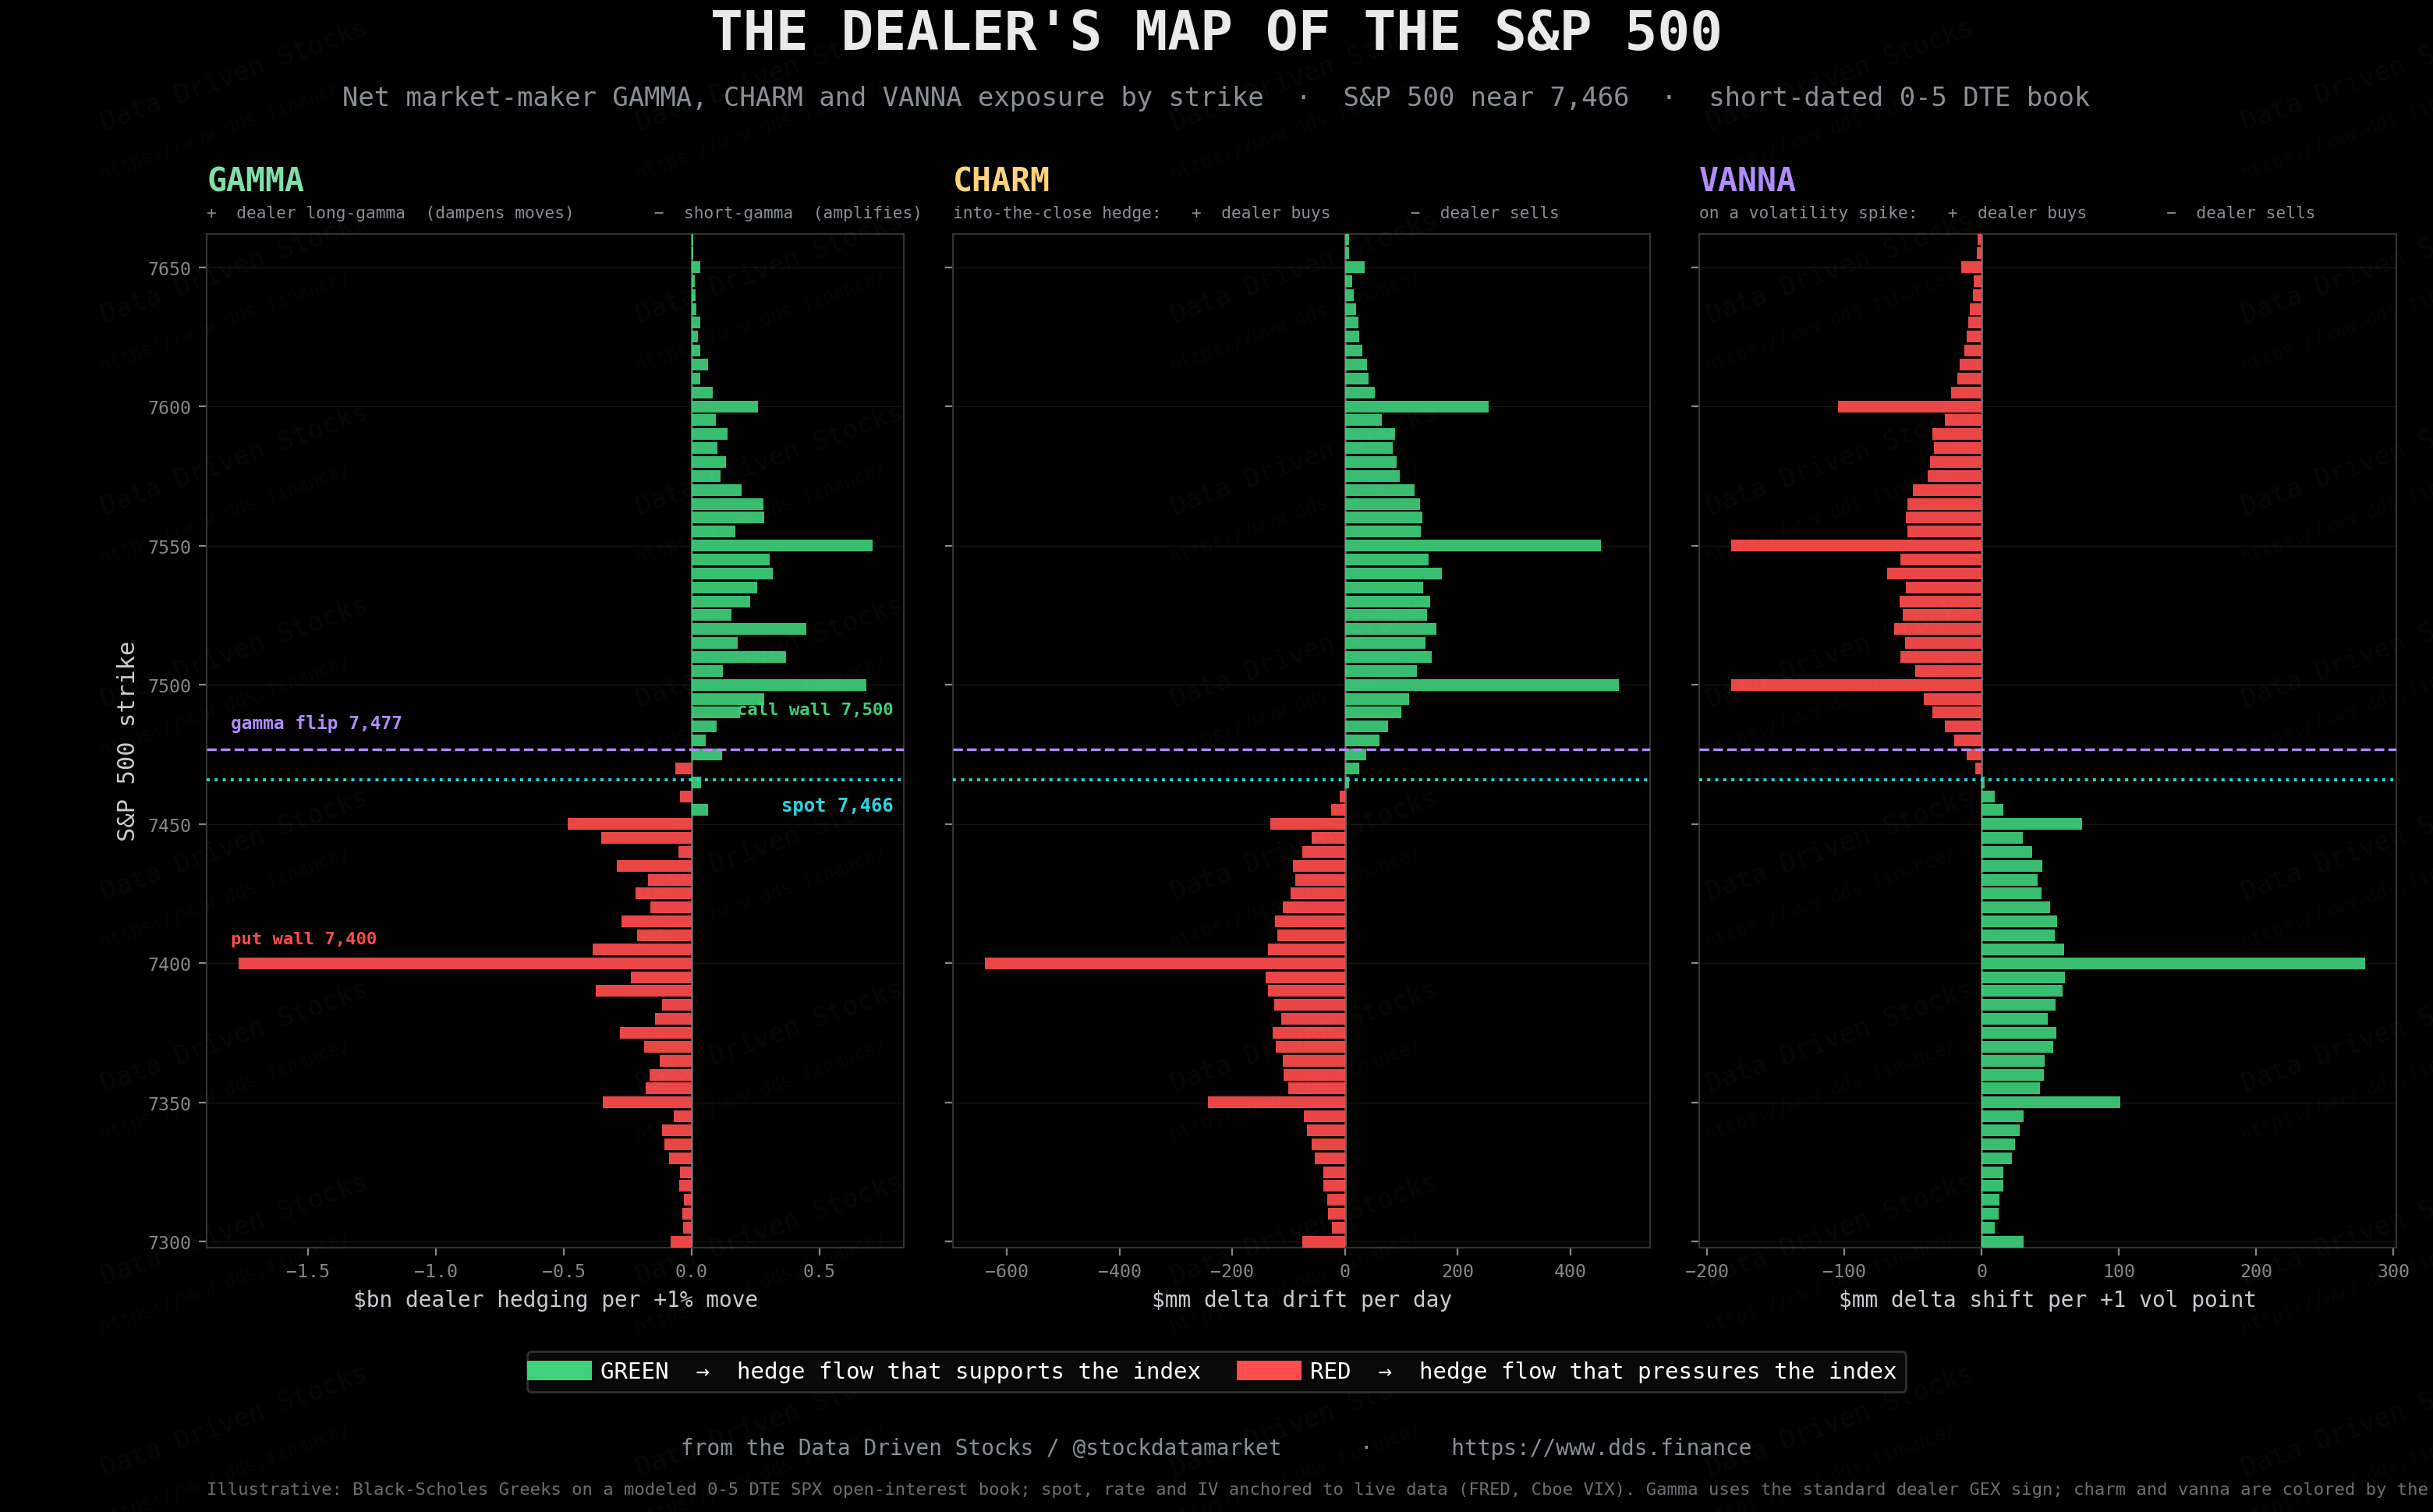
This piece is a slow walk through how that machine actually works - who these dealers are, why their hedging moves the index at all, and what the three “magic” quantities you keep hearing about - gamma, charm, and vanna - really mean. By the end, the forest of bars should look less like a horoscope and more like a weather map.
1. The people who have to react: dealers and the art of staying neutral
Start with a simple question. When you buy a call option on the S&P 500, who sells it to you?
Most of the time, it is not another retail trader who happens to want the opposite bet. It is a market maker - a dealer - whose business is to provide liquidity. They quote a price to buy and a price to sell, they pocket the small difference, and they do this millions of times a day. They are the house. And like any house, they do not actually want to gamble on which way the market goes. They want to earn the spread and go home flat.
Here is the problem. The moment a dealer sells you that call, they are no longer neutral. They have taken on a directional bet whether they like it or not. If the S&P rises, that call you bought becomes more valuable, which means the dealer who is short it is losing money. They are now, against their will, effectively short the market.
So they hedge. To cancel out the directional risk of being short a call, the dealer buys a corresponding amount of the index, usually through futures. How much do they buy? Exactly enough to offset the option’s sensitivity to price - a quantity called delta. If the option behaves like 50 shares of exposure, they buy 50 shares’ worth of futures. Now, for the next tiny move, the gain on one side cancels the loss on the other. The dealer is neutral again. This is delta hedging, and it is the single most important habit in this entire story.
The catch - and it is the catch that makes everything else interesting - is that the hedge does not stay put. Delta is not a fixed number. It changes as the market moves, as time passes, and as volatility shifts. So the dealer cannot hedge once and walk away. They have to keep adjusting, all day, every day, chasing a moving target. And it is precisely that chasing, repeated across the whole market at enormous scale, that leaves the footprints.
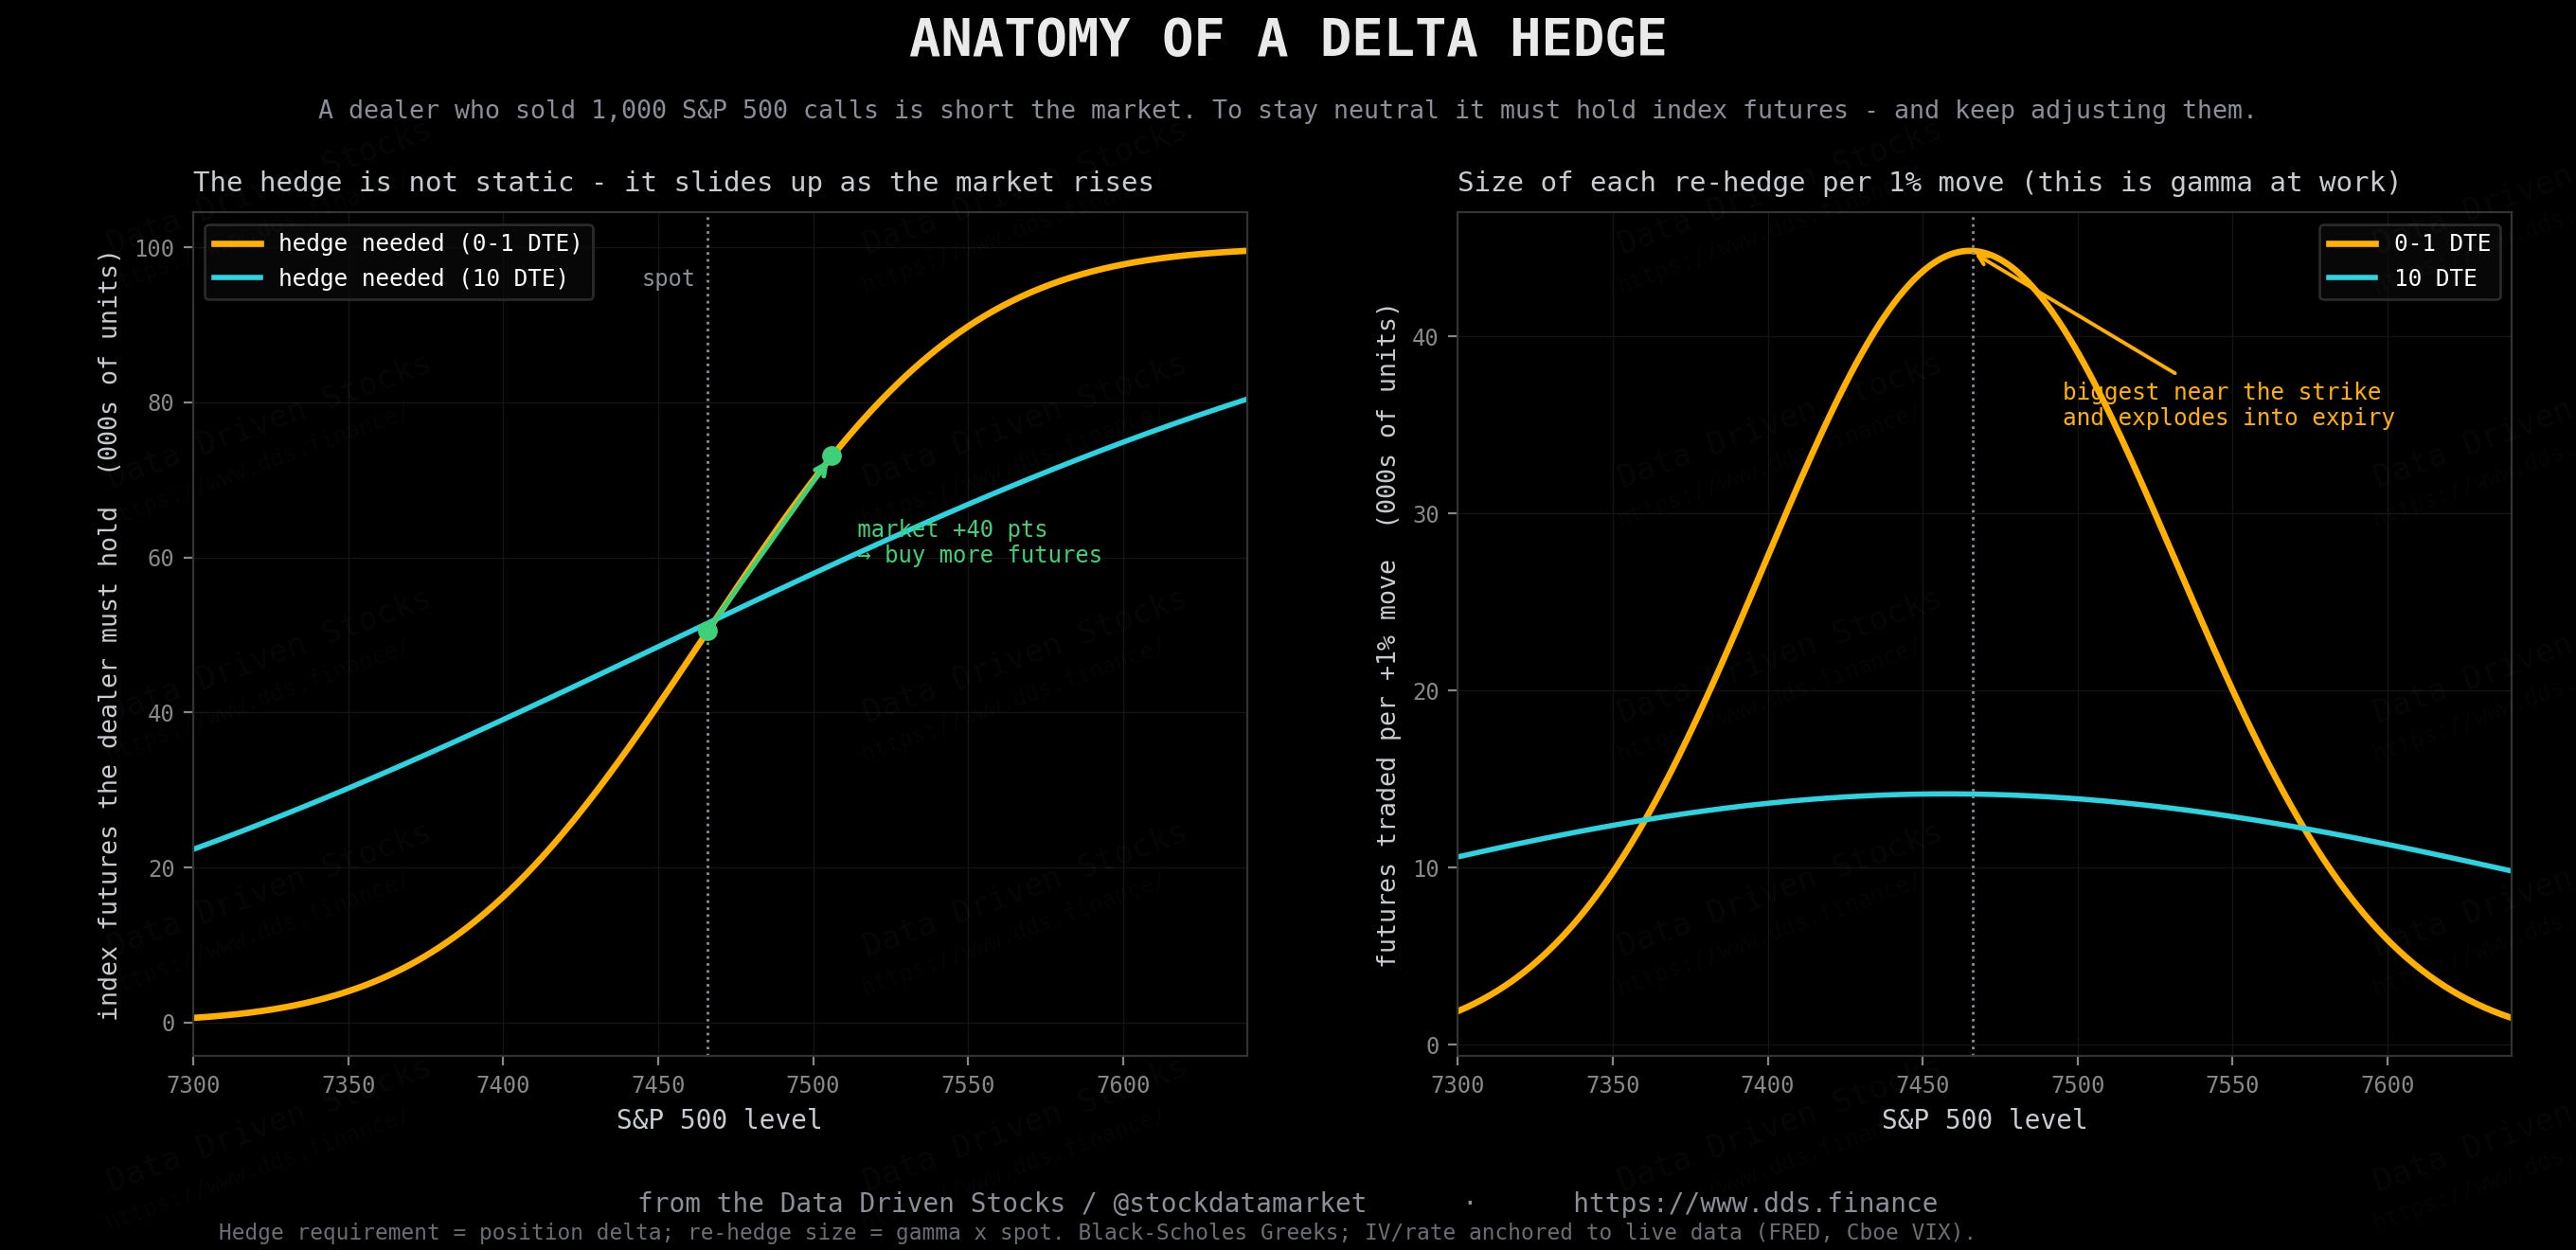
Notice the right-hand panel above. For an option with weeks left, the re-hedging trade is modest and smooth. For an option expiring today, the same 1% move can force a dealer to buy or sell several times as much. That difference is not a footnote. It is the reason the modern market behaves the way it does, because today a remarkable share of all S&P options expire the very same day they are traded - 59% of total SPX volume in 2025, and a record 62.4% in a single month. When most of the open options on the index are this twitchy, the hedging they demand is twitchy too.
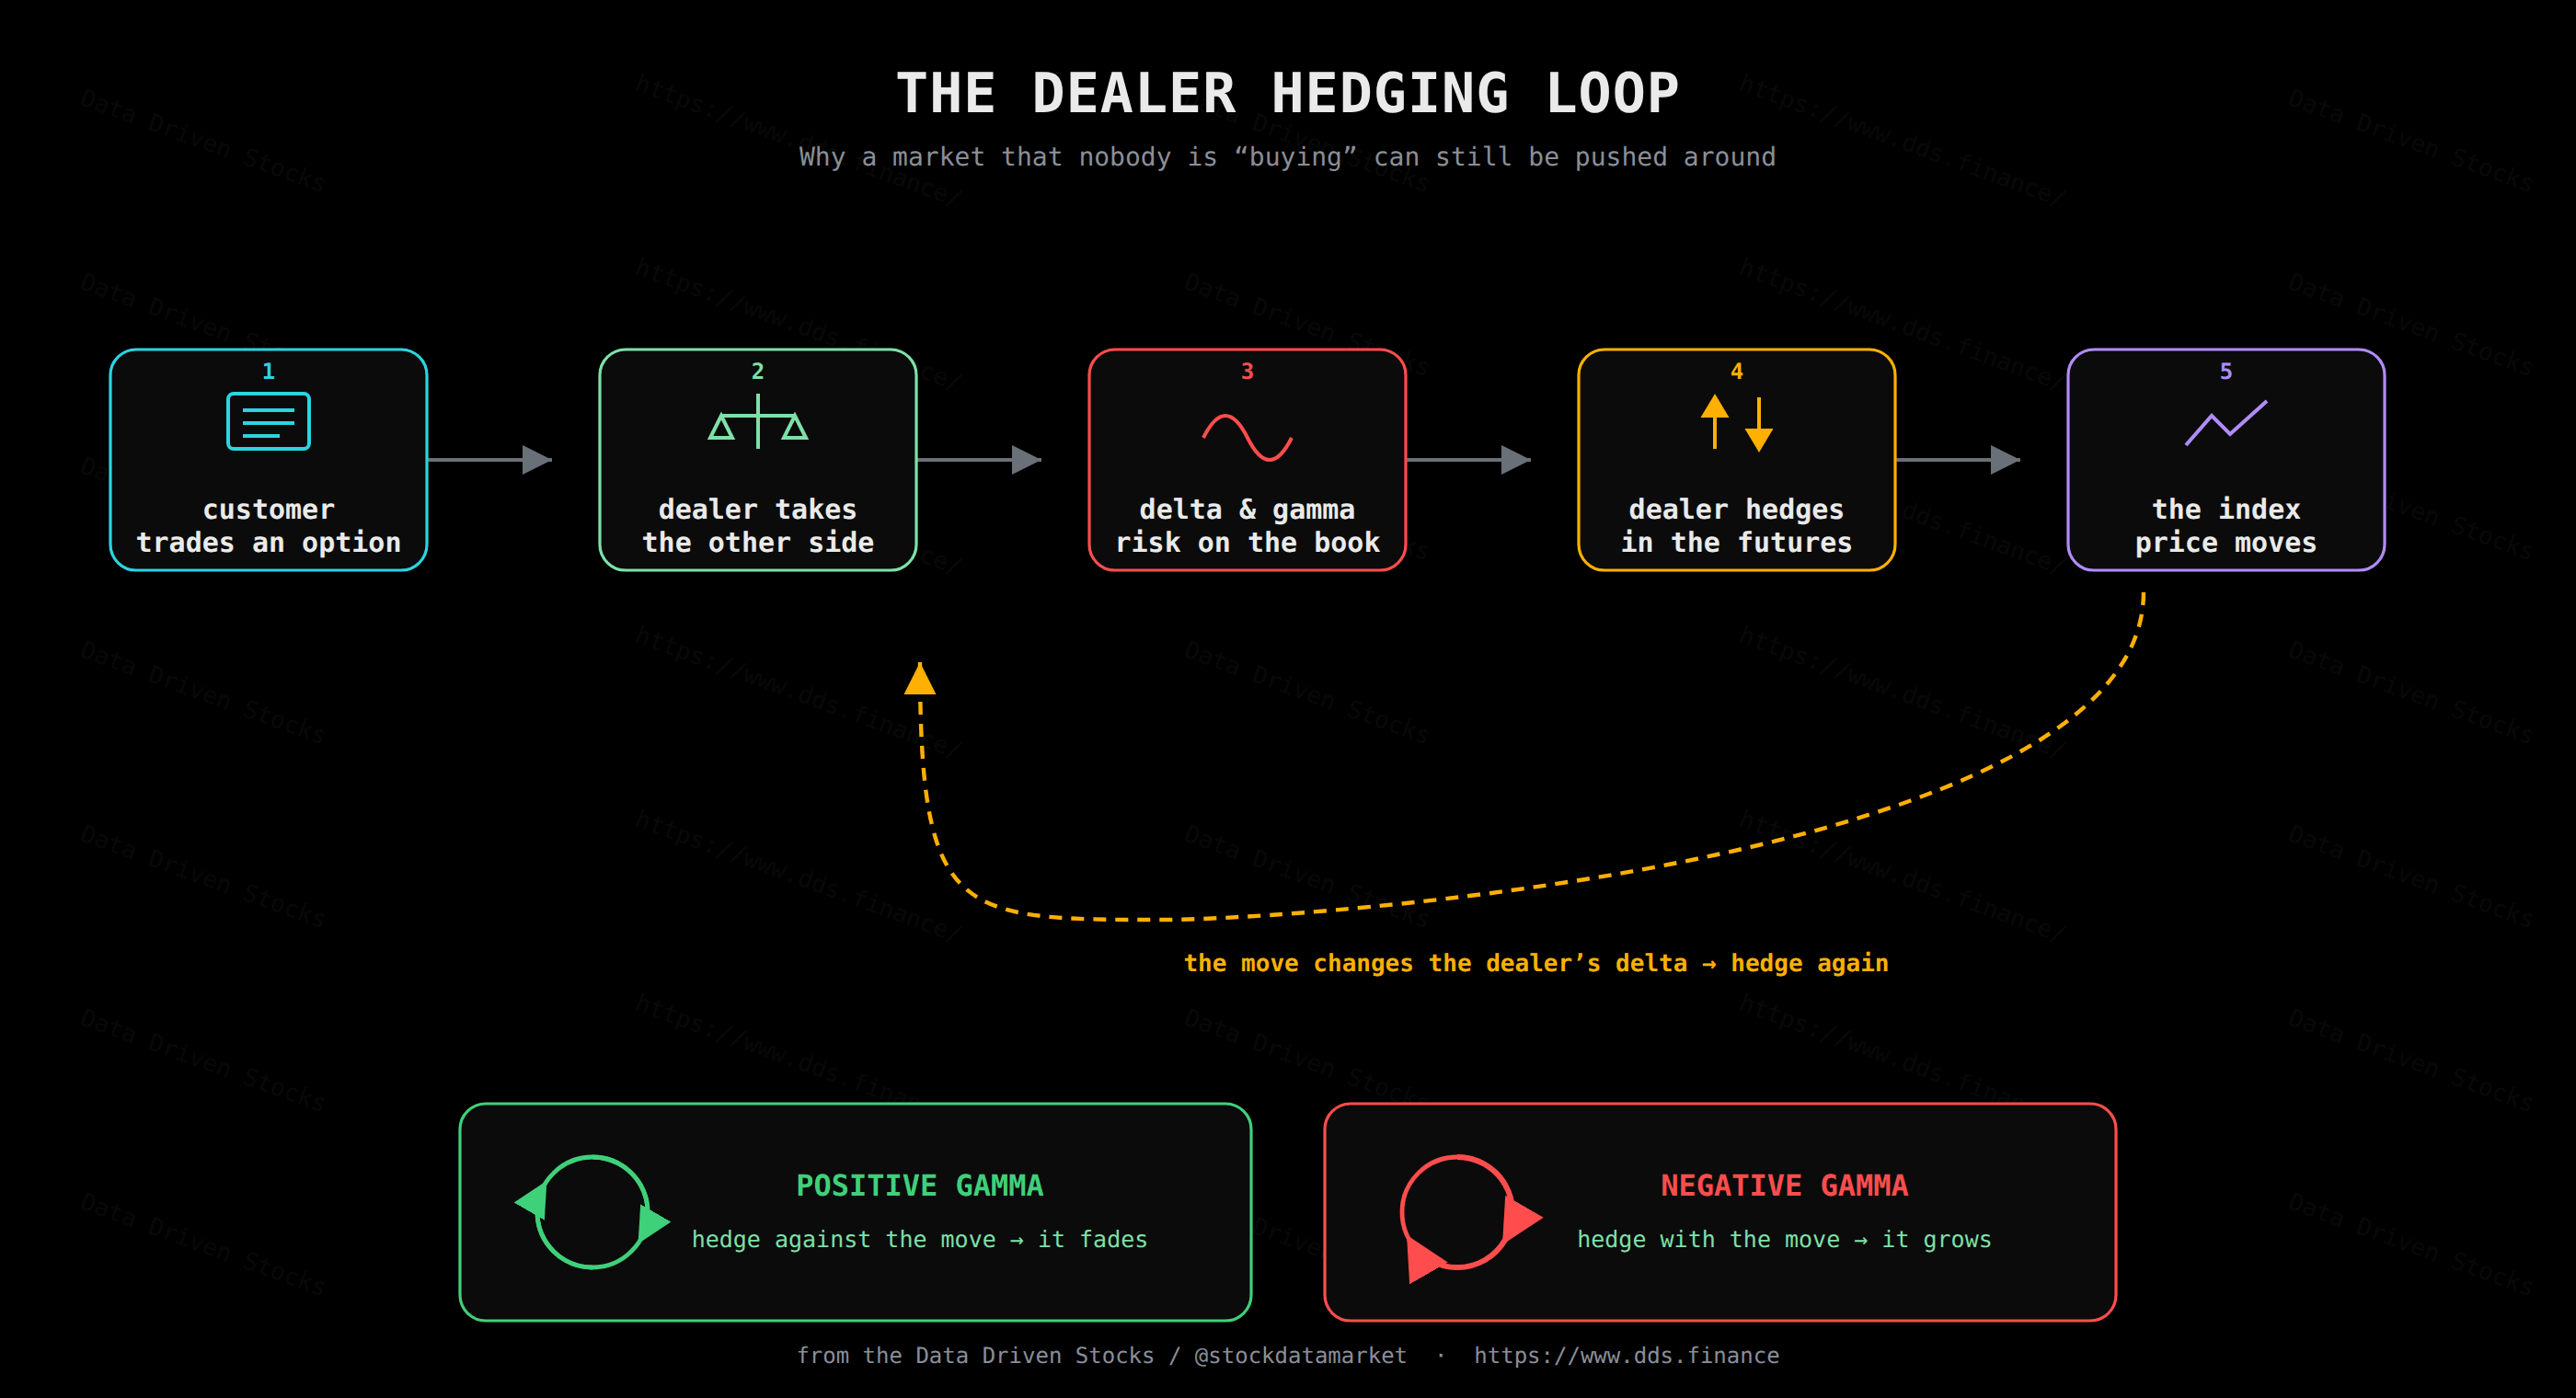
2. How the reaction moves the market: the feedback loop
