The Labor Market Is Getting Weaker and Weaker Under the Hood
The headline was bad. The details were worse. And the revisions? Don’t even get us started.
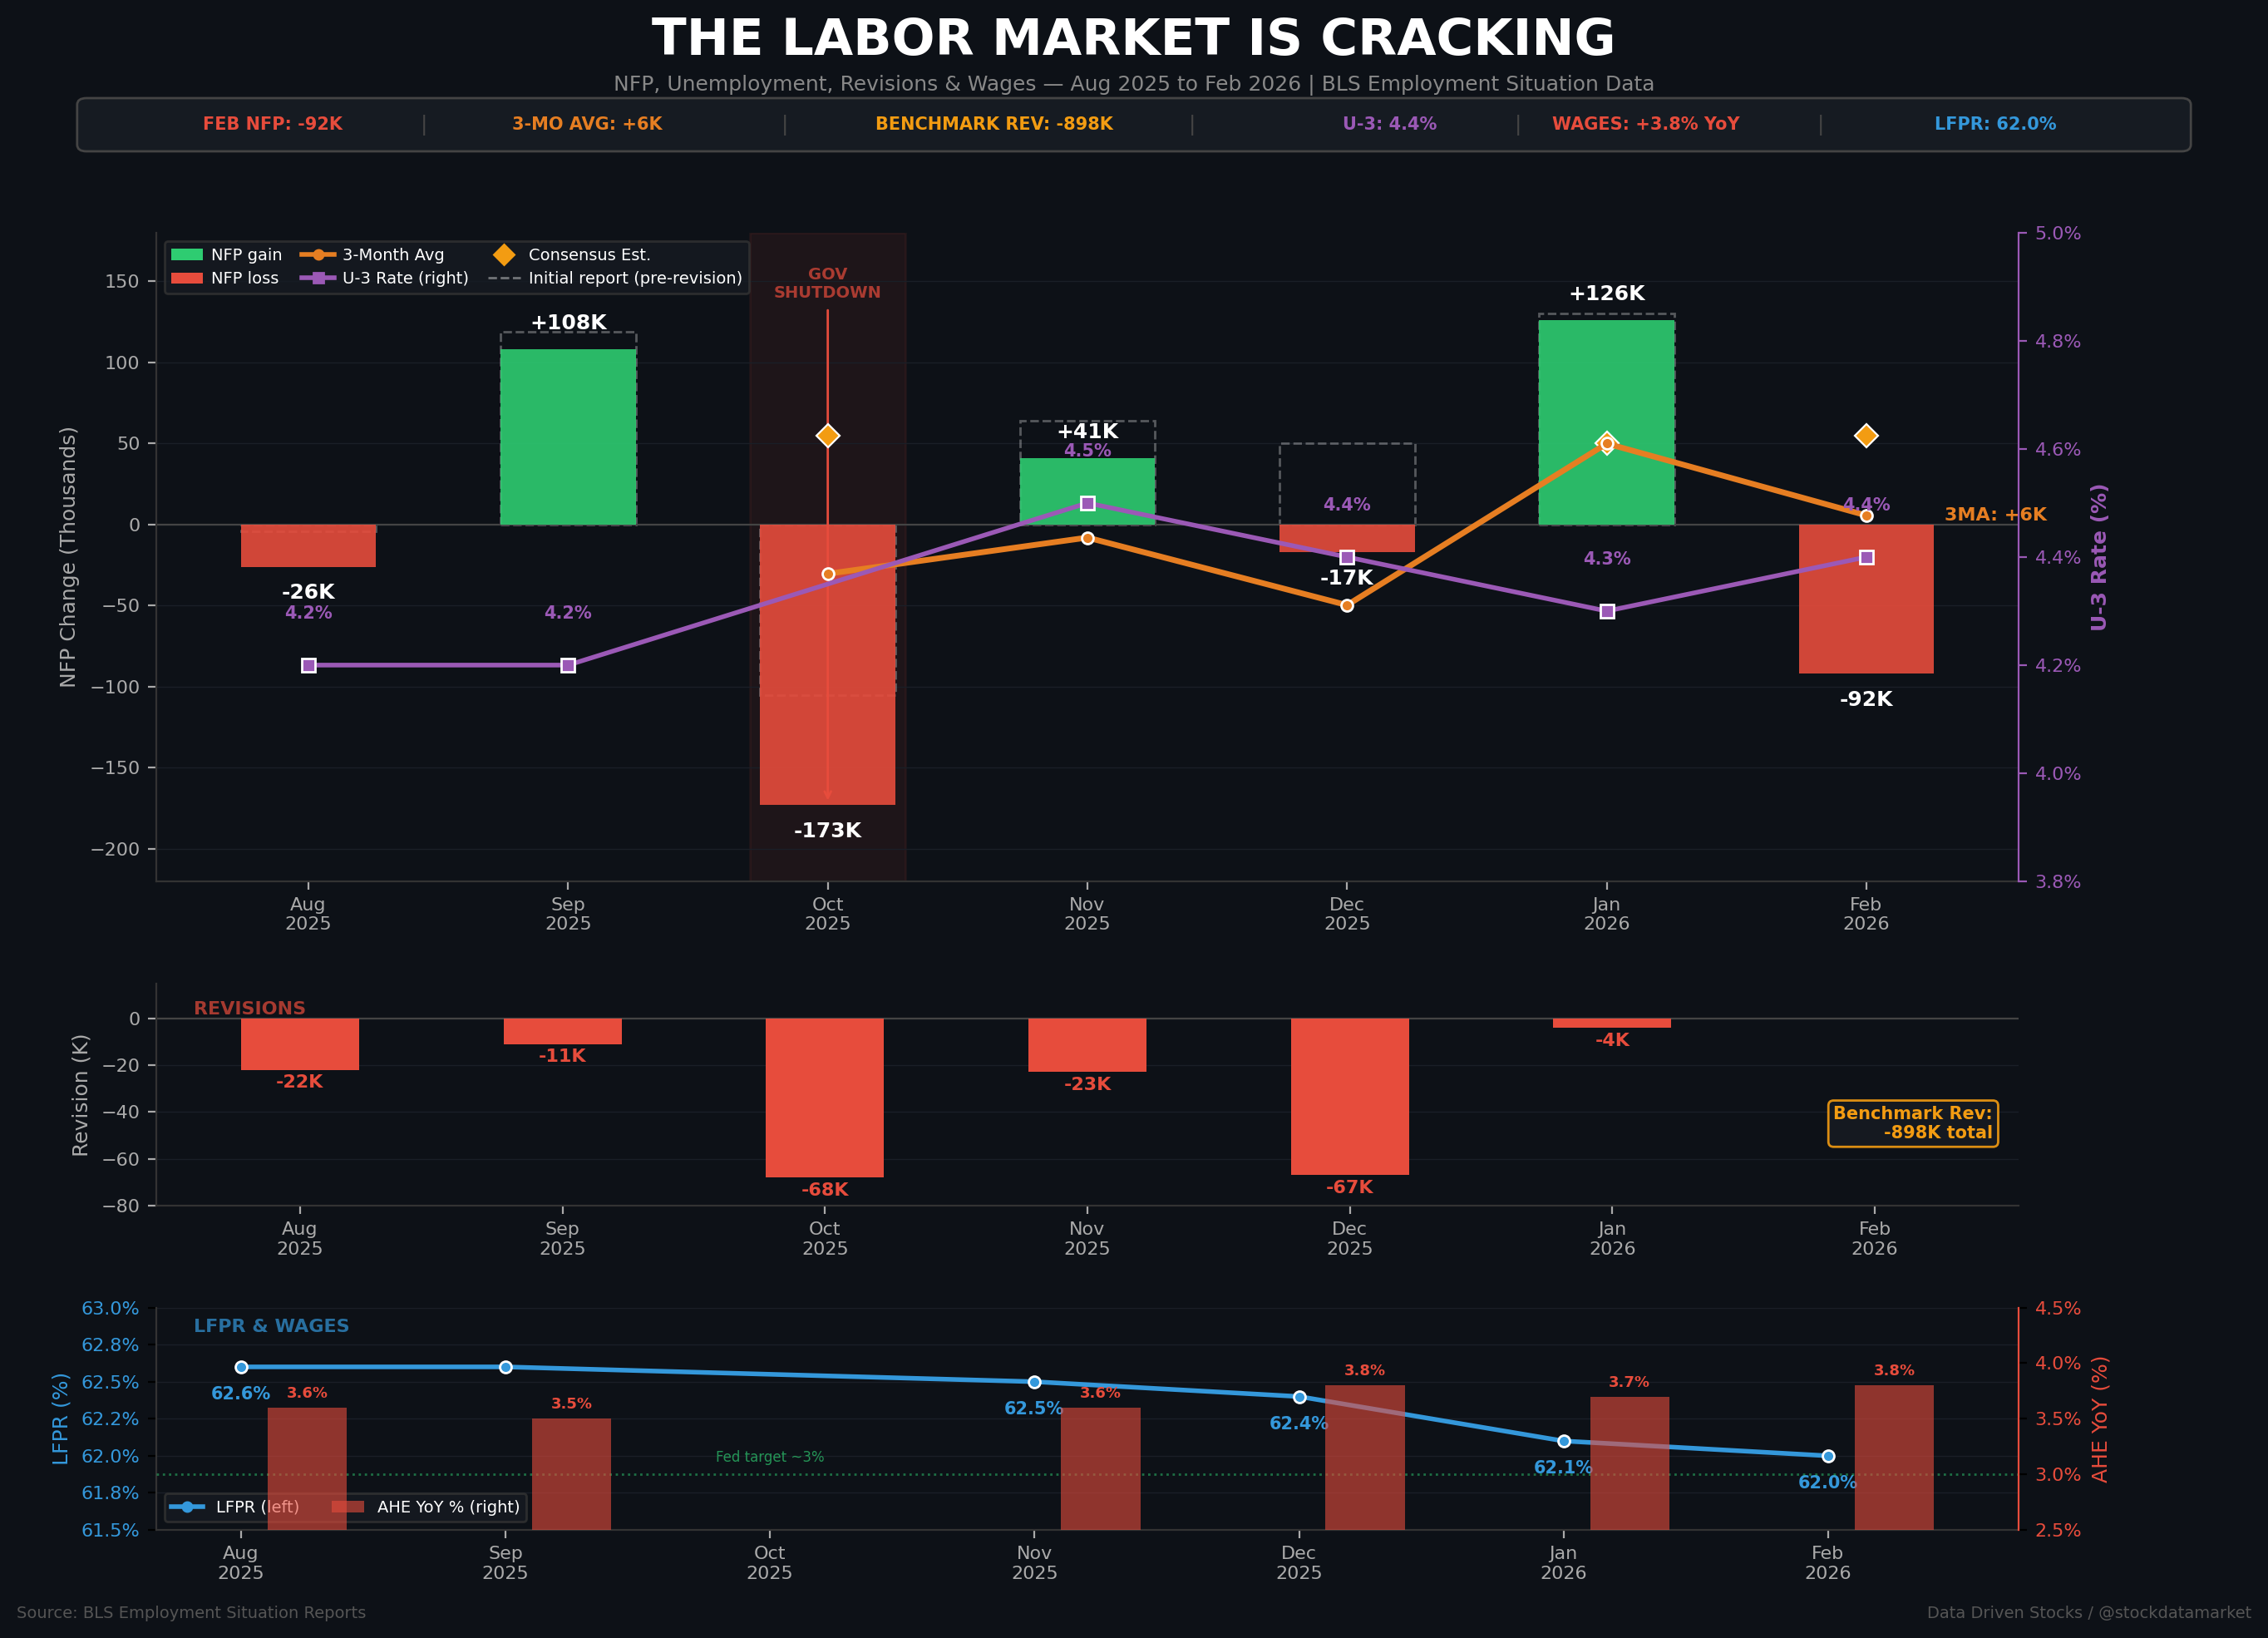
On March 6, the Bureau of Labor Statistics dropped the February 2026 Employment Situation report, and it confirmed what anyone paying close attention already suspected: the US labor market isn’t just cooling — it’s cracking. Nonfarm payrolls came in at -92,000, blowing past the consensus estimate of roughly +55,000 like it wasn’t even there. That’s not a miss. That’s a different universe.
But February wasn’t an isolated event. It was the third negative payroll print in the last five months. The economy shed jobs in October (-173K), December (-17K), and now February (-92K). The only positive months — November at +41K and January at +126K — barely moved the needle. The three-month average NFP as of February sits at roughly +6,000 per month. That’s not growth. That’s a flatline with a pulse so faint you need a stethoscope to find it.
Let’s dig into the numbers and understand exactly what’s happening beneath the surface.
The February 2026 Report: A Broad-Based Collapse
The February print wasn’t just one sector dragging everything down. The weakness was everywhere.
Healthcare, which had been the economy’s most reliable job engine for the past two years, suddenly shed 28,000 jobs. Most of that was driven by the Kaiser Permanente strike involving roughly 31,000 workers — a temporary hit, sure, but it still shows up in the data and it still matters. Leisure and hospitality dropped 27,000, manufacturing lost 12,000, construction lost 11,000, and the federal government cut another 10,000.
That last number deserves extra attention. Federal government employment has now declined by a staggering 330,000 jobs — 11% of the total federal workforce — from its October 2024 peak. The 43-day government shutdown that started in October 2025 kicked off a cascade of layoffs, deferred-resignation programs, and hiring freezes that are still reverberating through the data.

Five Months of Deterioration
Zoom out a bit, and the picture gets even uglier.
From October 2025 through February 2026, the economy lost jobs in three out of five months. The cumulative net change over that stretch was roughly -115,000 jobs. That’s not a slowdown. That’s contraction.
October was the worst at -173K, largely driven by the shutdown’s immediate impact. November and January both showed modest rebounds, but neither was strong enough to reverse the trend. December, which was initially reported as a decent +50K, eventually got revised all the way down to -17K — a swing of 67,000 jobs across two revision cycles.
The trajectory here is what matters most. We went from a three-month average NFP of roughly +50K back in mid-2025 to just +6K as of February 2026. The labor market isn’t accelerating into weakness overnight — it’s grinding lower month after month, each report a little worse than the last.

The Revision Massacre: It Was Always Worse Than Reported
Here’s where the story gets really uncomfortable.
Every single month in late 2025 was revised downward. Not some months. Not most months. Every. Single. One.
August went from -4K to -26K. September went from +119K to +108K. October swung from -105K to -173K — a 68K downward revision. November dropped from +64K to +41K. And December? That one is the most dramatic of all. Initially reported as +50K, it was revised to +48K, then all the way down to -17K. A total swing of -67K across two cycles.
But the monthly revisions are just the appetizer. The main course was the annual benchmark revision released on February 11, 2026. It revised total nonfarm employment down by 898,000 jobs for the period through March 2025. That’s nearly a million jobs that were originally reported as existing but never actually did.
What does that mean in practical terms? It means that 2025 job growth — which was originally reported as an average of 49,000 per month — was actually just 15,000 per month. That makes 2025 the weakest non-recession year for employment since 2003. All those “resilient labor market” narratives from last year? They were built on data that turned out to be wrong.

Under the Hood: Participation Is Dropping
The headline unemployment rate has been remarkably stable — bouncing between 4.3% and 4.5% over the past four months. In February, it ticked up to 4.4% from January’s 4.3%. That looks benign.
But stability in U-3 can be deceptive when people are leaving the labor force entirely. The labor force participation rate fell to 62.0% in February — the lowest level since late 2021. That’s a half-percentage-point drop from the 62.5% reading in November 2025, once you adjust for the population control changes.
This is the key dynamic that most people miss. The unemployment rate stays “low” partly because workers are dropping out of the labor force altogether. They’re not being counted as unemployed because they’ve stopped looking. When you see LFPR falling alongside stable U-3, that’s not a sign of health — it’s a sign that the denominator is shrinking.
Long-term unemployment tells a similar story. In February, 1.9 million Americans had been unemployed for 27 weeks or longer, representing 25.3% of all unemployed workers — the highest share since late 2021. Average unemployment duration reached 25.7 weeks, also the longest since December 2021. Once you lose your job in this market, it’s taking longer and longer to find a new one.
The one genuine bright spot was the U-6 rate, which fell to 7.9% from a revised 8.1% in January. That was driven by a 477,000 decline in people working part-time for economic reasons and a 109,000 drop in discouraged workers. But given the rest of the picture, that improvement looks more like statistical noise than a real improvement in conditions.

The Stagflation Problem: Hot Wages, Cold Hiring
Here’s the part that should make the Fed lose sleep.
Average hourly earnings came in at +0.4% month-over-month in February — double the ~0.2% pace consistent with the Fed’s 2% inflation target. Year-over-year, wages grew 3.8%, with the absolute level reaching $37.32 per hour. Both figures came in above consensus expectations.
This has been the pattern for months. November was +0.1% MoM, but December, January, and February all printed 0.3% or above. The year-over-year rate has been stuck in the 3.6%–3.8% range — well above what the Fed needs to see for comfort on inflation.
The combination is toxic for monetary policy. You have collapsing payrolls on one hand — screaming for rate cuts — and sticky wage growth on the other — arguing against them. This is the textbook definition of a stagflationary bind. You can’t cut rates to stimulate the economy without risking higher inflation. You can’t hold rates steady without watching the labor market deteriorate further.
Markets have gotten the message. As of March 6, futures priced in a 95.5% probability that the Fed holds rates steady at the March 17-18 FOMC meeting. The Fed is stuck, and everyone knows it.

GDP Confirms the Slowdown
The labor market doesn’t exist in a vacuum, and the GDP data is telling the same story.
Real GDP growth decelerated sharply from 4.4% annualized in Q3 2025 to just 1.4% in Q4 2025. That’s a 3-percentage-point swing in a single quarter. Even adjusting for the direct impact of the government shutdown — which the BEA estimates subtracted roughly 1.0 percentage point — growth would have been about 2.4%. Still a meaningful slowdown from Q3.
The damage was concentrated in government spending, which plunged 5.1% overall and a staggering -16.6% on the federal side. Consumer spending held up reasonably well at +2.4%, and business investment was decent at +3.7%, but those pillars couldn’t offset the government drag.
The full-year 2025 GDP picture came in at 2.2%, down from 2.8% in 2024. The trajectory over the four quarters was wild: Q1 contracted at -0.6%, Q2 rebounded to +3.8%, Q3 surged to +4.4%, and then Q4 collapsed to +1.4%.
Looking ahead, the Atlanta Fed’s GDPNow model estimated Q1 2026 growth at 2.1% as of March 6 — down from 3.1% just two weeks earlier on February 20. The incoming data is deteriorating in real time.

What Comes Next
The next two data points will be critical for determining whether this is a temporary government-shutdown-induced dip or something more structural.
On March 13, the BEA releases the second estimate for Q4 2025 GDP. If it gets revised further downward, that tightens the narrative of genuine economic weakening. Then on April 3, we get the March 2026 jobs report — the first one covering a month fully clear of shutdown distortions. If March NFP comes in weak, the “it was just the shutdown” argument falls apart.
The Fed meets March 17-18 with virtually no chance of a cut. But if the data keeps deteriorating through April, the calculus for the May and June meetings changes dramatically. The problem is that sticky wages give the hawks plenty of ammunition to argue for patience.
For now, the labor market is telling a clear story: weaker hiring, rising long-term unemployment, falling participation, and revisions that consistently show the reality was worse than initially reported. The headline unemployment rate may still look manageable at 4.4%, but under the hood, the engine is running rough.
Sources
BLS Employment Situation Report, February 2026 (released March 6, 2026): https://www.bls.gov/news.release/empsit.nr0.htm
BLS Employment Situation Report, January 2026 (released February 11, 2026): https://www.bls.gov/news.release/archives/empsit_02112026.htm
BLS Employment Situation Report, December 2025 (released January 9, 2026): https://www.bls.gov/news.release/archives/empsit_01092026.htm
BLS Employment Situation Report, October/November 2025 (released December 16, 2025): https://www.bls.gov/news.release/archives/empsit_12162025.htm
BLS U-6 Data: https://www.bls.gov/news.release/empsit.t15.htm
BLS Earnings Data: https://www.bls.gov/news.release/empsit.t19.htm
BEA GDP Advance Estimate Q4 2025 (released February 20, 2026): https://www.bea.gov/sites/default/files/2026-02/gdp4q25-adv.pdf
BEA GDP Q3 2025 Updated Estimate (released January 22, 2026): https://www.bea.gov/sites/default/files/2025-12/gdp3q25-ini.pdf
Atlanta Fed GDPNow: https://www.atlantafed.org/cqer/research/gdpnow
FRED Real GDP Series: https://fred.stlouisfed.org/series/GDPC1
FRED Real GDP Percent Change: https://fred.stlouisfed.org/series/A191RL1Q225SBEA


