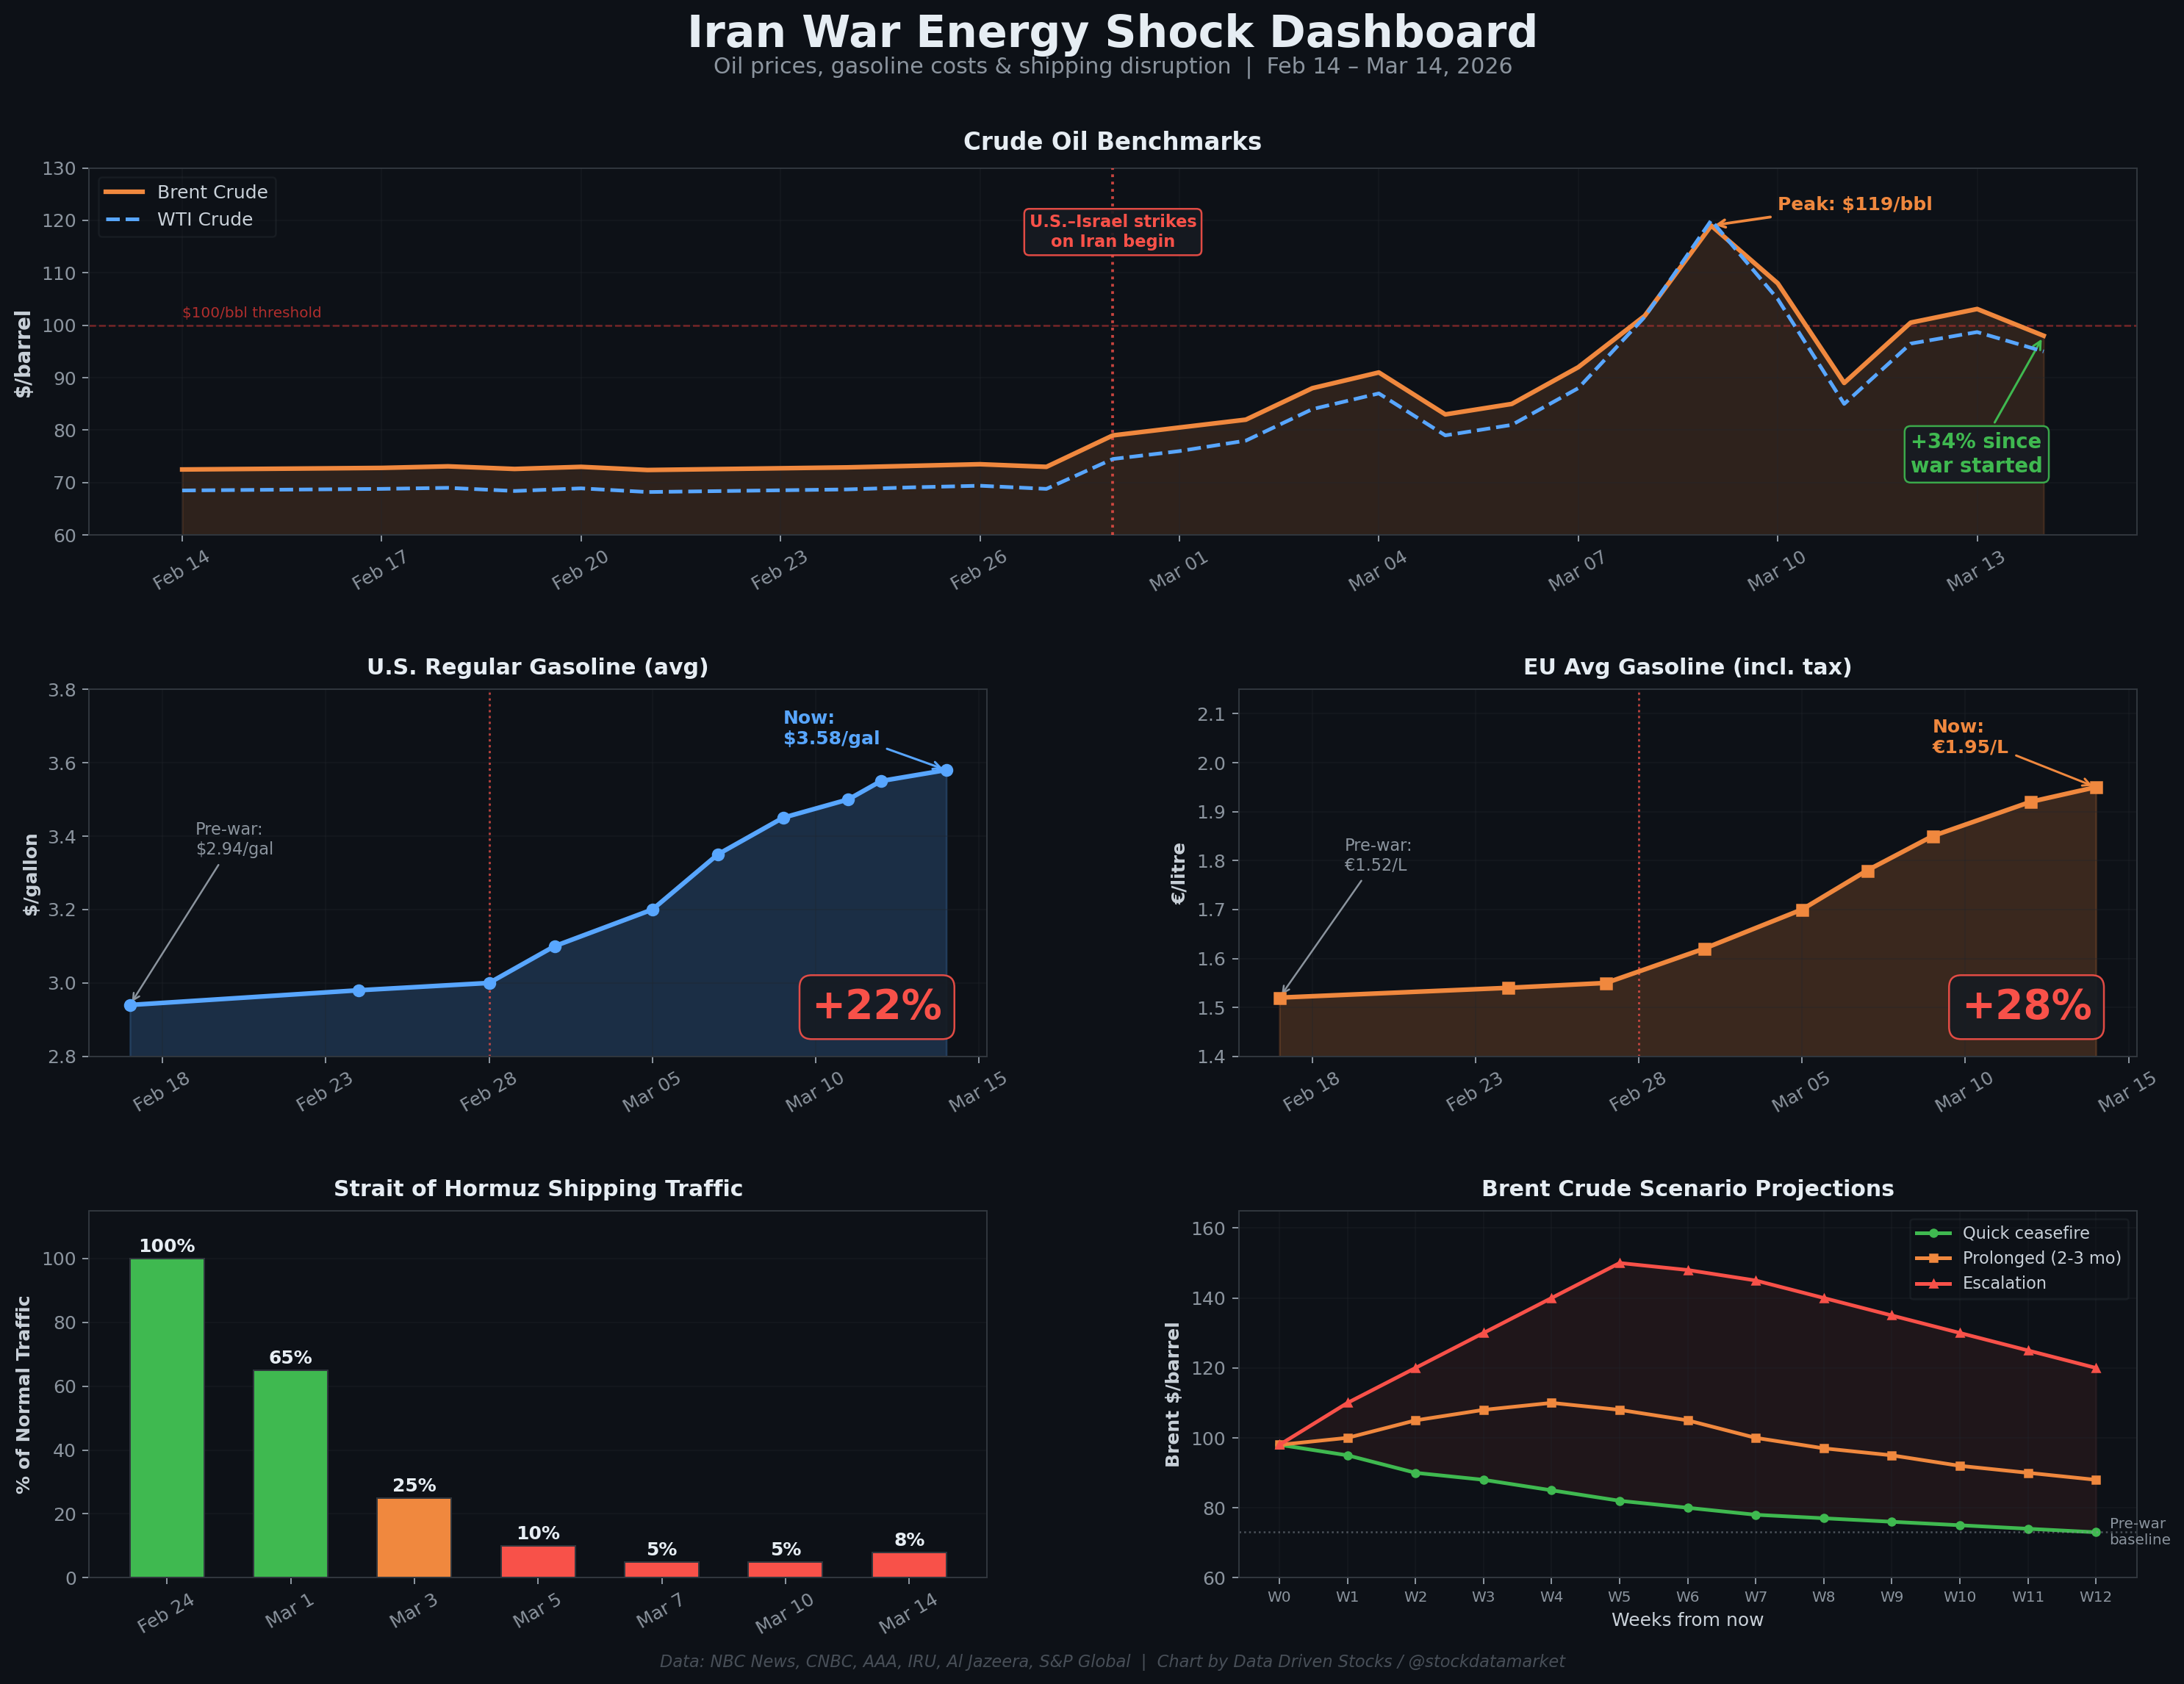
The Iran War Will Make Filling Your Tank a Whole Lot More Expensive
How the Strait of Hormuz shutdown is repricing gasoline — and what your next fill-up will cost in the U.S. and Europe

Two weeks ago, you were probably filling up your tank without thinking twice about it. Regular unleaded in the U.S. was hovering around $2.94 a gallon — not cheap, but manageable. In Europe, drivers were paying about €1.52 per litre at the pump, which is just the cost of doing business on a continent that taxes fuel like it’s a luxury good.
Then the bombs started falling.
On February 28, the United States and Israel launched joint military strikes on Iran. Within hours, Tehran retaliated by effectively shutting down the Strait of Hormuz — the narrow waterway between Iran and Oman through which roughly one-fifth of the world’s oil supply passes every single day. That’s about 20 million barrels per day, or more than one-quarter of all seaborne oil trade on the planet.
The result? The largest supply disruption in the history of the global oil market, according to the International Energy Agency. Brent crude — the global benchmark — briefly spiked to $119 per barrel before pulling back, and as of Friday March 14 it closed at $103.14. U.S. crude (WTI) settled at $98.71. Both benchmarks are sitting at levels not seen since the Russia-Ukraine energy crisis of 2022.
And all of that is showing up at the pump. Fast.
The Scale of This Disruption Is Unprecedented
To understand why this matters so much, you need to understand the chokepoint. The Strait of Hormuz is only 21 nautical miles wide at its narrowest point, and it carries oil exports from Saudi Arabia, Iraq, Kuwait, the UAE, and Qatar. When Iran declared the strait effectively closed to tanker traffic through threats, drone attacks, and mine-laying operations, shipping volumes collapsed almost overnight. S&P Global Market Intelligence reported that traffic through the strait dropped by 95% in the first week of March alone.

This is not a marginal event. Rapidan Energy Group noted that the Iran conflict has disrupted 20% of global oil supply for over two weeks running — more than double the previous record set during the Suez Crisis of 1956–57, which disrupted just under 10%. RBC Capital Markets chief commodities strategist Helima Croft put it bluntly: this situation dwarfs what happened during the Russia-Ukraine crisis.
The OPEC+ production group met and agreed on a larger-than-expected output increase, but as Croft pointed out, that’s almost a moot point when the sea passage to get those barrels to market is blocked. Iraq is already shutting in production because it cannot export through the strait. Saudi Aramco’s Ras Tanura refinery and export terminal has closed. Qatar declared force majeure on its entire LNG production — a country that supplies 20% of global liquefied natural gas.
The barrels are stranded. And that’s what sends prices through the roof.
How Oil Prices Translate Into Gas Prices (The Mechanical Chain)
Here’s the thing most people don’t think about: the price you pay at the pump is not just “oil price + a little markup.” There’s a multi-step transmission chain that connects a barrel of Brent crude sitting on a tanker somewhere in the North Sea to the price on the sign at your local gas station.
The EIA breaks down U.S. retail gasoline into four components: the crude oil cost, the refining margin (crack spread), the distribution and marketing margin, and taxes. Each layer adds cost and each layer has its own dynamics during a supply shock.
The basic arithmetic is straightforward. One barrel of oil contains 42 gallons. So a $10 increase in crude translates to about $0.238 per gallon, or roughly 24 cents. A $30 increase per barrel — which is approximately what we’ve seen from pre-war levels — translates to about 71 cents per gallon in crude-equivalent terms. But the actual pump price impact can be more or less than that, depending on what happens to refining margins, distribution costs, and whether governments adjust taxes.
In Europe, the math is different because the tax wedge is enormous. The IMF models after-tax fuel prices as (1 + VAT) × (pre-tax price + excise tax). In countries like the Netherlands, France, and Germany, taxes account for 60–63% of the total pump price. That means the crude oil component is a smaller share of the total, so a given dollar increase in crude oil translates to a smaller percentage increase in the final price. But VAT — being a percentage-based tax — still amplifies the pre-tax increase. A $30/bbl crude shock translates to about 18.9 cents per litre in pre-tax terms, and once you add 20% VAT, that becomes about 22.6 cents per litre with tax.

The speed at which this pass-through happens varies dramatically by market. The most cited empirical work on U.S. retail adjustment — from Borenstein and Cameron — finds that upward crude shocks pass through to the pump almost completely within about four weeks. Downward movements, notably, take about eight weeks — which is the classic “rockets and feathers” asymmetry that means consumers get hit fast on the way up and see relief slowly on the way down.
In France, high-frequency data from the Banque de France (using millions of daily station-level observations) shows that a 1% change in Rotterdam wholesale gasoline translates to roughly 0.8% at the retail level, with full pass-through in about three weeks. Germany is slower: evidence from the Bundeskartellamt’s Market Transparency Unit suggests pass-through takes six to eight weeks under common lag specifications. The IMF’s broader cross-country work confirms this general pattern — the retail fuel response is concentrated in the current and following month, then fades within about two months, with countries that have high fuel excise taxes showing smaller percentage responses.
What this means for the current crisis: American drivers are already feeling close to the full impact of the initial crude shock. Europeans — especially in Germany, Spain, and Italy — still have more pain in the pipeline.
What You’re Paying Right Now
Let’s talk real numbers. As of March 14, 2026, U.S. drivers are paying an average of $3.58 per gallon for regular gasoline, according to AAA and GasBuddy data. That’s up from $2.94 before the war — a 22% increase, or about 64 cents more per gallon. In California, where refinery constraints make the market especially tight, drivers are paying over $5.34 per gallon. Louisiana, with its domestic oil production and refining capacity, is at $3.20.
In Europe, the picture is even more varied because tax regimes differ so dramatically from country to country.

Ireland is now the most expensive place to fill up in the EU at €2.30 per litre. The Netherlands, Finland, France, and Italy have all breached €2.00 per litre. Germany is right at €2.02. Spain, which had relatively lower fuel taxes, saw the largest percentage increase at 27%, reaching €1.79 per litre. The EU weighted average has hit approximately €1.95 per litre, up from €1.52 before the war — a 28% jump.
Diesel, which powers the trucks that move everything else in the economy, is even worse. U.S. diesel hit $4.86 per gallon as of March 9 — up 28% from pre-war levels. In Germany, France, Italy, Finland, and the Netherlands, diesel has crossed the €2.00 per litre mark. This is the price that really matters for consumer goods inflation, because it feeds directly into shipping costs. FedEx’s fuel surcharge has already jumped to 24.75% for the week ahead.
If you convert U.S. gasoline prices to euro-per-litre for an apples-to-apples comparison, American drivers are paying roughly €0.85 per litre. That’s less than half what most Europeans pay. The difference is almost entirely tax — the U.S. only loads about 18% tax onto the pump price, while European countries layer on 57–63%.
Modeling the Near-Future: Three Scenarios for Your Wallet
The question everyone wants answered is simple: how much worse is this going to get? The honest answer depends entirely on what happens with the war. So instead of pretending we know the future, let’s model three scenarios based on the pass-through mechanics outlined above and the Brent crude trajectories that different war outcomes imply.

Scenario 1 — Quick Ceasefire (Brent returns to ~$75 by week 4–6): If the conflict wraps up within the next two to three weeks — which is what President Trump has repeatedly suggested by saying the war will be over “very soon” — oil prices would likely retreat toward pre-war levels relatively quickly. But here’s the catch: retail gasoline prices would still lag behind on the way down. That rockets-and-feathers asymmetry means American drivers would probably still be paying around $3.20–3.30 per gallon four to six weeks from now even if Brent drops back to $75 this week. EU prices would similarly take several weeks to normalize. Under this scenario, U.S. gas settles near $3.00 by late May. EU prices drift back toward €1.58–1.62 per litre.
Scenario 2 — Prolonged Conflict (Brent hovers $95–110 for 2–3 months): This is the scenario many analysts currently view as most probable. If the war drags on through April and into May, with the Strait of Hormuz remaining effectively closed or severely restricted, oil prices would likely stabilize in the $95–110 range (even with IEA reserve releases). U.S. gasoline would peak around $3.95–4.05 per gallon by week 5–7 as the full pass-through completes and refining margins widen. The psychological $4.00 per gallon threshold — which has historically triggered political panic in Washington — would be breached. In the EU, prices would peak around €2.20–2.25 per litre. For a typical American household burning about 100 gallons per month, this means a monthly gas bill of roughly $405 versus $298 pre-war — an extra $107 per month or about $1,280 per year. For a European household using about 100 litres per month, the monthly cost rises from €152 to €224 — an extra €72 per month.
Scenario 3 — Escalation (Brent surges to $130–150): If the conflict expands further — major strikes on Saudi, Kuwaiti, or Emirati oil infrastructure, full naval blockade of the strait, or spread of the conflict to new fronts — all bets are off. Some analysts, including Iran’s own military spokesperson, have warned of $200 oil. A more conservative escalation scenario puts Brent at $130–150 sustained. At those levels, U.S. gasoline would blow past $5.00 per gallon nationally (and well past $6.00 in California). EU gasoline would hit €2.65–2.75 per litre. The monthly household cost impact: an extra $212 per month in the U.S. and an extra €123 per month in the EU. This scenario also triggers the kind of second-round inflation effects that make central bankers lose sleep.
The Inflation Ripple Effect
Gasoline prices don’t exist in a vacuum. They feed into everything — from the cost of trucking food to your grocery store, to airline ticket prices, to the fertilizer that grows next year’s wheat crop. The IMF’s rule of thumb is that every 10% rise in oil prices corresponds to roughly 0.4 percentage points of additional inflation and 0.15% reduction in economic growth.

JPMorgan economists estimate that with U.S. oil prices up roughly 42% from pre-war levels, inflation in the United States could climb from the 2.4% level recorded in January to 3% or higher in the coming months. Gregory Daco, chief economist at EY-Parthenon, went further, estimating that the March monthly inflation print could hit as high as 1% — which would be the highest monthly increase in four years.
In Europe, the picture is equally concerning but structurally different. Oxford Economics estimates that eurozone inflation would run about 0.5–0.6 percentage points higher in Q4 2026 than previously forecast. Under a sharper shock scenario (oil at $100, gas at €60/MWh), Euronews reported that inflation could average 2.4% across 2026 with a second-quarter peak above 3%, and growth would slow to about 0.8%. Polymarket now implies a 42% probability of an ECB rate hike in 2026 — up from just 12% before the conflict started.
The big difference from 2022 is that Europe has diversified away from Russian energy dependence somewhat. Companies like Uniper have shifted to LNG imports from the U.S., Canada, Australia, and pipeline gas from Norway. But the Iran crisis has exposed a new vulnerability: Qatar, which became a key LNG replacement source for Europe, is now itself offline. Europe started 2026 with gas storage at just 46 billion cubic metres — compared to 60 bcm in 2025 and 77 bcm in 2024.
European governments are already scrambling. Germany is limiting gas station price changes to once per day to prevent gouging. Greece has capped profit margins on fuel and groceries for three months. Italy is looking at recycling extra VAT revenue from higher fuel prices to cushion consumers. France’s President Macron has raised the possibility of releasing 20–30% of emergency strategic reserves.
What About the IEA Reserve Release?
The International Energy Agency has agreed to release 400 million barrels from strategic reserves — the largest such coordinated action in history. That’s a significant move, roughly equivalent to about 20 days of global supply from the Strait of Hormuz at pre-war flow rates.
But here’s why it’s not a silver bullet. Strategic reserves are a buffer, not a solution. They buy time. If the strait reopens in a few weeks, the reserves can bridge the gap. If the conflict persists for months, 400 million barrels gets consumed and you’re back to the same supply deficit, only now your emergency cushion is thinner.
Markets seem to agree — Brent is still above $100 despite the reserve announcement. The reserve release puts a ceiling on how bad things can get in the short term, but it doesn’t change the fundamental equation: 20% of global oil supply is offline, and it’s going to stay offline until the shooting stops and tankers feel safe enough to transit the strait again.
The U.S. has also issued a 30-day sanctions waiver allowing India to buy Russian oil, and Trump has floated potential naval escorts through the strait. But as analysts noted, escorting a single tanker doesn’t change the supply equation when over a hundred vessels normally pass through the strait each day. The risk calculus for shipping companies — dealing with drone threats, mine risks, and cancelled war-risk insurance — is going to take more than a symbolic escort to resolve.
The Bottom Line for Your Wallet
Let’s cut through all the geopolitics and scenario modeling and answer the simple question: how much more are you going to pay?
If you’re an American driver filling up a typical 15-gallon tank: you’re already paying about $9.00 more per fill-up than you were two weeks ago. If the prolonged conflict scenario plays out, that gap widens to about $15–16 per fill-up. Under escalation, it could be $30 or more per fill-up. Over the course of a year with a prolonged conflict, that’s roughly $1,000–1,300 in additional fuel costs for a household with one car.
If you’re a European driver filling a typical 50-litre tank: the increase so far is about €21.50 per fill-up. Under prolonged conflict, expect €35–36 extra per fill. Under escalation, €55–60 extra. The annual burden runs between €850 and €1,500 extra depending on the scenario.
And these are just the direct fuel costs. They don’t include the secondary inflation effects — higher grocery bills, more expensive flights, rising delivery costs, and the general squeeze on household budgets that comes when energy prices spike.
The war in Iran didn’t just change the map of the Middle East. It changed the number on the pump — and that number is going to stay elevated for a while, no matter how this plays out. Even the best-case ceasefire scenario leaves prices above pre-war levels for weeks as the logistics of reopening the strait, restarting shut-in production, and rebuilding confidence in shipping insurance all take time.
Welcome to the new normal. Your wallet feels it already.
Sources
NBC News, “Oil soars 10% as the ‘largest supply disruption’ in history worsens,” March 12, 2026.
CNBC, “Oil closes above $100 for second day as market shrugs off U.S. measures to reduce prices during Iran war,” March 13, 2026.
Al Jazeera, “Oil prices swing wildly amid mixed messages over Iran war,” March 11, 2026.
Al Jazeera, “How will soaring oil prices caused by Iran war impact food costs?” March 10, 2026.
Al Jazeera, “Which countries have seen the highest petrol prices since the Iran war?” March 11, 2026.
Axios, “Oil tops $100 a barrel as Iran war escalates,” March 8, 2026.
NPR, “Oil prices surge, but no panic yet, as Iran war continues,” March 2, 2026.
Chicago Tribune / AP, “How the Iran war and surging oil prices are affecting consumers at the gas pump and beyond,” March 14, 2026.
CNN, “Rising prices and what Iran war could soon cost you,” March 12, 2026.
IRU, “War in Iran: fuel prices remain high and volatile,” March 13, 2026.
Euronews, “How high could Europe’s inflation go if the Iran war continues?” March 11, 2026.
CNBC, “The Iran war is pushing up European energy prices,” March 12, 2026.
Bruegel, “How will the Iran conflict hit European energy markets?” March 2, 2026.
Bloomberg, “Europe Rushes to Deal With Rising Energy, Food Prices From Iran War,” March 11, 2026.
Wikipedia, “Economic impact of the 2026 Iran war” (compiled data), accessed March 15, 2026.
EIA Short-Term Energy Outlook (STEO), Petroleum Product Price Module methodology.
Borenstein & Cameron, empirical pass-through estimates (U.S. retail adjustment speed).
Banque de France, high-frequency station-level pass-through research (2007–2018).
IMF, fuel excise taxes and pass-through working papers.
European Commission, Weekly Oil Bulletin.
Rapidan Energy Group, supply disruption analysis, March 2026.

