

The Dot-Com Bubble, the AI Boom, and the One Number Everyone Gets Wrong
Two technology manias, twenty-five years apart - what the dot-com era was really made of, why its most famous valuation statistic is a mirage, and where today’s AI build-out actually rhymes with it.

One note before we start. Wherever a dot-com-era dollar figure is set against a present-day one in this piece, the older figure has been adjusted into 2026 dollars, so the two eras are compared on equal purchasing power rather than face value - a dollar in 2000 is worth a little under two of today’s, which turns out to matter a great deal for the headline comparisons.
The thing keeping you up is probably this: whether what every fund manager now calls the AI trade is about to do to your portfolio what the internet did to your parents’ in 2001.
That worry is why the dot-com bubble gets pulled into every conversation about NVIDIA, Oracle and the rest. The comparison is everywhere, and it usually shows up with a scary number attached: a price-to-earnings ratio in the hundreds, a chart of the NASDAQ going over a cliff, the reminder that we have all watched this happen once before. The instinct is right. The trouble is that the specific numbers people grab for are mostly wrong, and the things that should actually worry you are not the ones in the headlines. So let’s go through it slowly, with the real figures, and separate what rhymes from what doesn’t.
The dot-com era was not a fairy tale
Start with the part that gets flattened every time the story is told. The dot-com boom was not, in the main, a pile of companies selling dog food at a loss. Pets.com and Webvan are the names that stuck because they were the most absurd, but they sat in the tail of the distribution, not its center. The companies that carried the index to its peak were, for the most part, highly profitable, fast-growing businesses planted in the middle of a genuine build-out.
Look at what they actually reported, and to keep the eras honest, the older figures here are in today’s money, the same scale as the numbers later on. Intel went from around 36 billion dollars of revenue in 1995 to about 65 billion at its 2000 peak, and in that peak year it cleared more than 20 billion in net income. That is profit, not revenue. Cisco grew net sales close to ninefold in real terms, from roughly 5 billion in fiscal 1995 to about 42 billion by fiscal 2001, compounding near 43 percent a year. Dell ran from a few billion to roughly 60 billion over the same window. Microsoft went from about 13 billion in fiscal 1995 to 48 billion in fiscal 2001, and by 2000 it was throwing off more than 18 billion of profit a year. None of these were concept stocks. They were cash machines bolted onto the biggest infrastructure story of the decade.
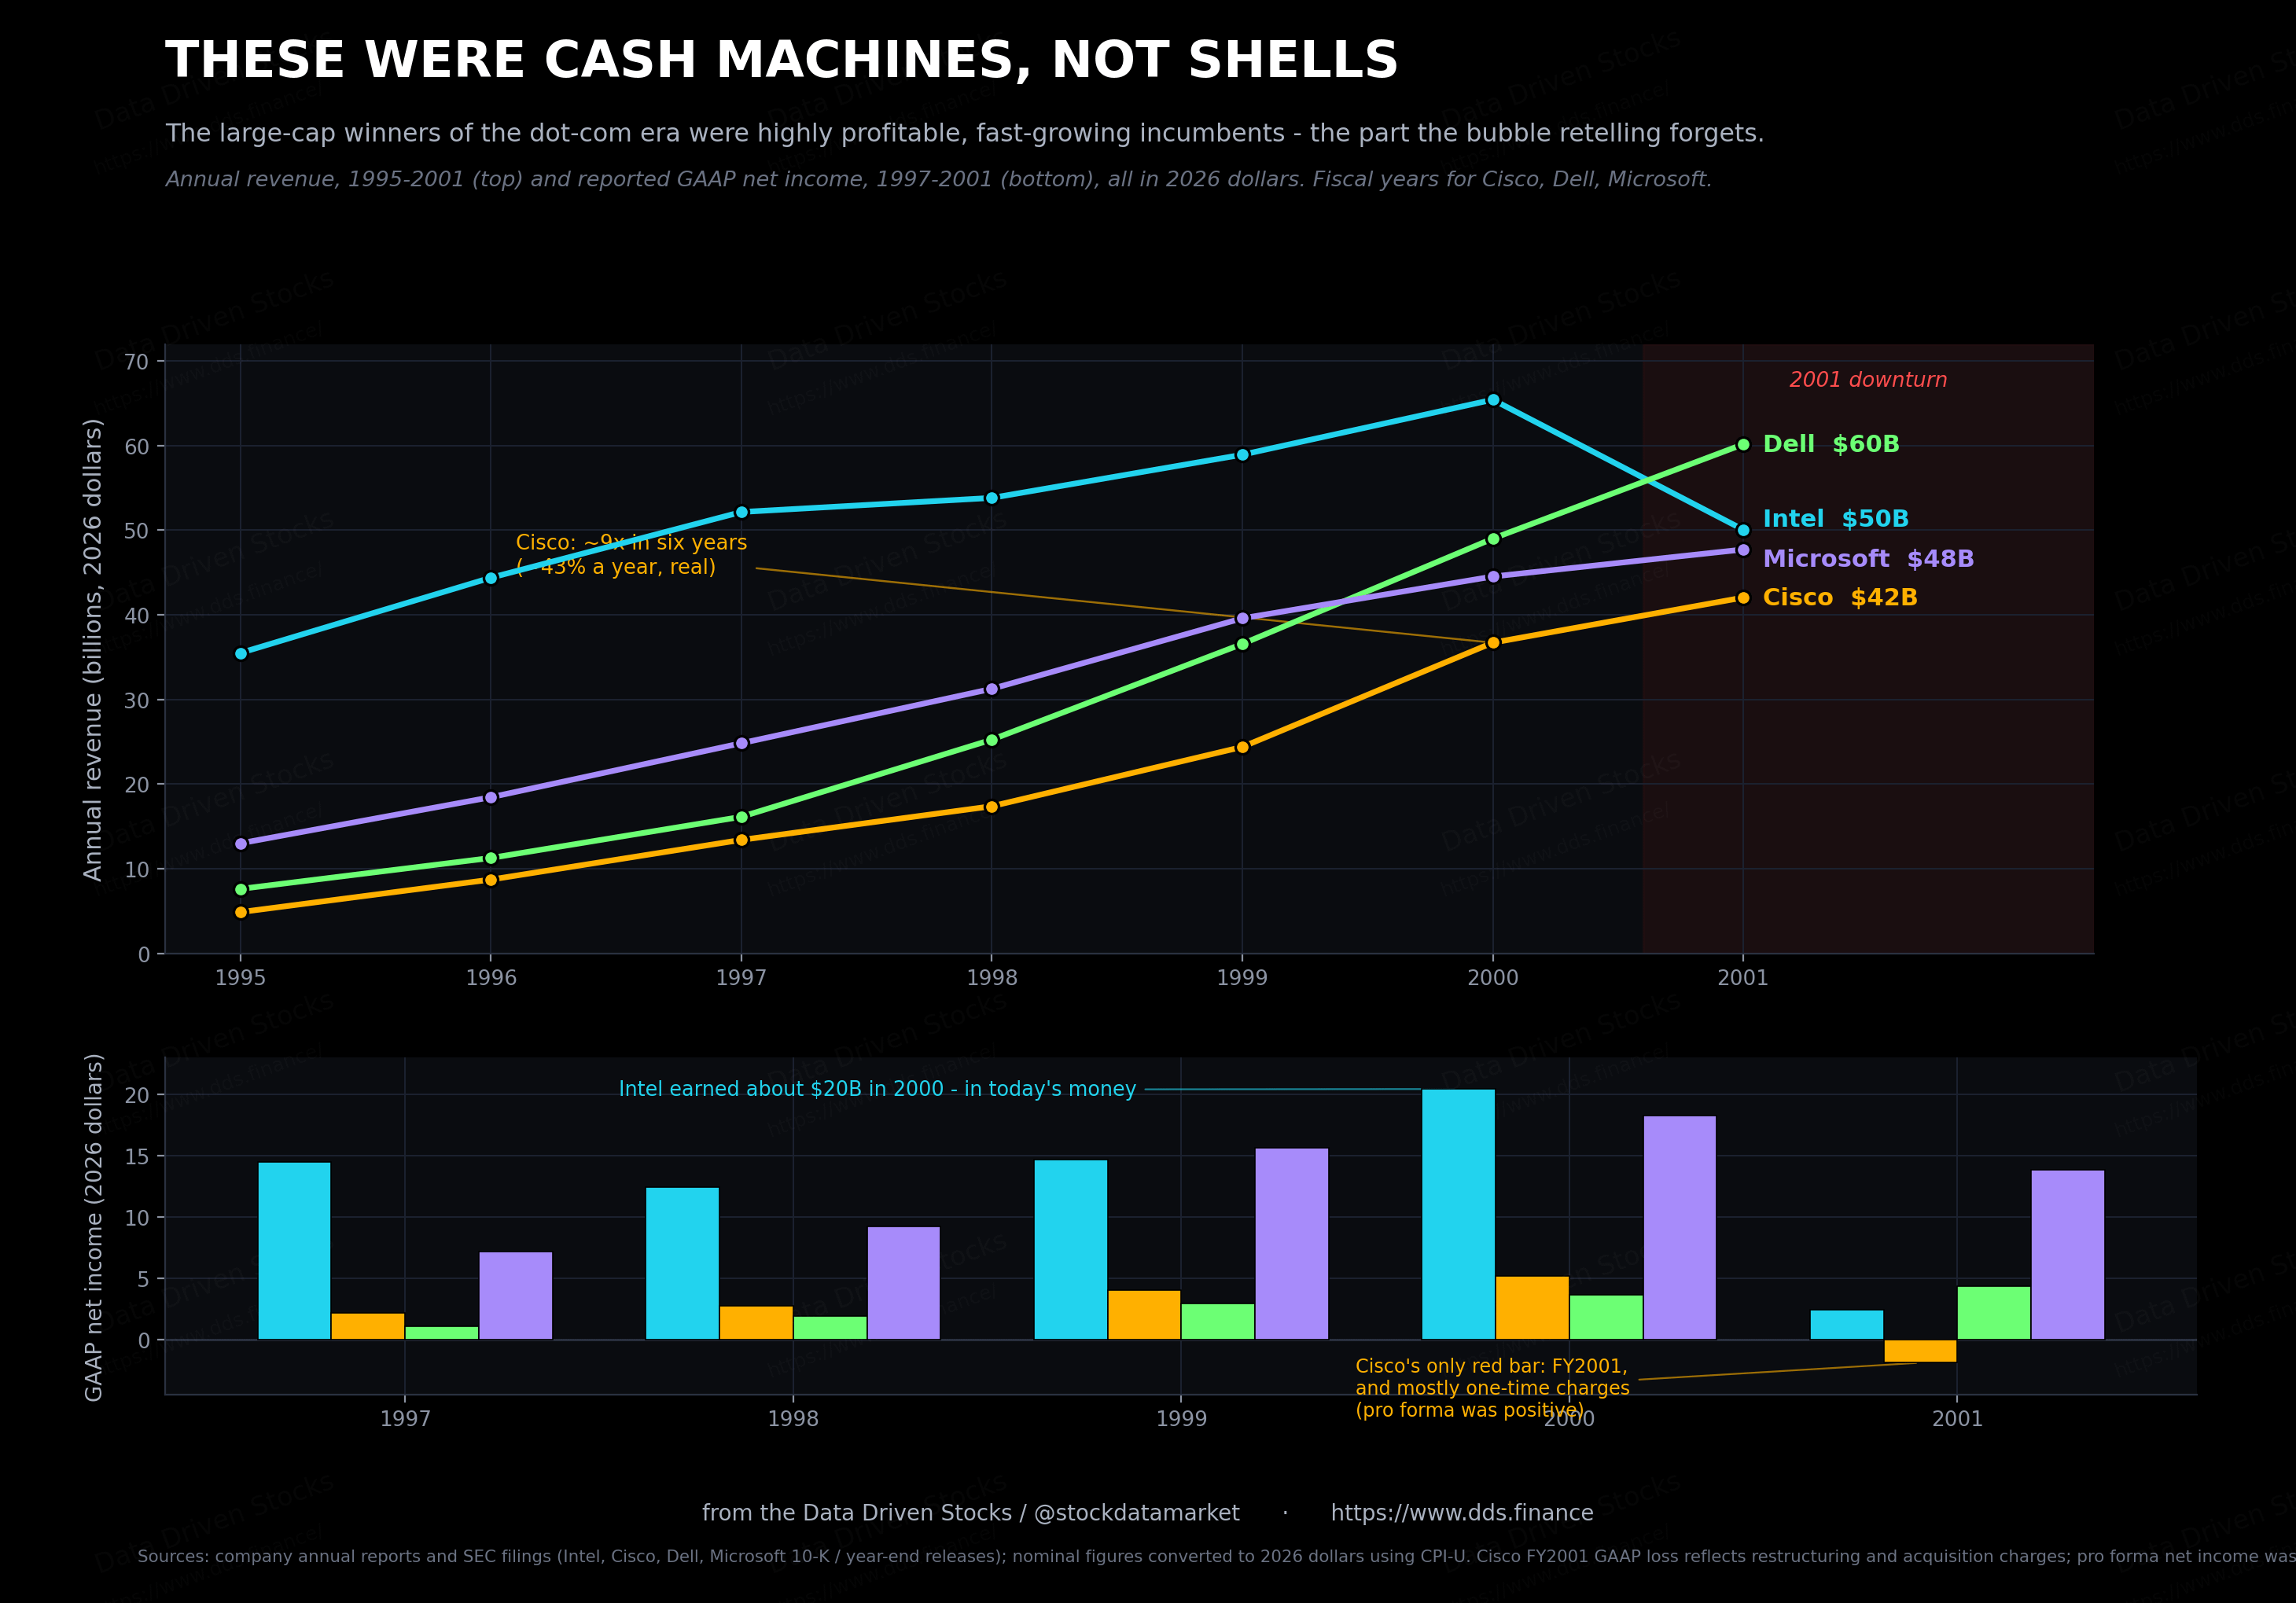
The people running these companies were not hedging quietly, either. Intel’s management called 2000 its fourteenth straight year of revenue growth and told shareholders to expect “continued long-term growth.” Even as the cycle turned, Craig Barrett argued that Intel’s heavy spending through the downturn would let it “grow faster than the industry” once the recovery arrived, in the same breath as calling 2001 “a terrible year for our industry.” John Chambers told Cisco’s analysts in December 2000, “I have never been more optimistic,” and held guidance steady while the floor moved under him. Read those lines today and they land as either visionary or oblivious, depending on where you stop the tape. At the time they just sounded like confidence with the numbers to back it.
The uncomfortable part, for anyone who assumes profits are protection, is that all of it was true and the stocks still fell apart. The growth was real. It was also cyclical, and when it turned, it turned fast.
The number everyone gets wrong
This is where the standard dot-com warning breaks down. The statistic people cite as proof of the mania, the triple-digit price-to-earnings ratio, turns out for its most famous example to be an artifact of the crash itself rather than the bubble.
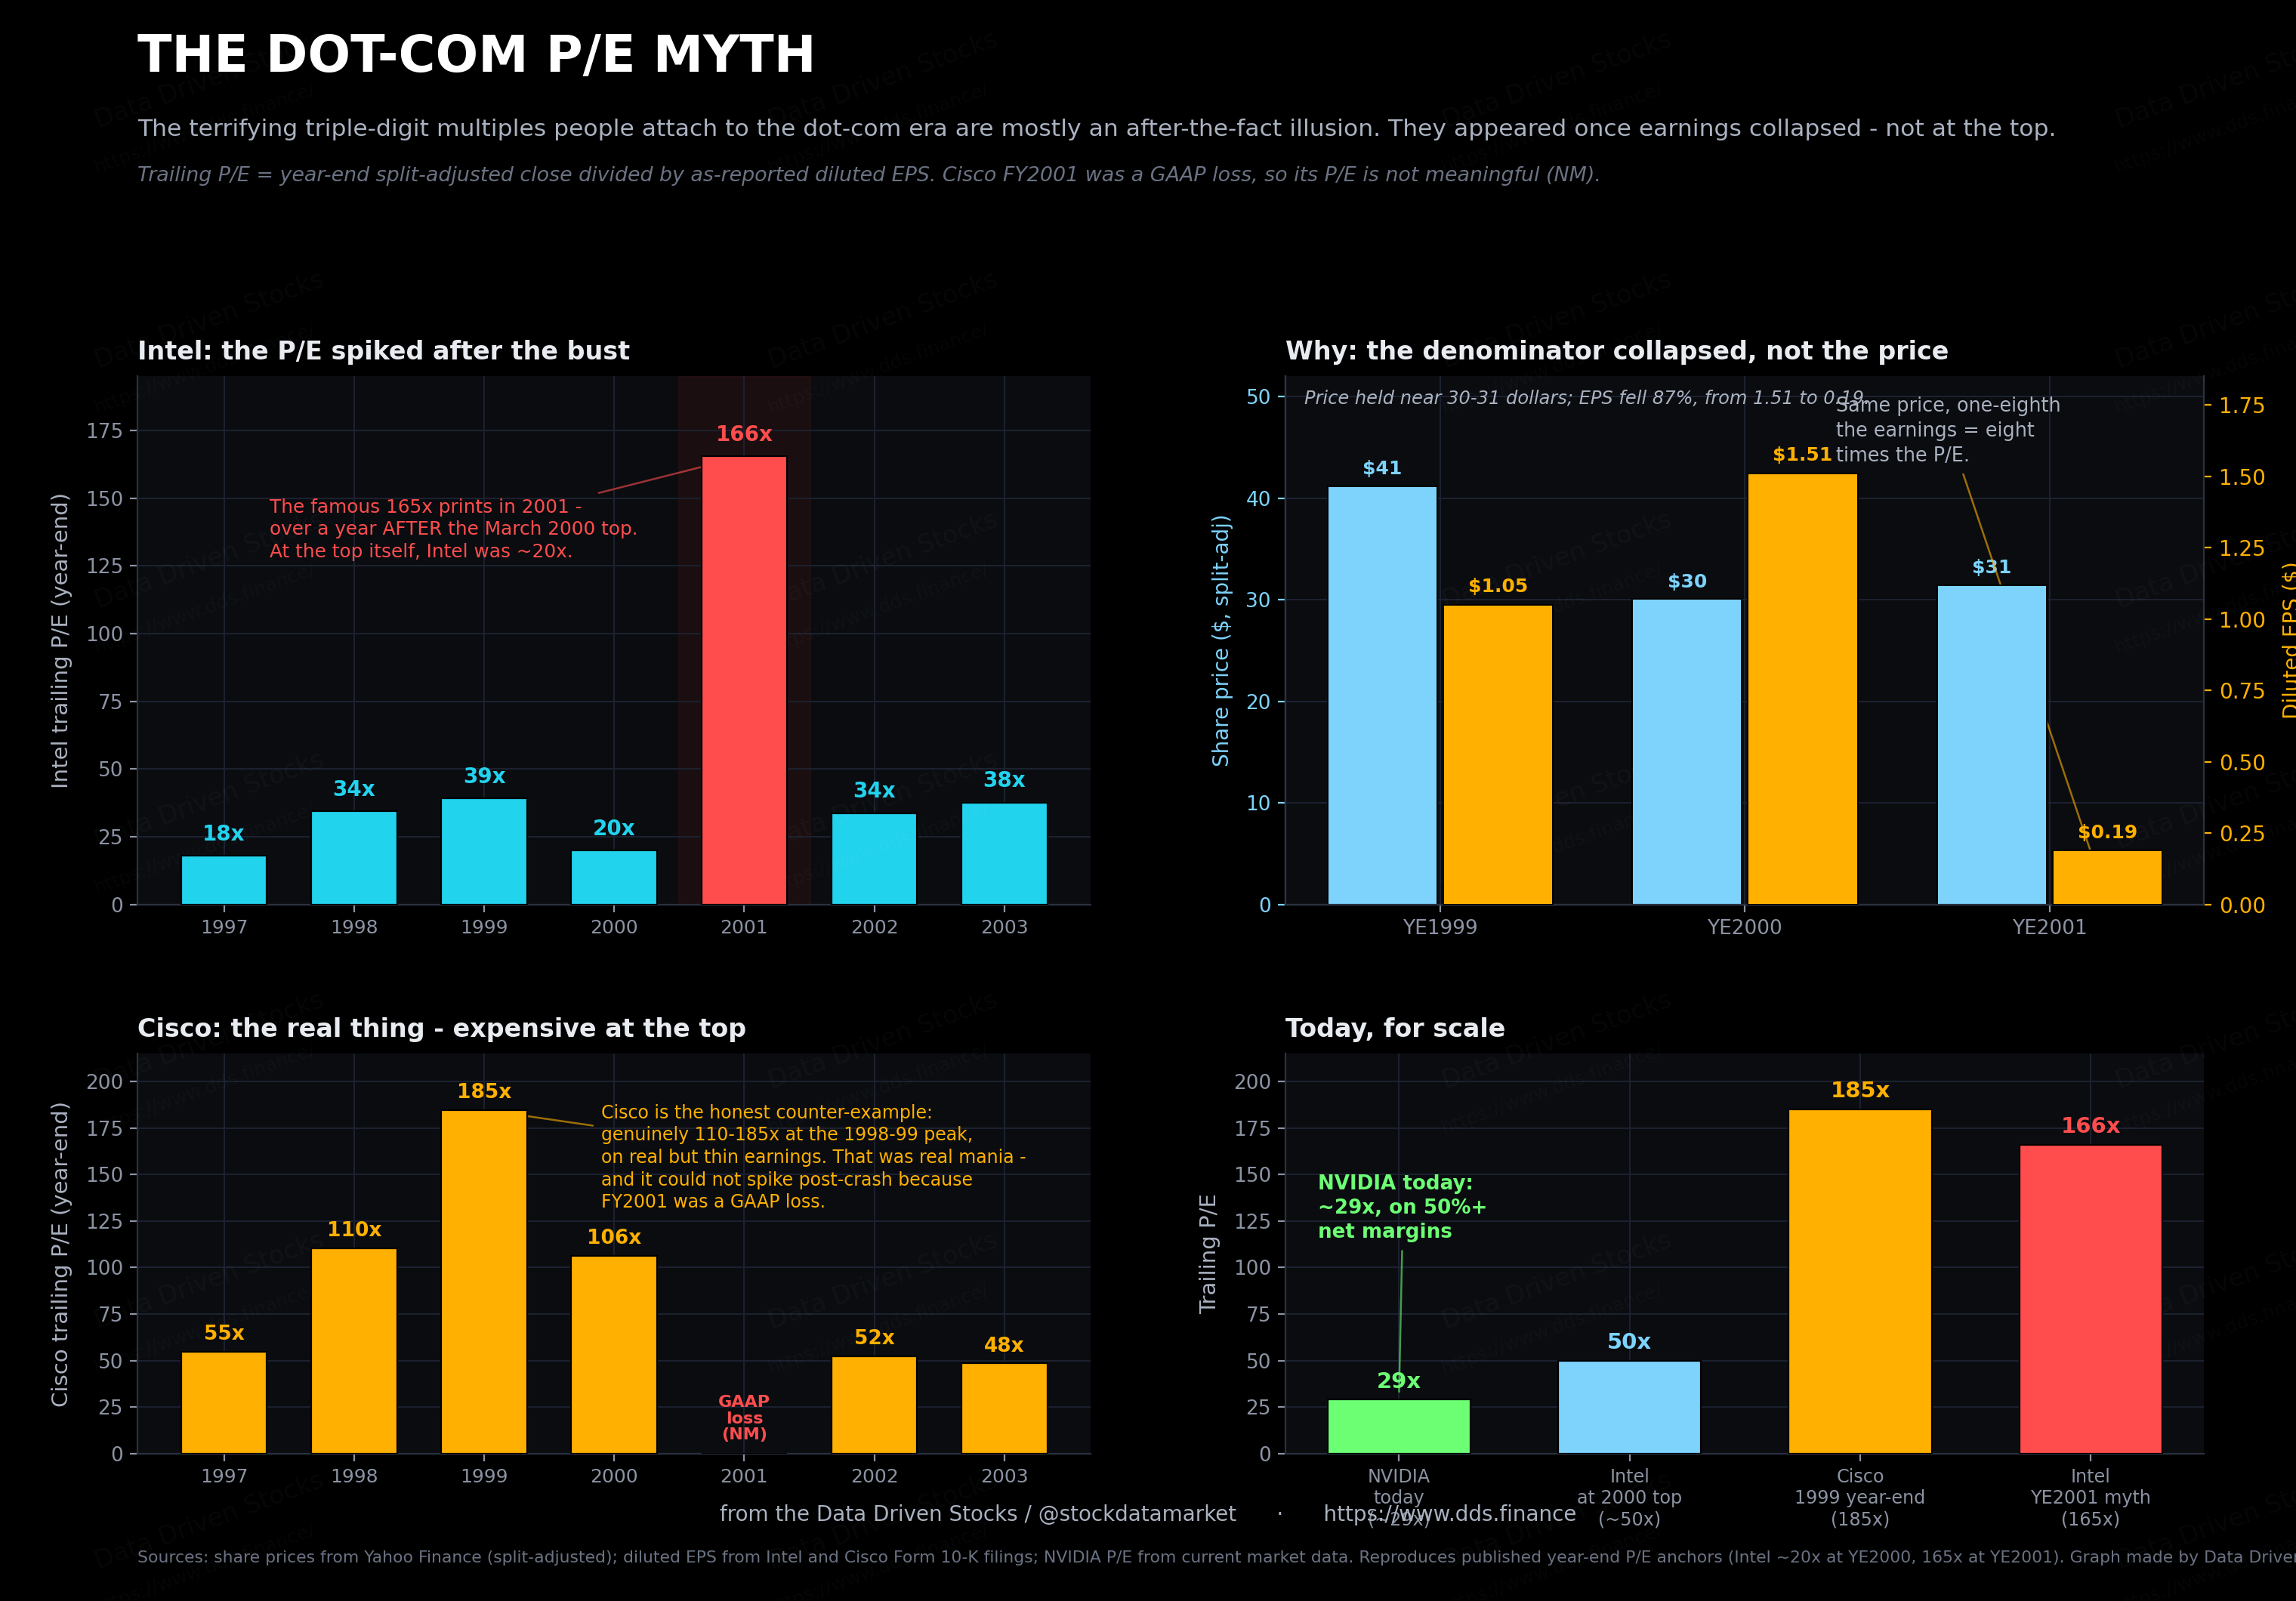
Take Intel. The multiple everyone quotes is its year-end 2001 P/E of about 165, and that number is real. But notice when it shows up. The market topped in March 2000. At the end of 2000, with the index already sliding, Intel traded at roughly 20 times earnings. A year later the share price was almost unchanged, about 30 dollars and then about 31, yet the P/E had swollen to 165. The price had barely moved. What moved was the bottom of the fraction: Intel’s earnings per share fell from 1.51 dollars to 0.19 as the downturn hollowed out its margins. The price stayed put while the earnings dropped to an eighth of what they were, so the multiple multiplied by roughly eight.
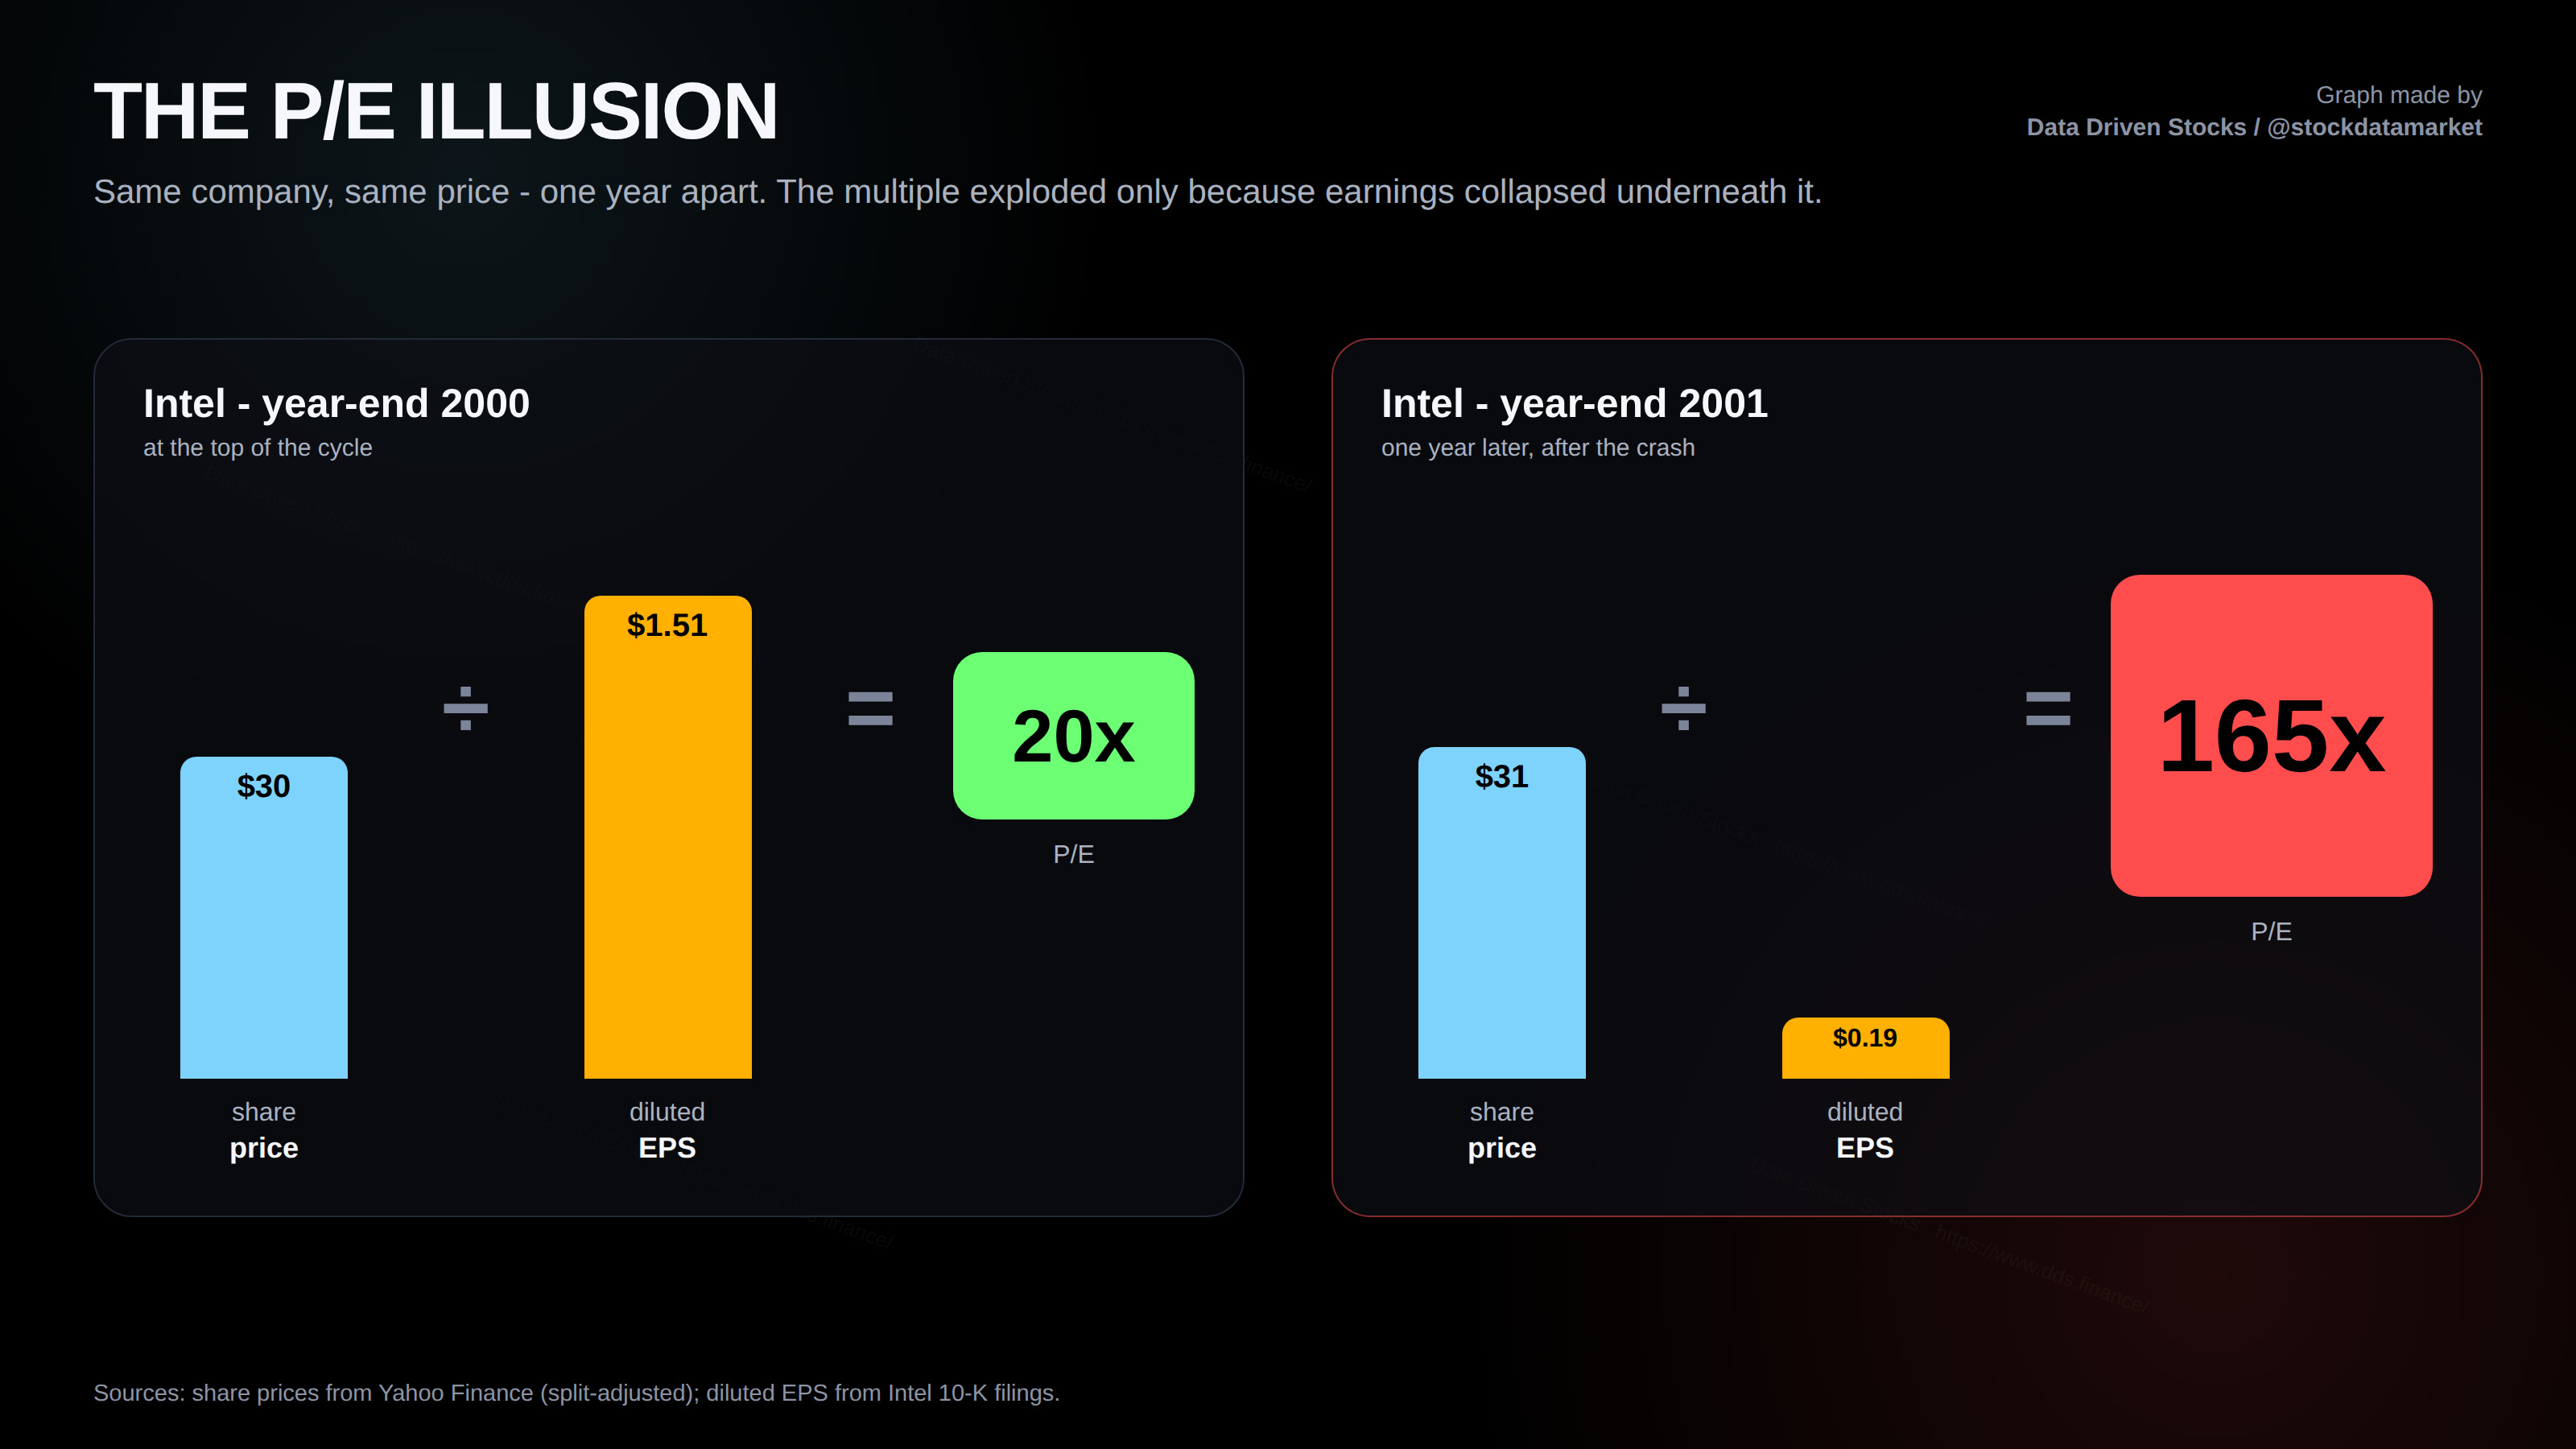
This matters because the 165x figure gets wheeled out to prove that dot-com investors were paying insane prices at the top. They were paying high prices. But even at Intel’s actual share-price high in August 2000, the multiple was around 50 times earnings, nowhere near 165. The grotesque number only turned up eighteen months later, after profits had caved in. A price-to-earnings ratio is a fraction, and when the bottom of a fraction drops out, the whole thing blows up no matter what the price is doing.
None of this means the dot-com market was cheap. It means you have to be straight about which companies were genuinely expensive, and Cisco is the one that earns it. At its year-end 1999 high Cisco traded around 185 times earnings, and at the March 2000 top its P/E hit an astonishing 201. That was the real thing, a thin but real earnings base priced as if growth would never slow. And unlike Intel, Cisco’s multiple could not balloon after the crash, because its fiscal 2001 result was an outright GAAP loss, which makes the ratio meaningless rather than enormous.
So when someone waves a chart of dot-com P/E ratios at you to explain why today is dangerous, ask which year the number is from. If it comes from 2001 or 2002, it is describing the wreckage, not the bubble. The more useful lesson from the dot-com top is quieter. The danger was never that great companies had no profits. It was that prices had pulled away from how fast those profits could realistically keep growing, and that the growth was far more cyclical than anyone wanted to admit.
Now do today
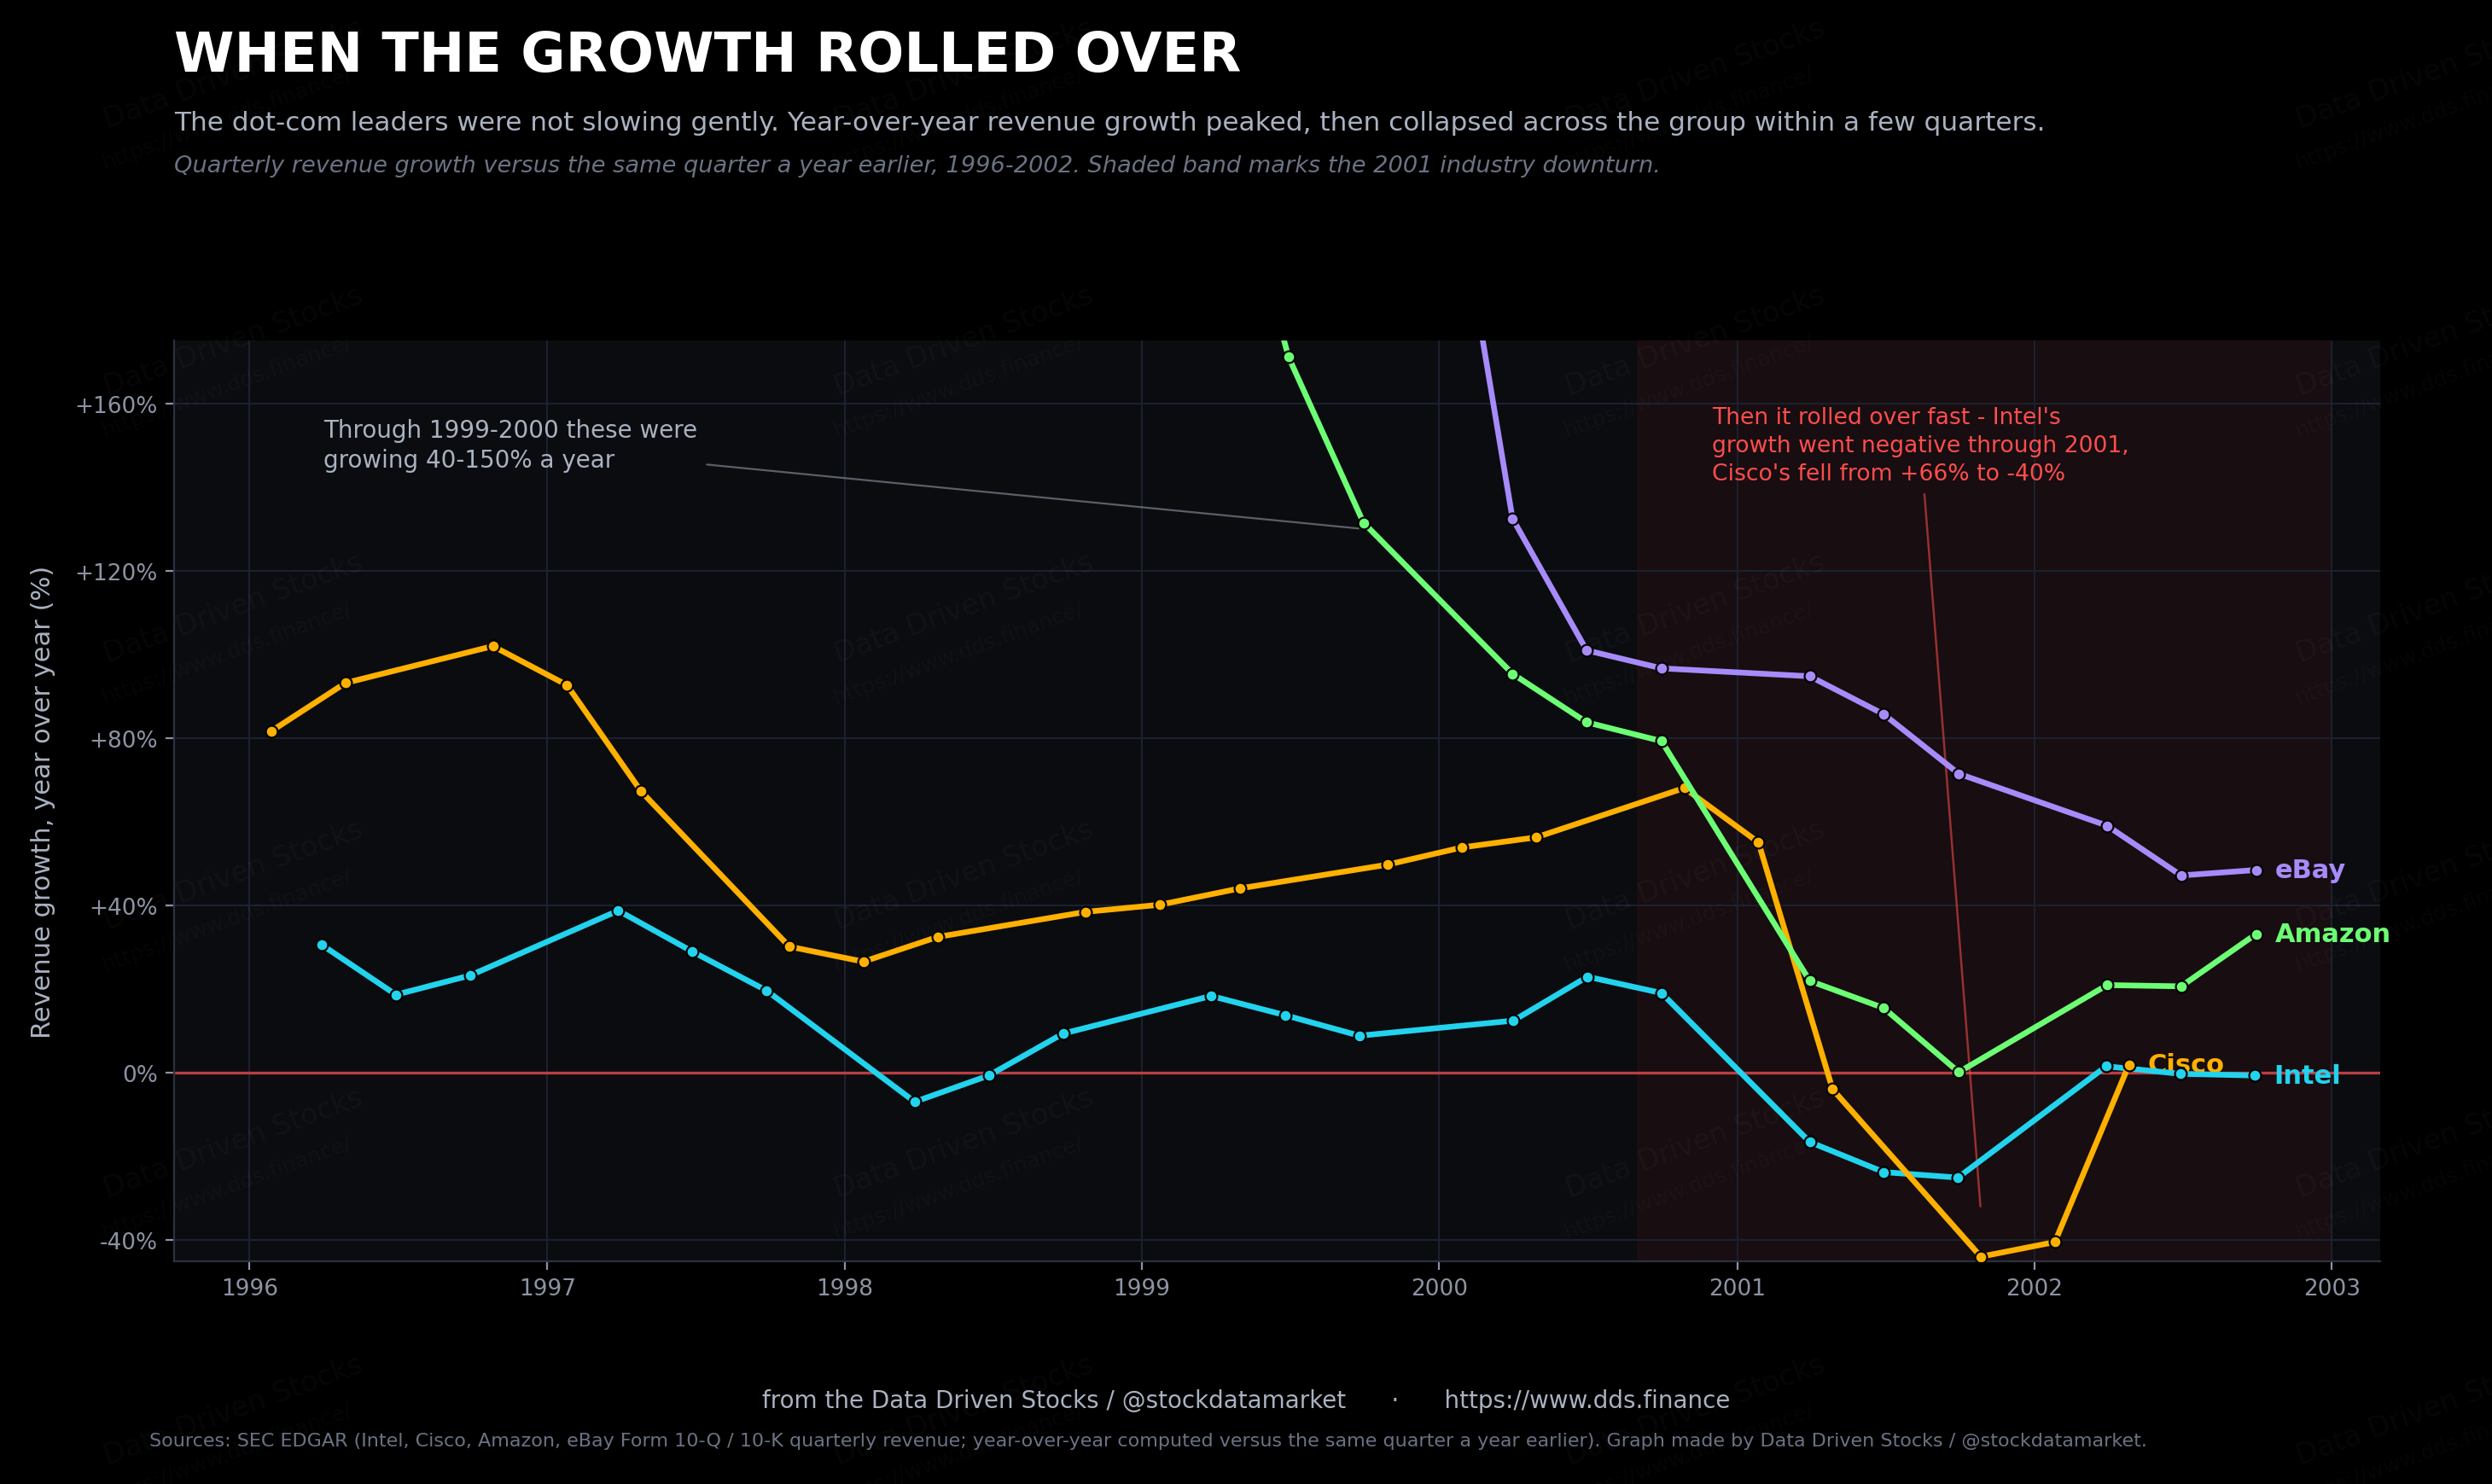
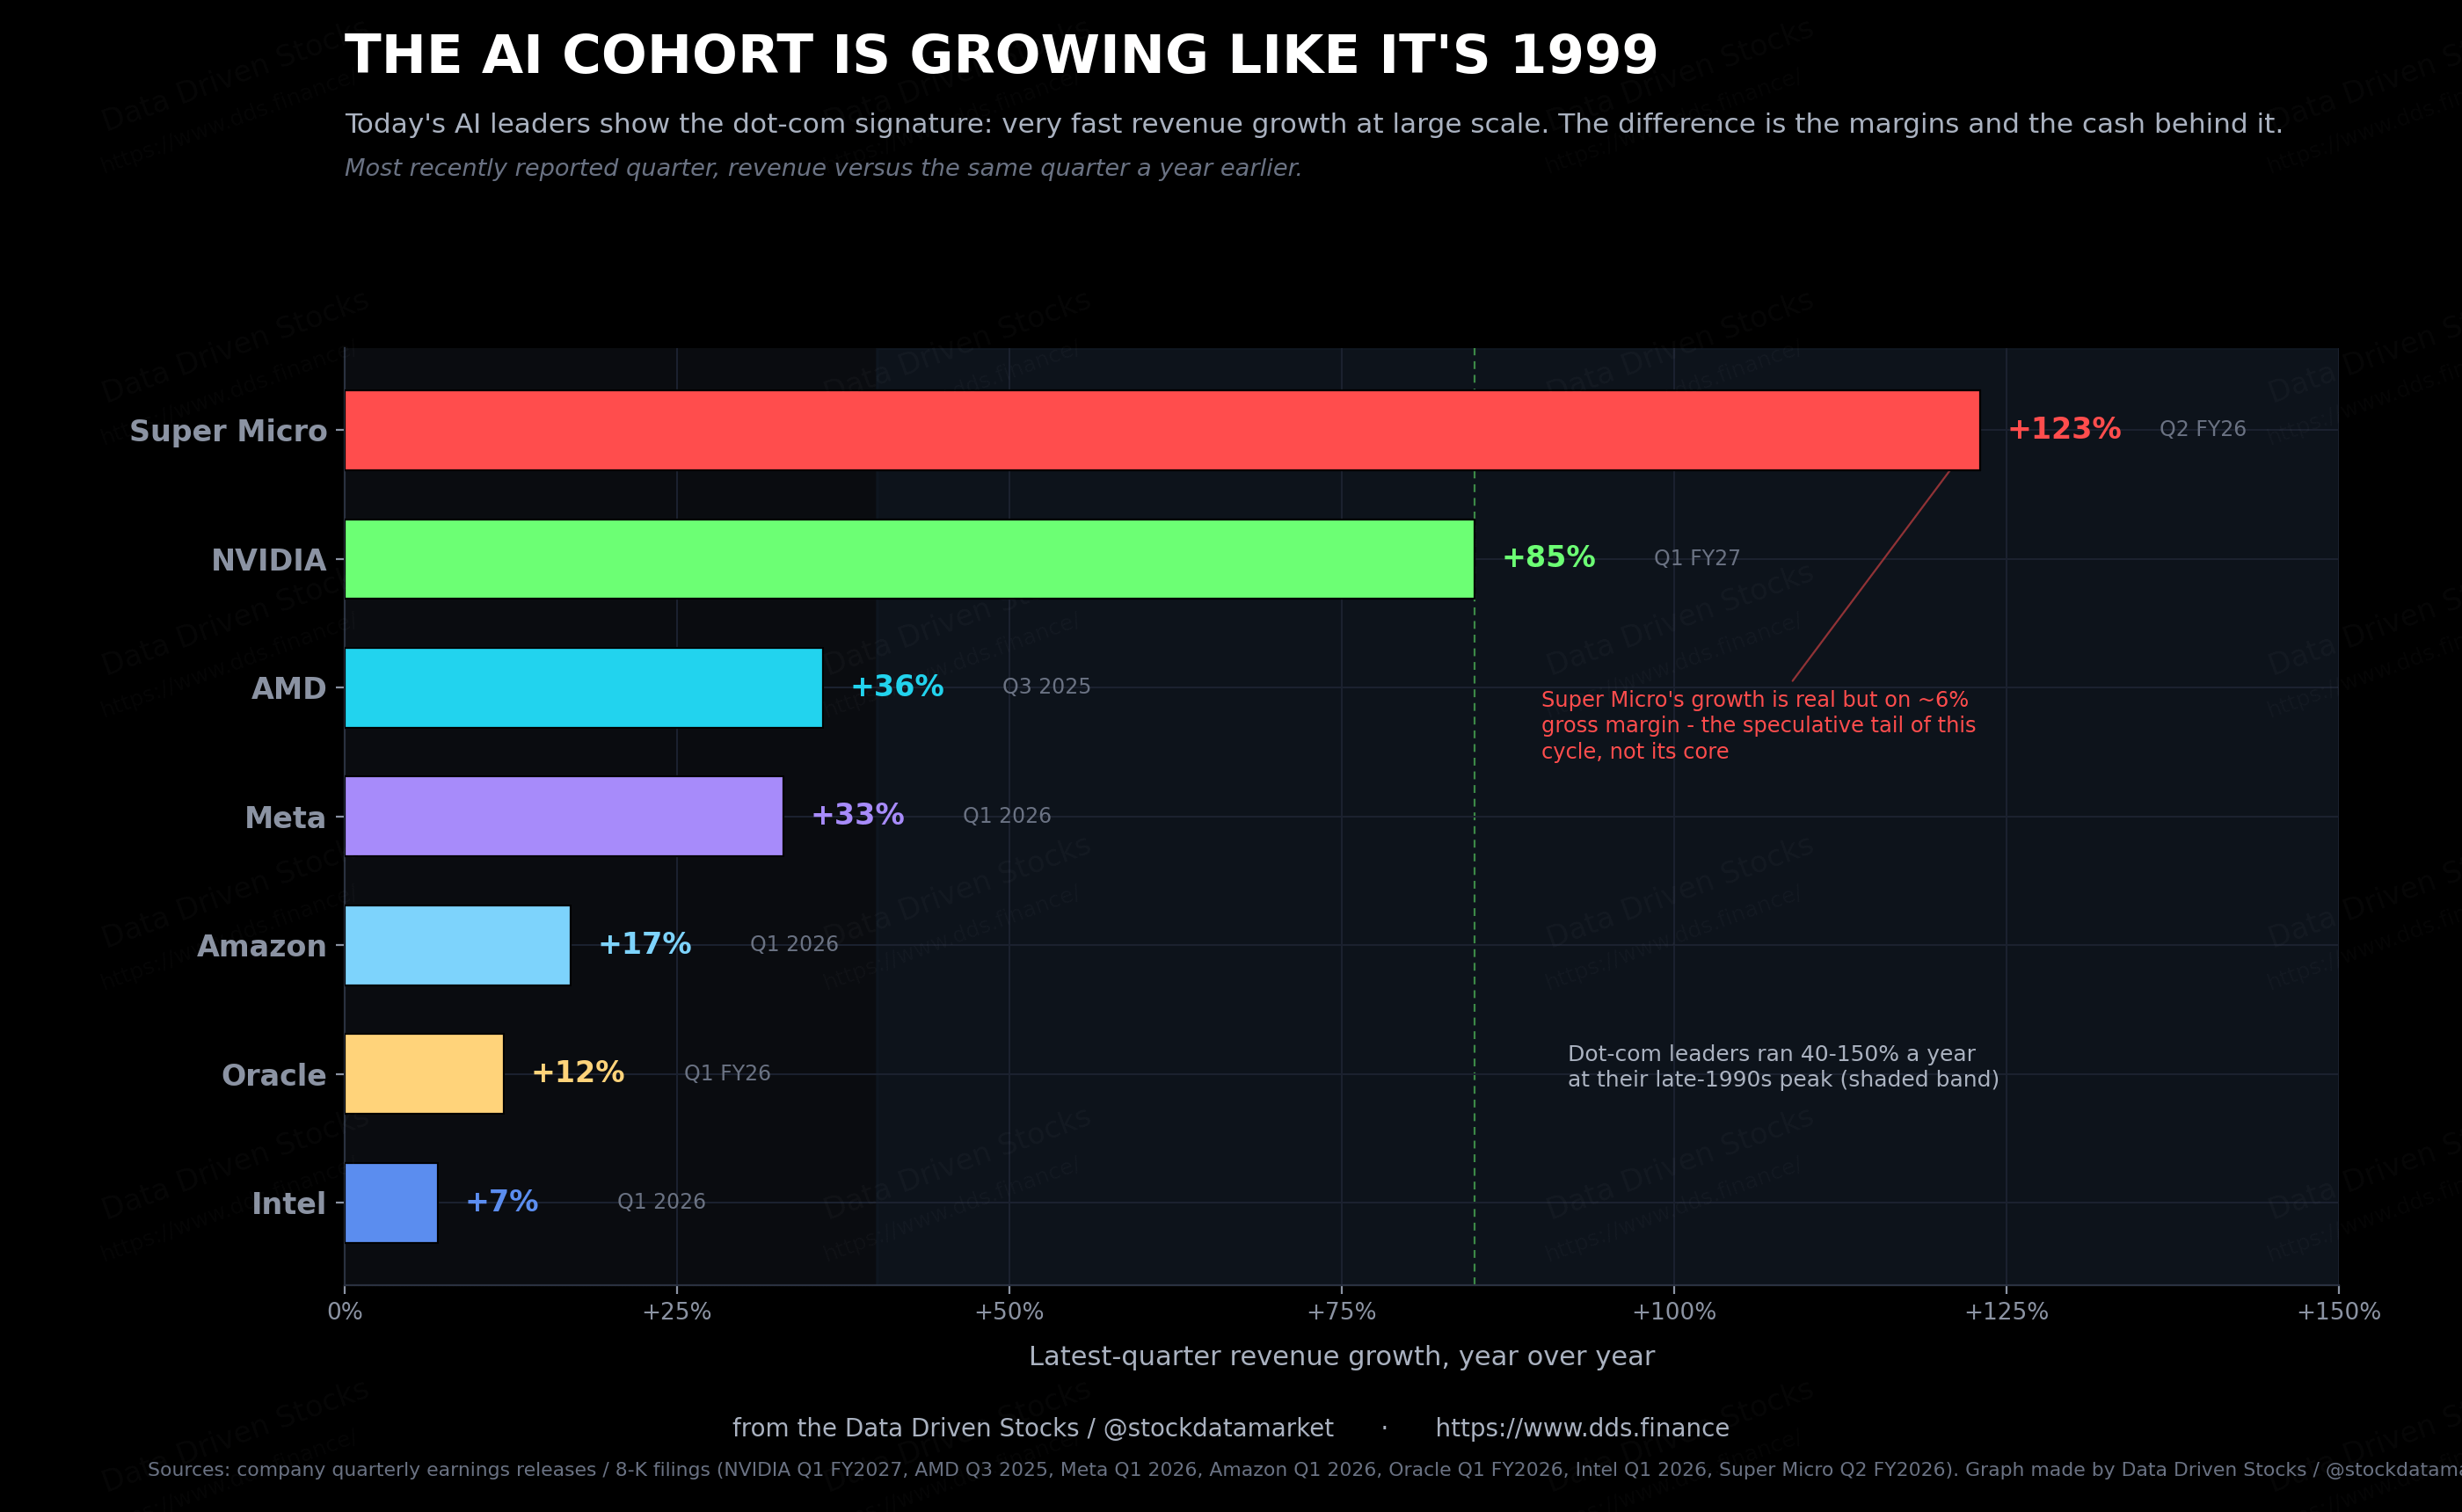
With that cleared up, the AI era gets easier to read, because you know what to look for. The first thing you find is the same fingerprint as the 1990s: very fast revenue growth at genuinely large scale.
NVIDIA grew revenue about 65 percent in its last fiscal year, to roughly 216 billion dollars, and in its most recent quarter it booked 81.6 billion in sales, up 85 percent on the year, with data-center revenue alone up more than 90 percent. AMD’s data-center business grew 57 percent last quarter. Meta grew 33 percent, Amazon 17, Oracle 12, even a turnaround-stage Intel 7. Out at the speculative end, Super Micro grew 123 percent. Blur your eyes and it looks a lot like the 1999 growth chart.
The executives sound familiar too, which is either reassuring or alarming depending on your mood. Jensen Huang calls the data-center build-out “the largest infrastructure expansion in human history” and says “agentic AI has arrived”; at his March 2026 developer conference he told the room he could see “at least 1 trillion” dollars of build-out through 2027, and that even that would leave NVIDIA “short.” Lisa Su calls AI demand “insatiable” and says we are in “the early stages of an industry-wide AI transformation.” Charles Liang of Super Micro called a 40-billion-dollar revenue target “relatively conservative.” Oracle’s Safra Catz called a single quarter “astonishing,” and Larry Ellison told investors one of Oracle’s cloud database lines grew 1,529 percent. Swap the names on the door and half of these could have come straight off a 2000 earnings call.
That is the part that should keep you honest. The narrative confidence, the round-trillion forecasts, the insistence that demand is structural and not cyclical - that is the exact texture of the late 1990s. If the AI story is going to break, this is what it will have sounded like in the weeks before.
What is actually different: the cash
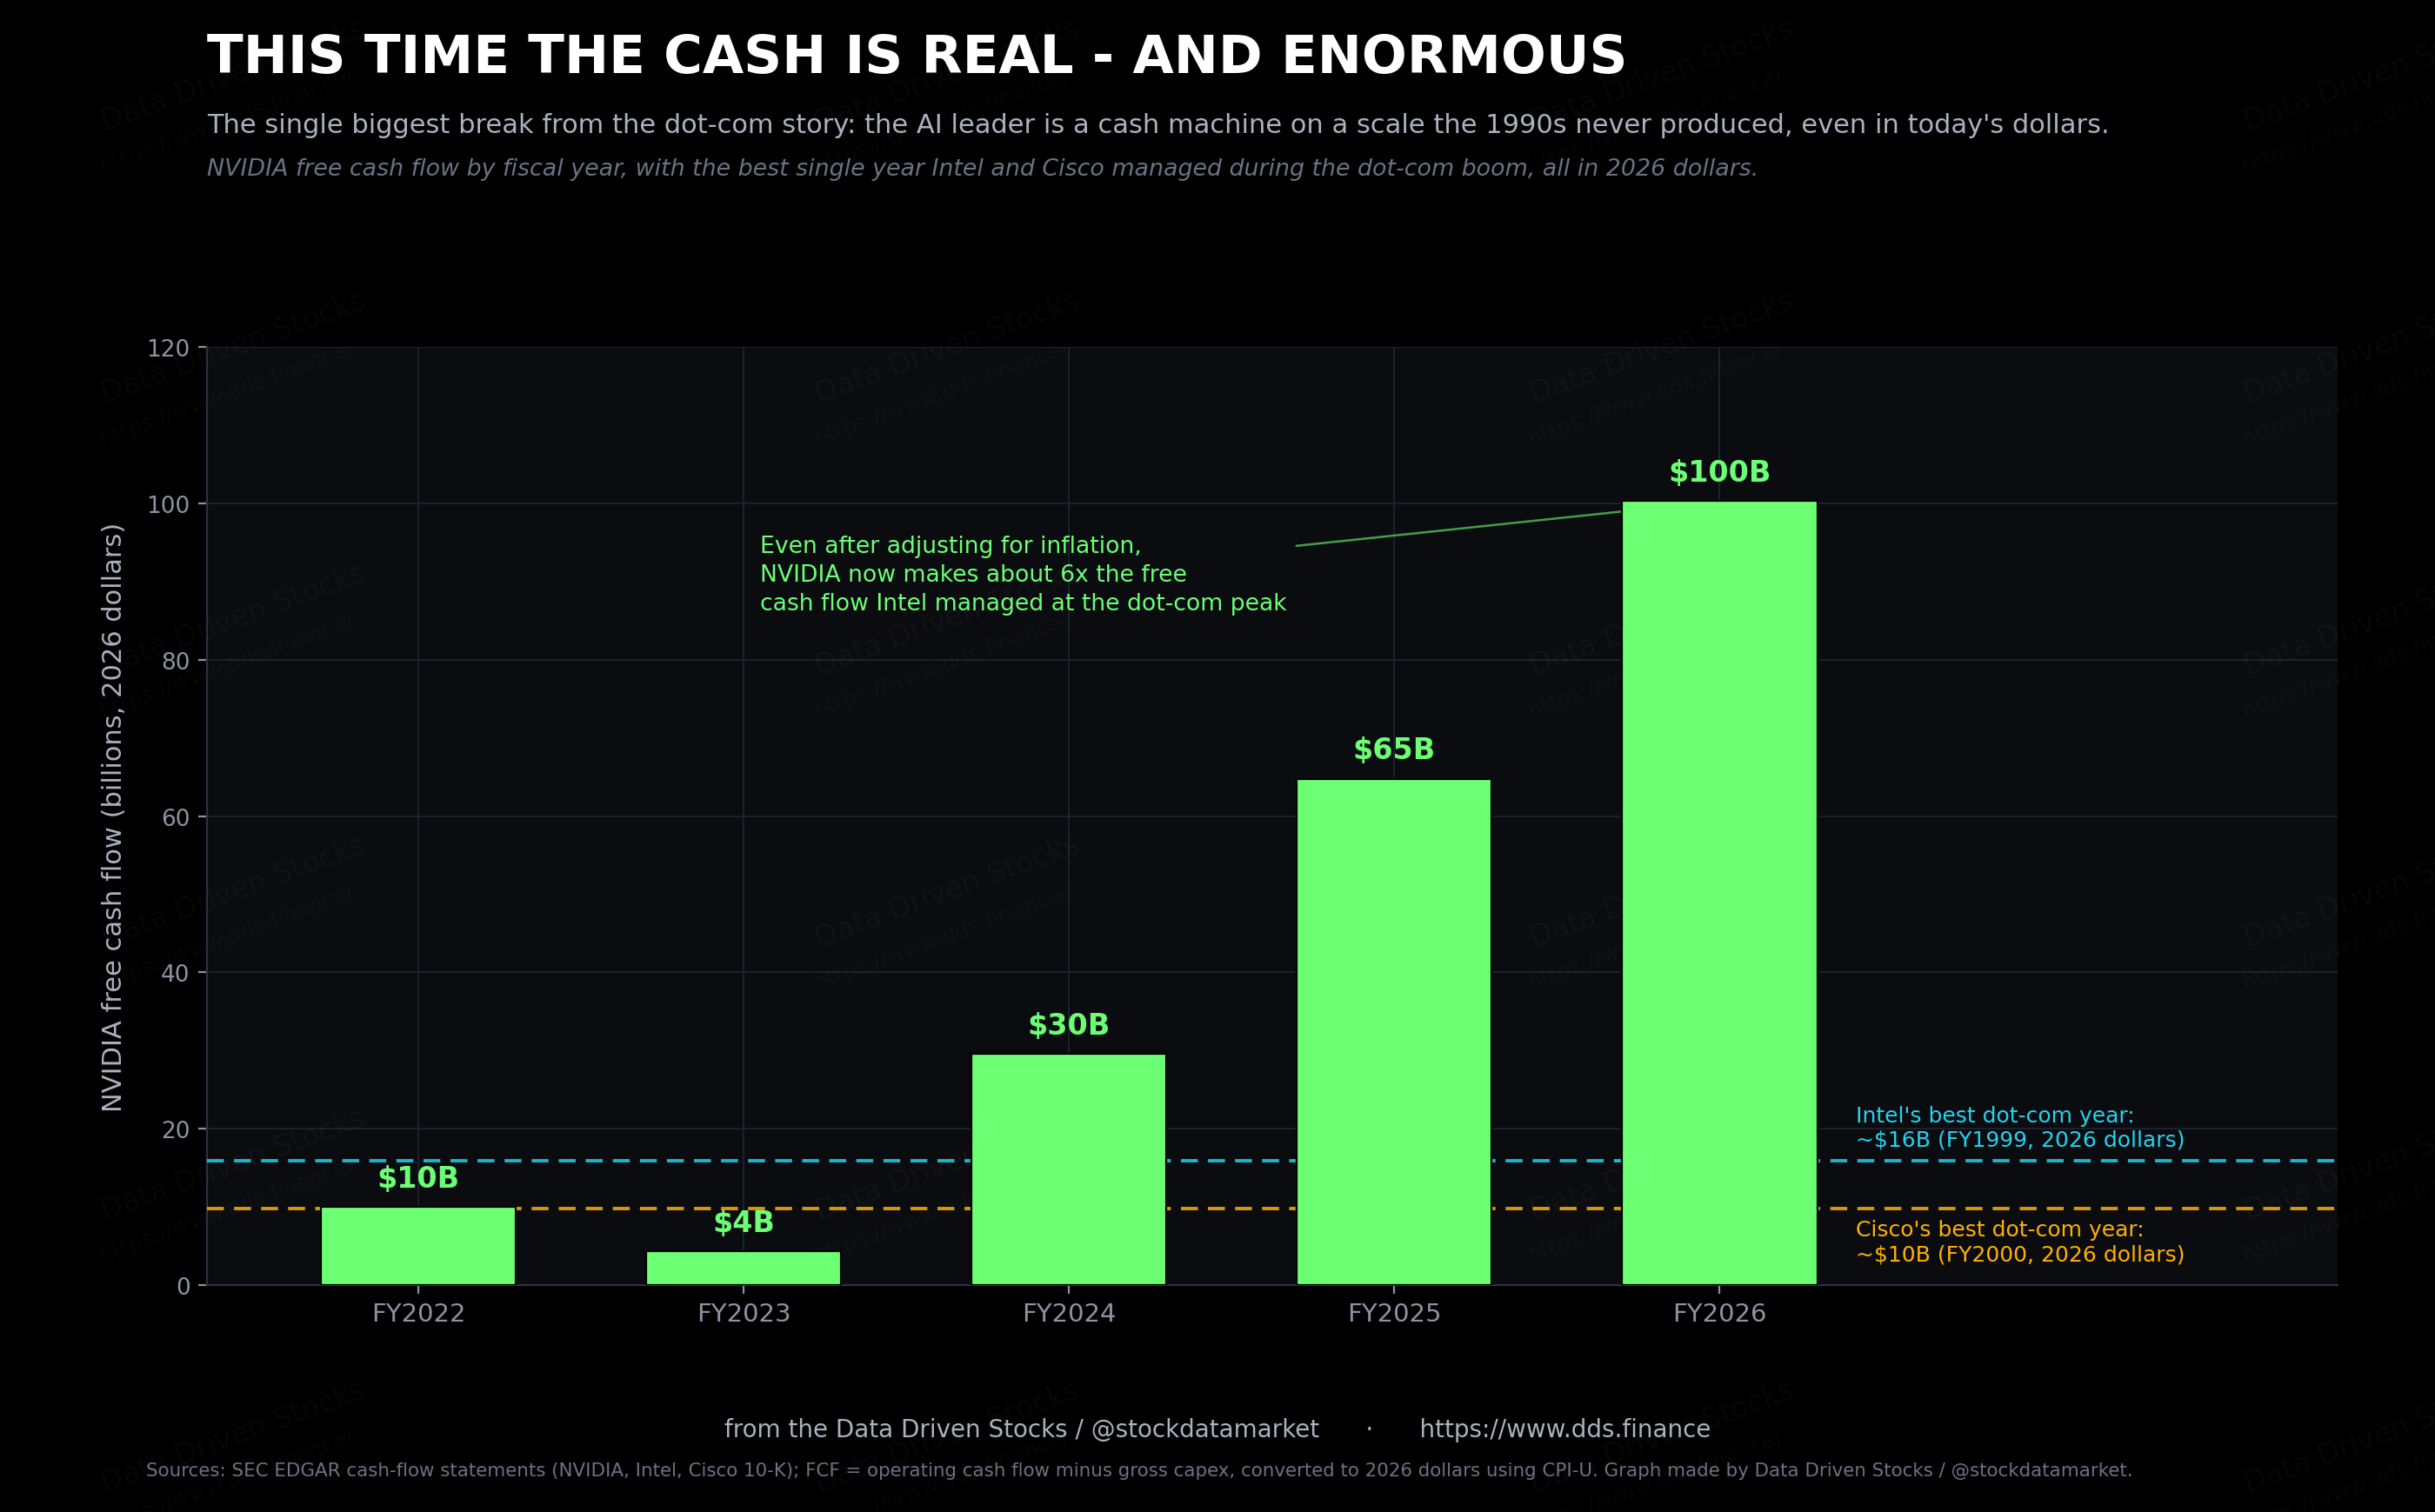
But texture is not substance, and on substance there is one enormous break from the dot-com pattern. The company at the center of the AI build-out is doing more than growing fast. It is generating cash at a scale the 1990s never came close to.
The best free cash flow Intel ever put up in the dot-com boom was about 7.9 billion dollars, in fiscal 1999, which is close to 16 billion in today’s money. Cisco’s best was about 5.1 billion in fiscal 2000, or roughly 10 billion once you adjust for inflation. At the time, those were the gold standard. NVIDIA generated roughly 97 billion dollars of free cash flow in its most recent fiscal year, around 100 billion in 2026 dollars, in a single year, and that is still about six times Intel’s inflation-adjusted peak. The raw comparison looks like twelve times, but half of that gap is just twenty-five years of inflation. Strip the inflation out and nothing the 1990s produced gets within reach. If there is one number that separates now from then, this is it.
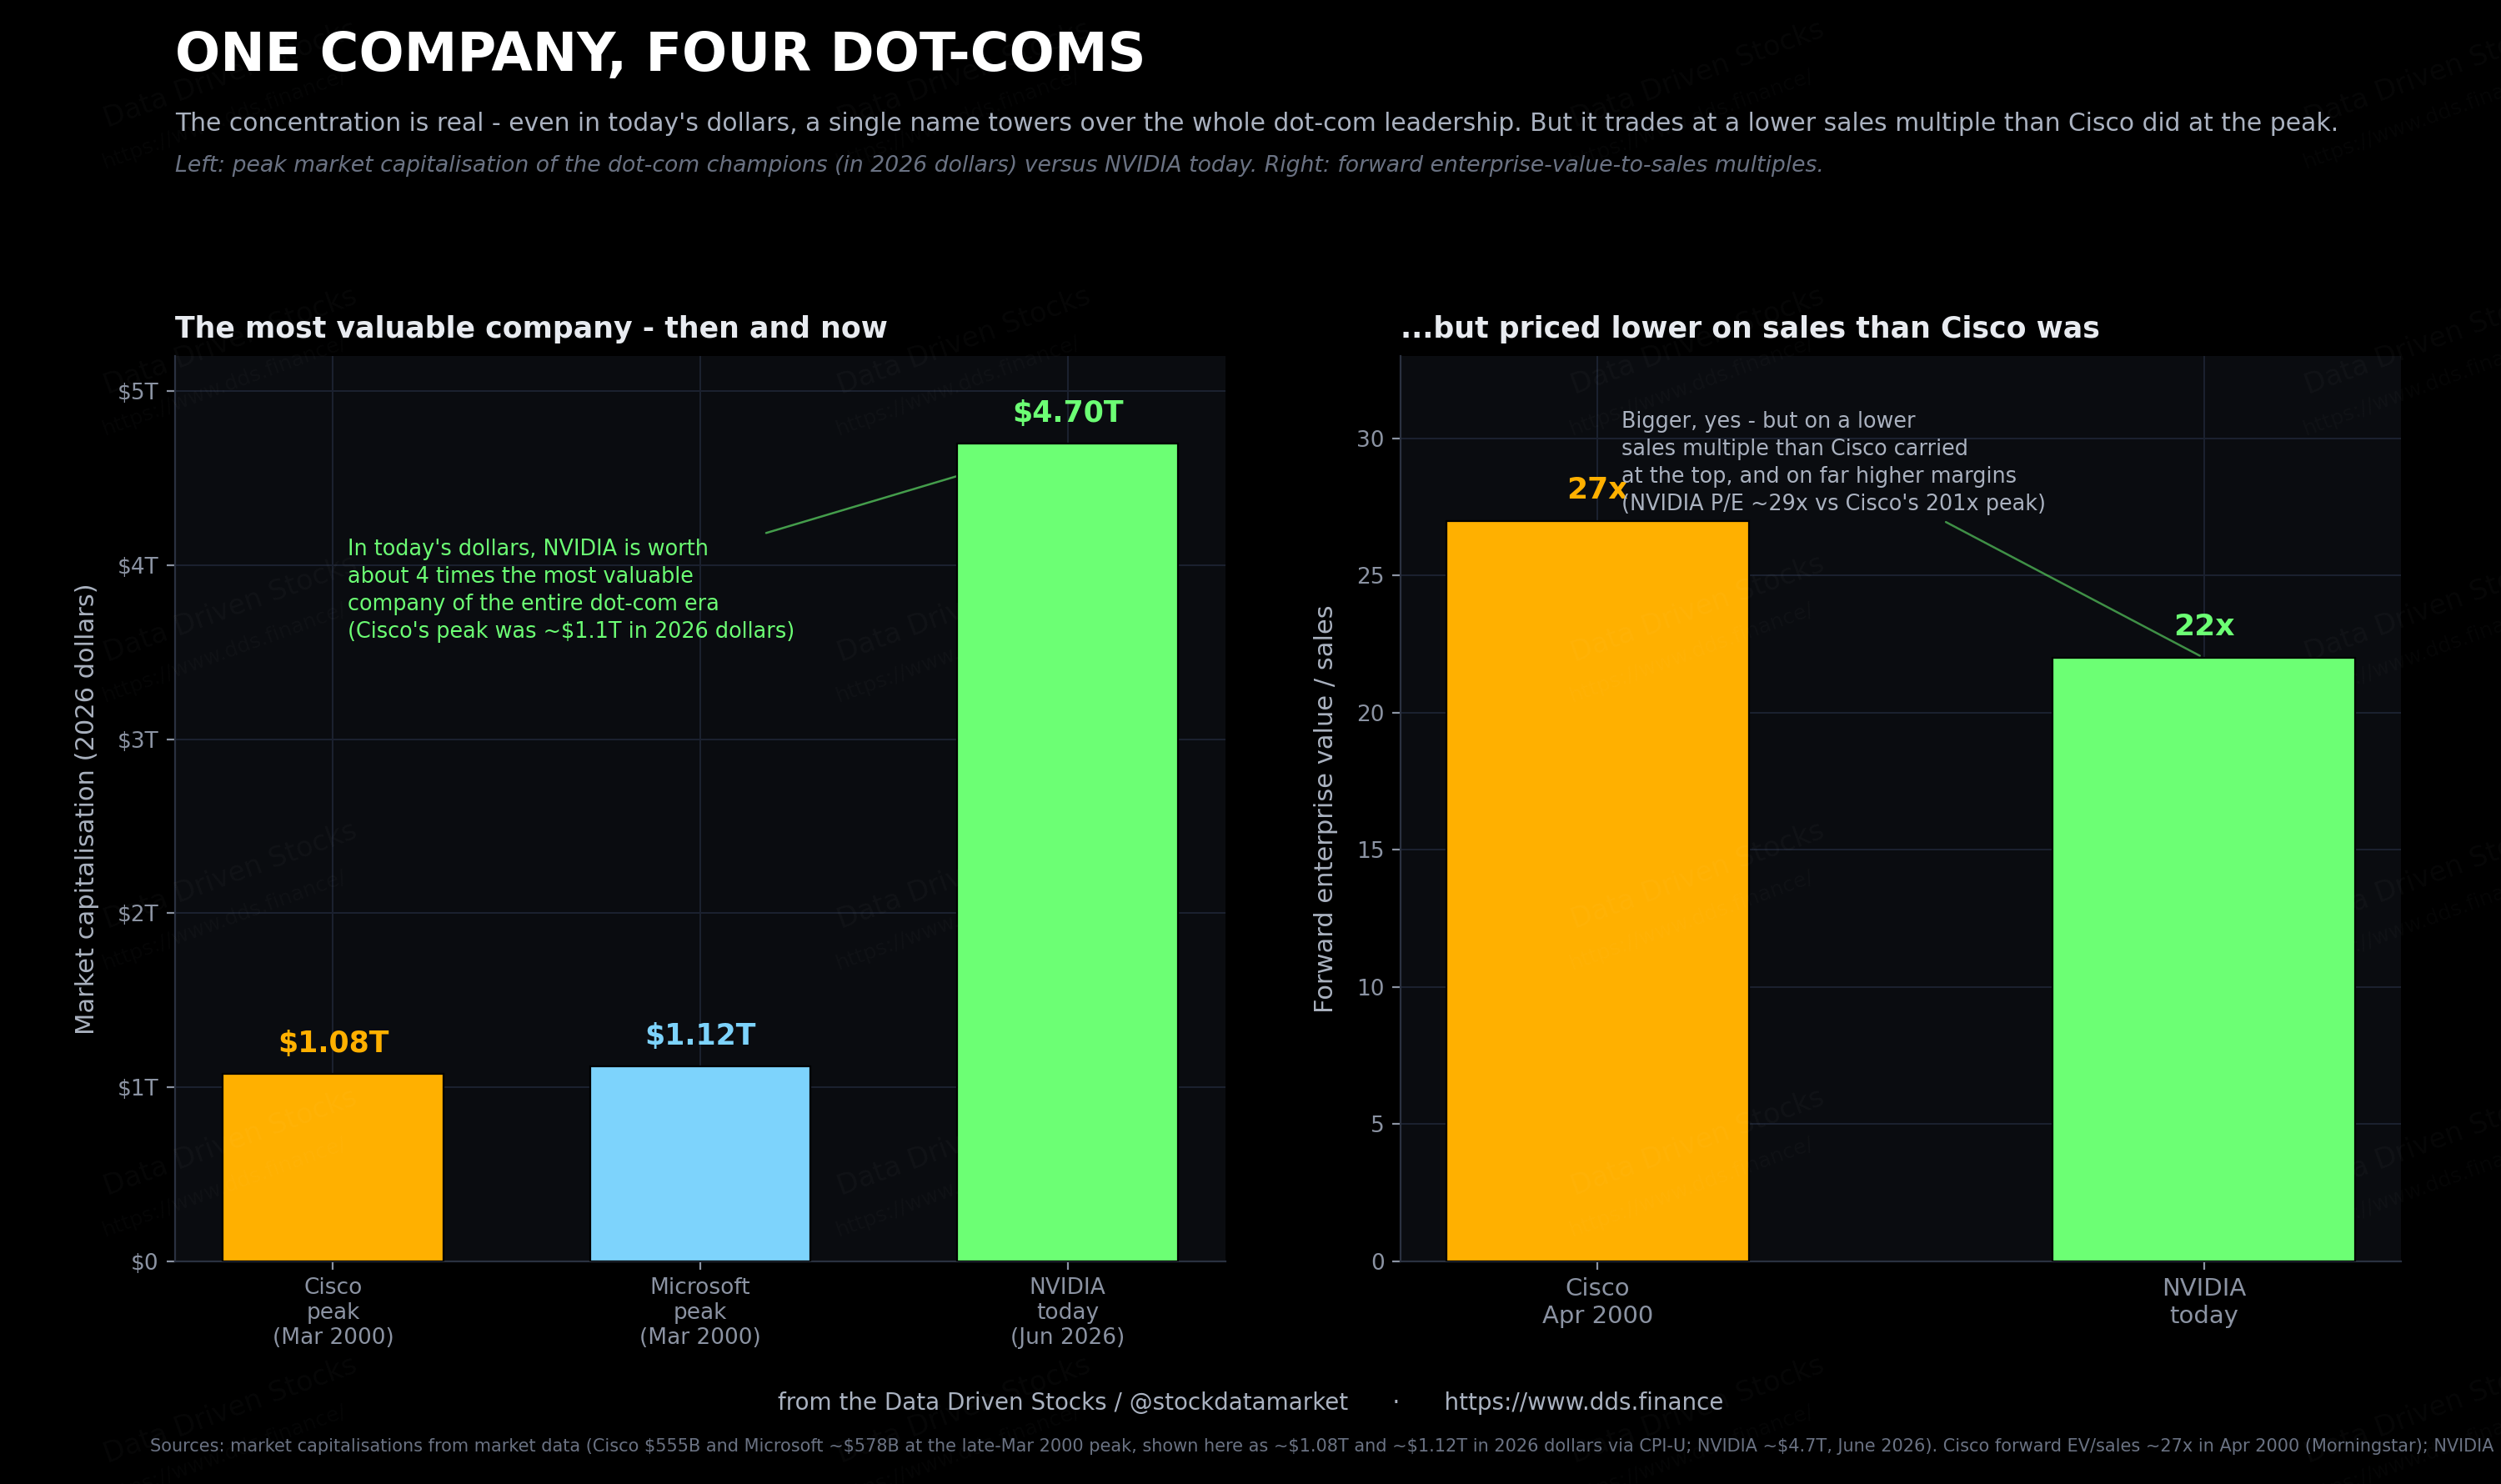
This is also why the valuation comparison doesn’t land where people expect it to. NVIDIA is worth around 4.7 trillion dollars today. Cisco’s peak was about 555 billion in March 2000, the moment it briefly passed Microsoft to become the most valuable company in the world. In today’s money that peak is worth a little over 1 trillion, which means NVIDIA is something like four times the most valuable company of the entire dot-com era, not the eight times the face numbers suggest. So the concentration is more extreme now than it was then, just by less than the raw figures imply once you adjust for inflation. And yet NVIDIA trades at roughly 29 times earnings, against Cisco’s 201 at the top, and on a forward enterprise-value-to-sales basis it sits near 22 times against the 27 times Cisco reached in April 2000. It is bigger, then, but priced more cheaply on what it actually sells, and on far fatter margins. Morningstar’s Brian Colello made the same point: NVIDIA was already “a much larger and more stable business” before its boom, while Cisco was “a startup growing impressively but off a smaller base.”
The other side of the trade: someone is paying for all this
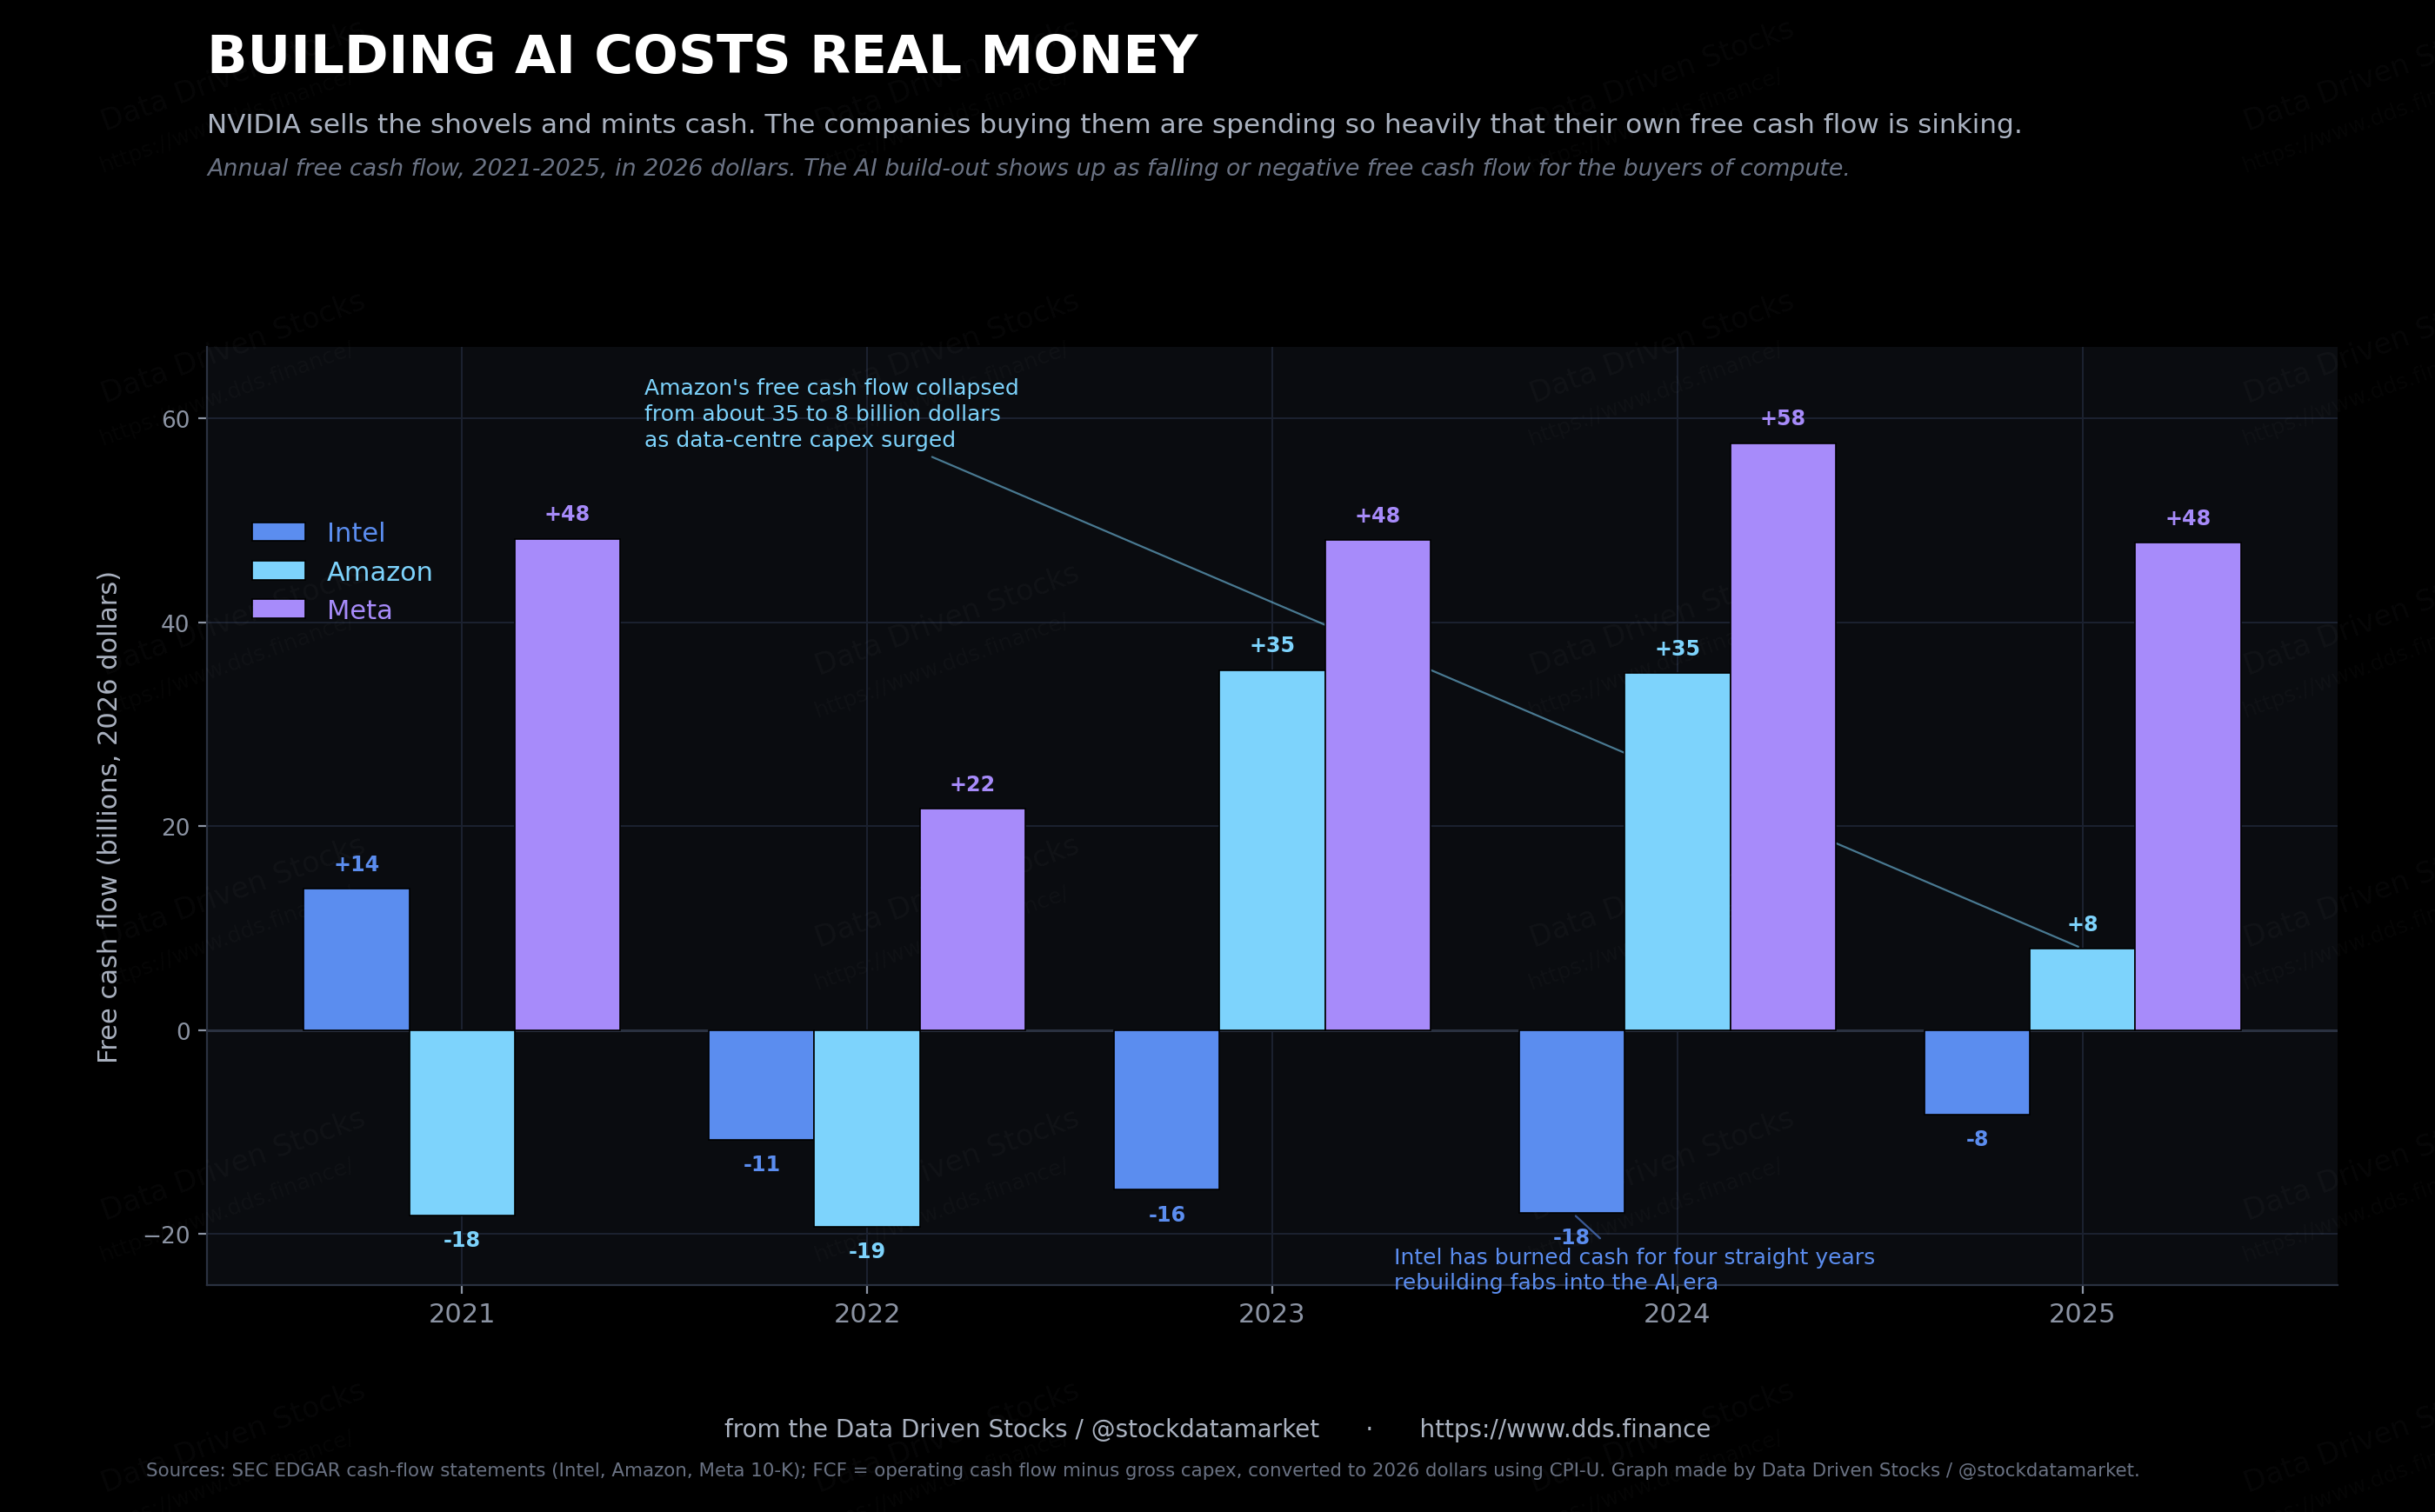
There is a catch buried inside that cash machine, and it is the thing the cheerleaders skip. NVIDIA mints cash because everyone else is burning theirs. The same build-out that shows up as record free cash flow for the company selling the shovels shows up as shrinking or negative free cash flow for the companies buying them.
Intel has burned cash for four years running while it rebuilds its factories for the AI era. Amazon’s free cash flow collapsed from about 35 billion dollars to roughly 8 billion in the space of a year as data-center spending surged, and its trailing figure has slipped further since. Meta, still strongly cash-generative, has guided capital spending up toward 145 billion dollars and keeps nudging the number higher. The hyperscalers are spending as though the demand is real and durable. If it is, the spending pays for itself. If it isn’t, this is where the air comes out first - not at NVIDIA, but at the companies that paid for a decade of compute up front.
This rhymes with the dot-com telecom build-out, when carriers borrowed something like half a trillion dollars to lay fiber that demand took years to grow into. The difference, for now, is that today’s spenders are mostly funding the build out of their own profits rather than debt, and the capacity is getting used about as fast as it goes in rather than sitting dark, at least so far.
The broad casino is quieter this time
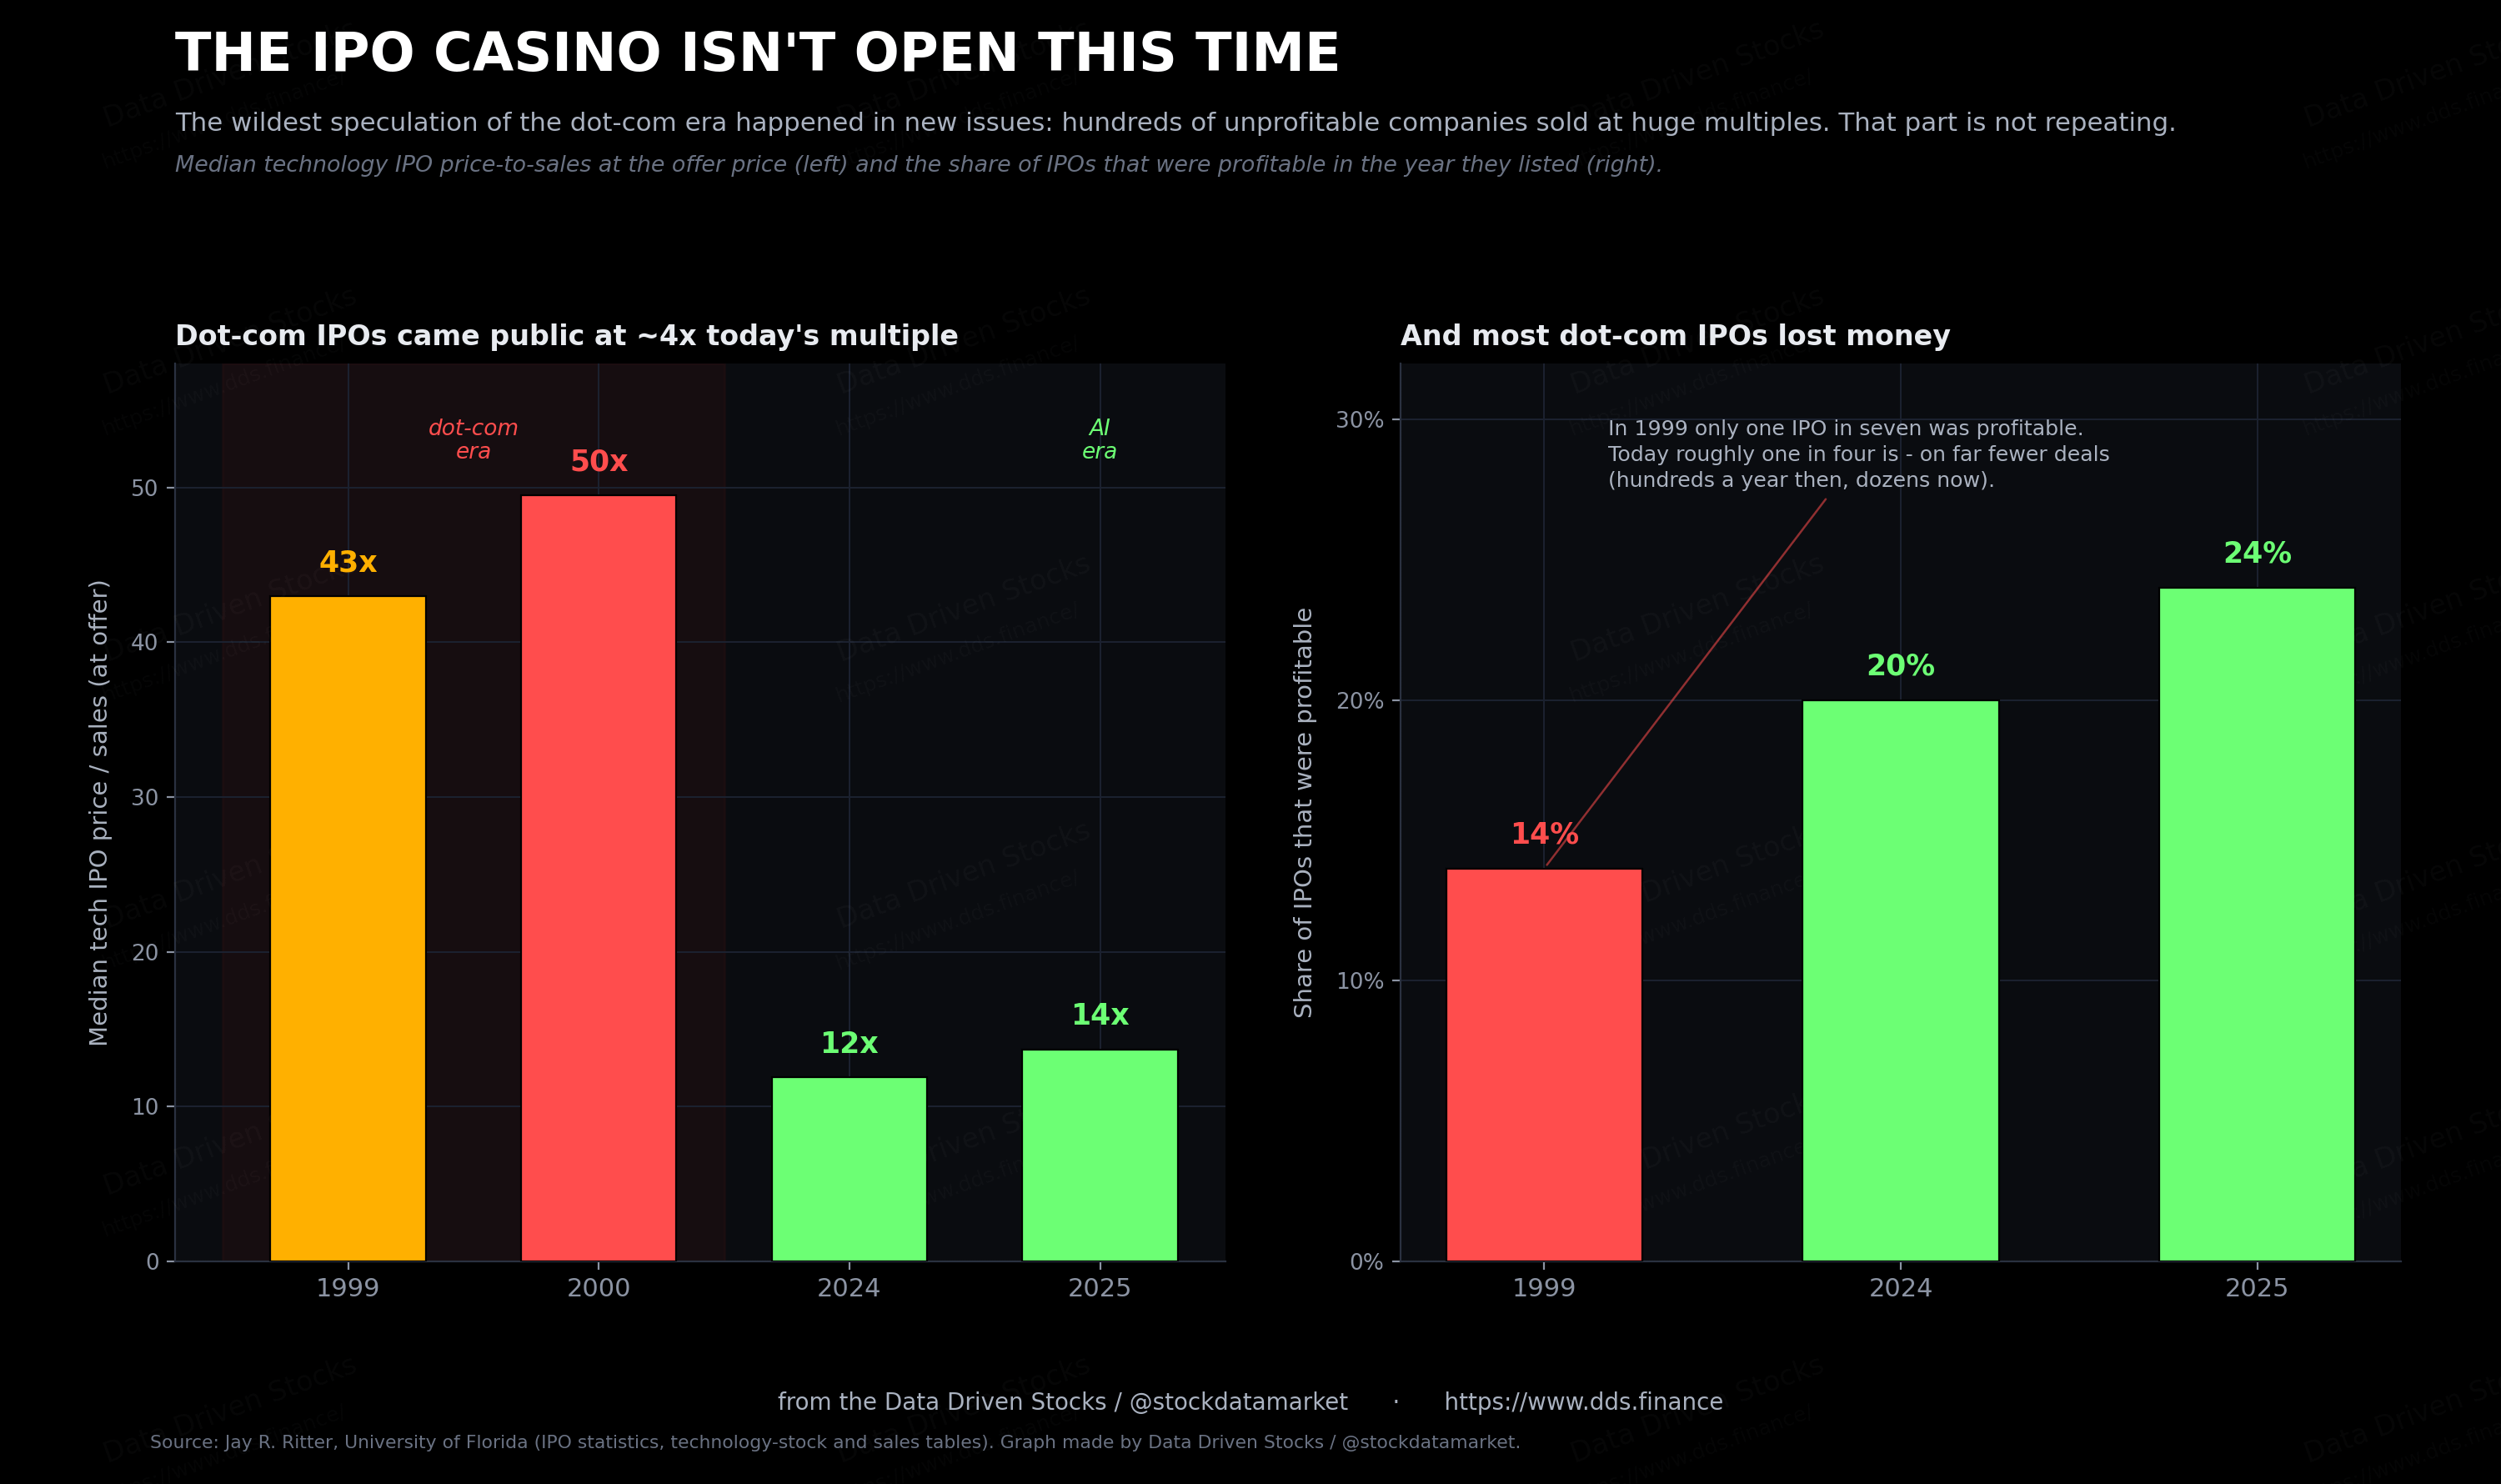
If you want the cleanest evidence that this is not a carbon copy of 2000, stop staring at the megacaps and look at the new-issue market, because that is where the dot-com mania really came off the rails. In 2000 the median technology IPO came public at 49.5 times sales. Hundreds of companies listed every year, and in 1999 only about one in seven of them even made money. Investors were buying revenue multiples on businesses with no earnings and, in plenty of cases, no believable route to any.
In the broad market, that simply isn’t happening now. The median tech IPO of the past few years has priced around 12 times sales, not 50. The count of companies going public has run in the dozens a year, not the hundreds. And the share of IPOs that are profitable has gone up rather than down. The casino floor packed with money-losing startups dumped on anyone at any price is the piece of 2000 that most clearly is not coming back, as long as you only look at the broad market.
Where the froth actually went
That disciplined picture is real, but it is only half the new-issue story, and the second half pulls in the opposite direction. The speculative money did not disappear. It climbed upmarket, into a handful of enormous names, and it stayed private far longer than it ever did in the 1990s.
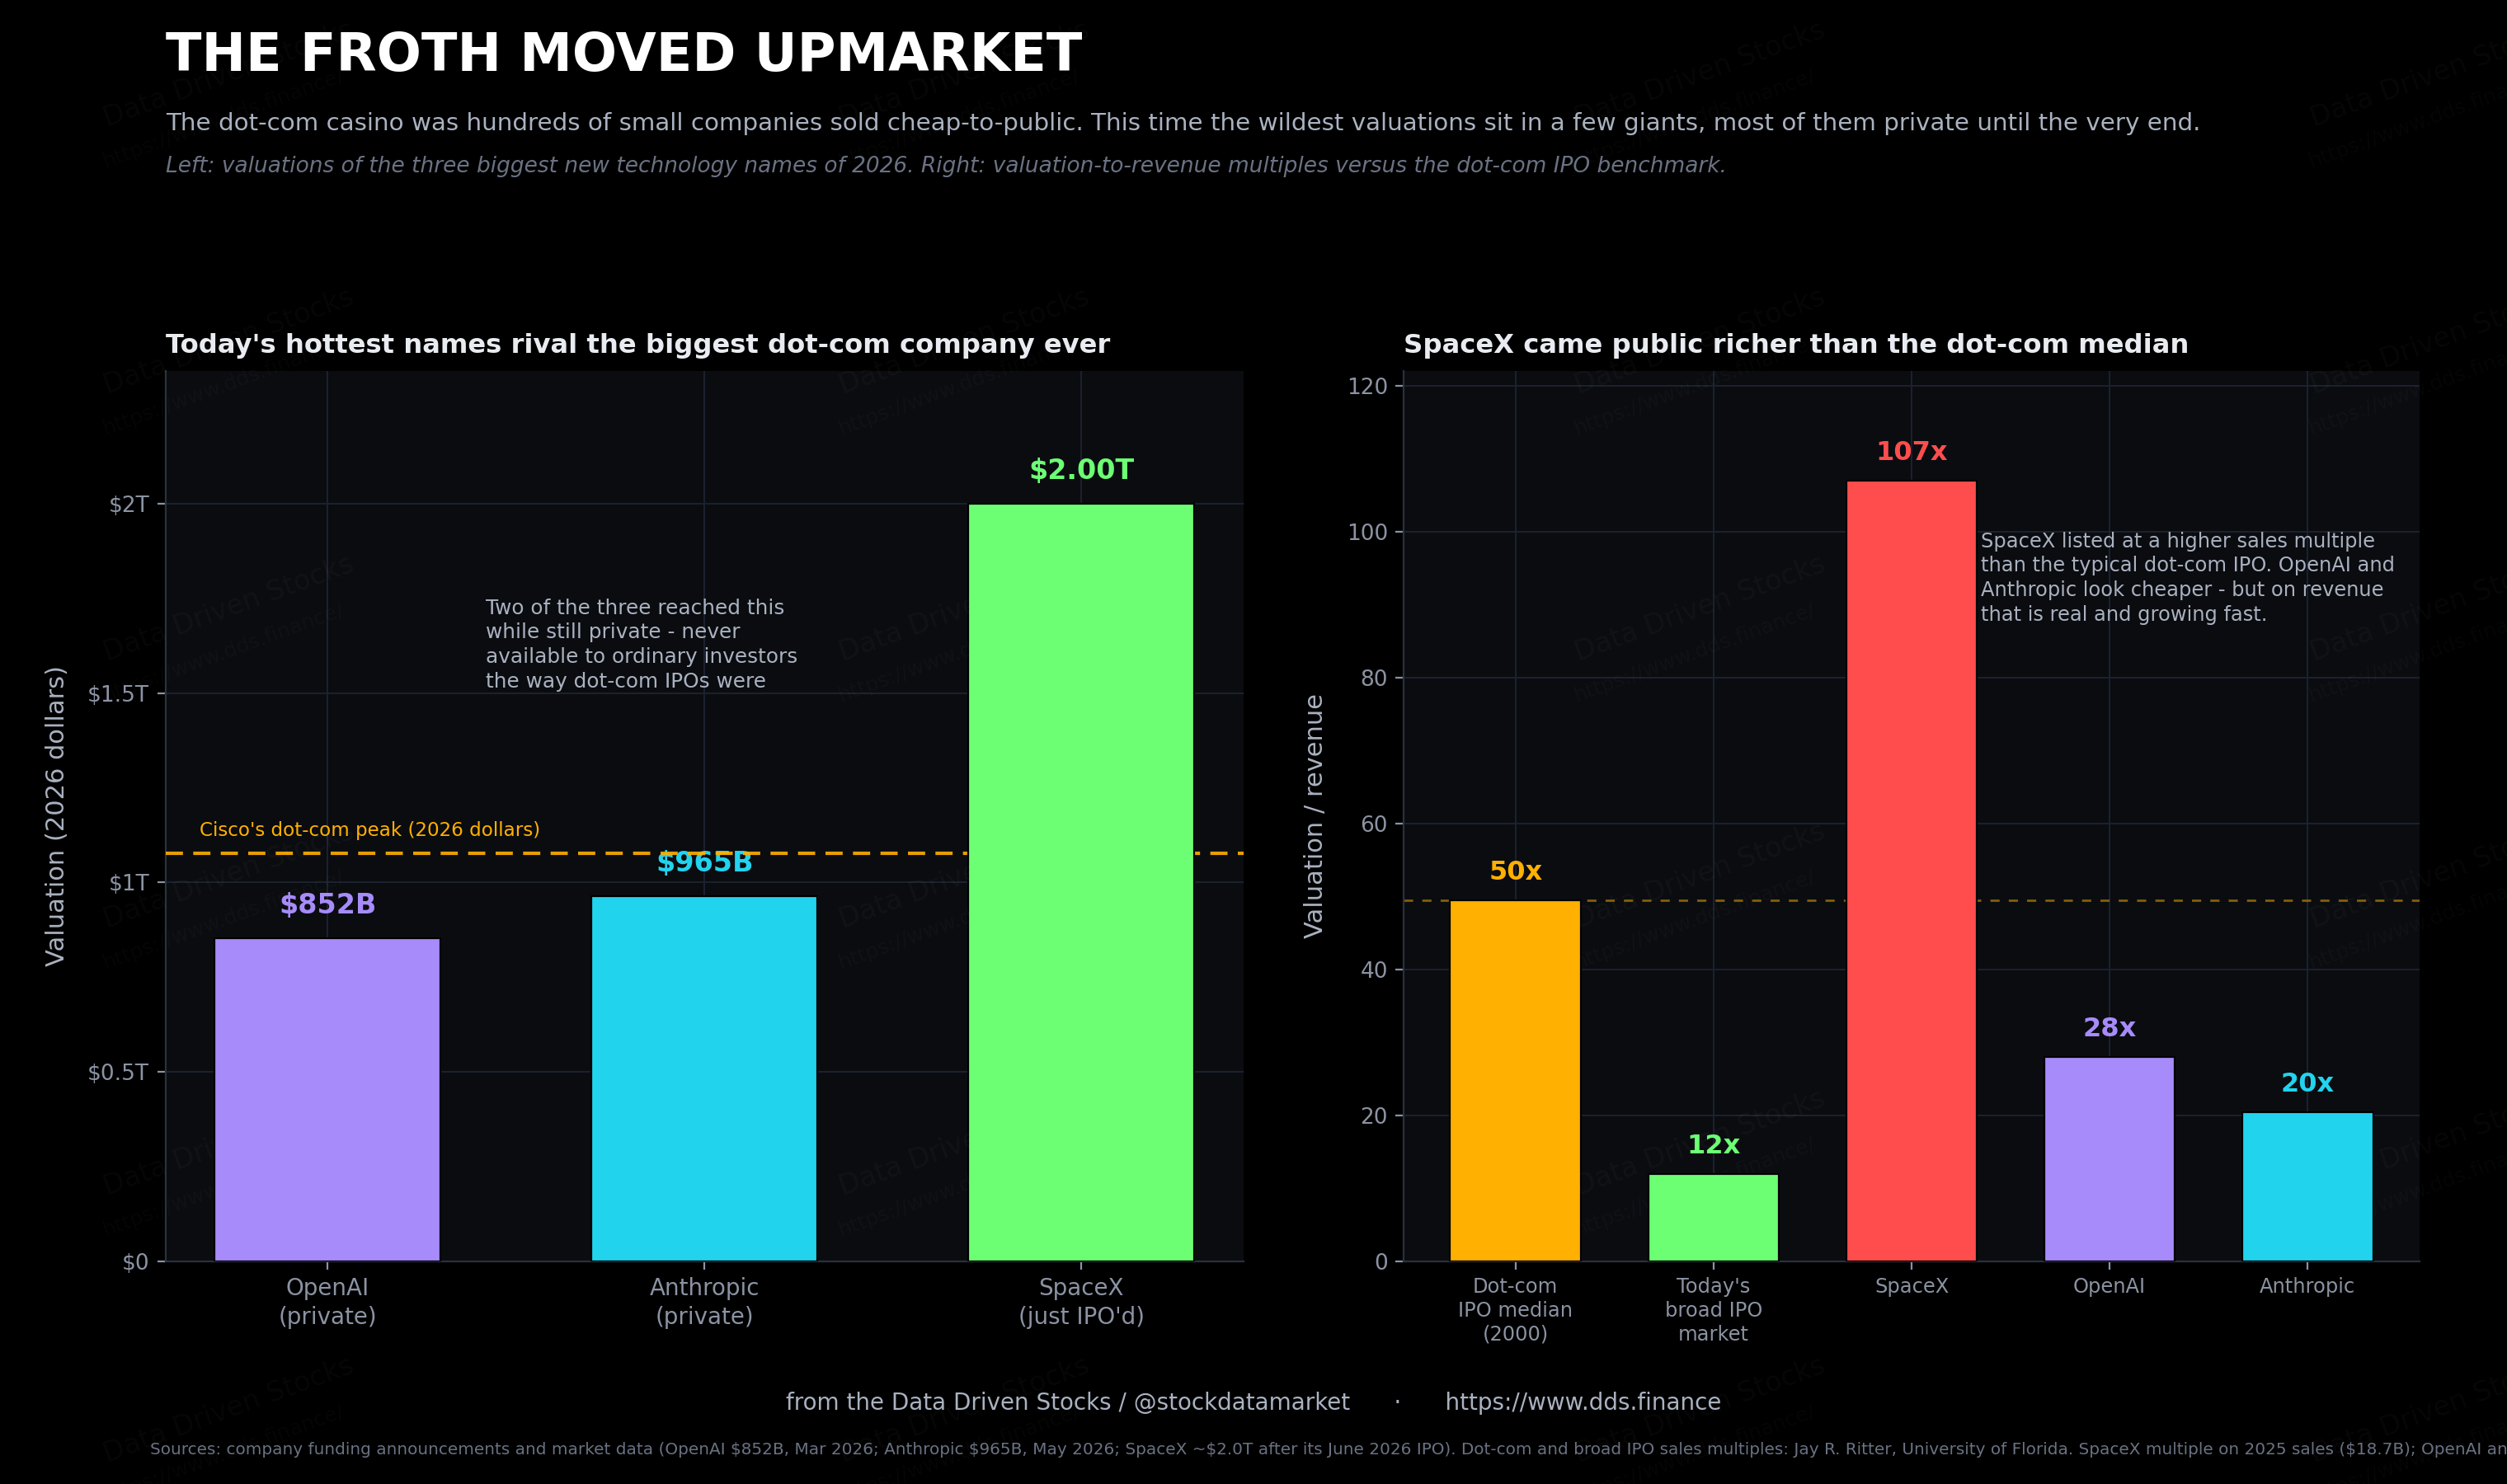
Start with the one that did go public. In June 2026 SpaceX pulled off the largest initial public offering in history, raising roughly 86 billion dollars and listing at a valuation near 1.8 trillion; inside a few days the stock had carried the company past 2 trillion. Set that against 2025 sales of about 19 billion and a GAAP net loss of nearly 5 billion, and you get something like 100 times revenue, which is above the median dot-com IPO multiple of 49.5, not below it. SpaceX also pointed an unusually large slice of the deal, around thirty percent, at retail investors through the big brokerages. A money-losing business, priced at a triple-digit sales multiple, with the public piling in. That is about as faithful a dot-com echo as 2026 has produced.
The two biggest names in artificial intelligence carry the opposite half of the story. OpenAI was valued at 852 billion dollars in March 2026 after a record 122-billion-dollar round, and Anthropic jumped past it two months later at 965 billion. On paper, each is now worth close to what Cisco was worth at the very top of the dot-com bubble in today’s money, and each is still private. Both lose money. OpenAI has told investors it does not expect to turn a profit before 2030, and both have committed to data-center spending measured in the hundreds of billions. One Bridgewater partner put OpenAI’s price plainly to clients, calling its multiple “priced for a monopoly outcome that does not yet exist.”
So the similarity and the difference sit right on top of each other. The behavior is the same: vast valuations on businesses that lose money, sky-high revenue multiples, and a public being pulled in. What changed is the shape of it. In 2000 the excess was spread wide, hundreds of tiny companies dumped onto the public market at any price, with ordinary investors taking the full force of the unwind. In 2026 it sits concentrated and mostly private, three or four names carrying most of the froth, the steepest valuations set in rounds only institutions and insiders could get into, and the public showing up late if at all. Whether that is reassuring or ominous comes down to how those private valuations hold up when these companies finally meet the public market at scale.
The real economy underneath, and the one thing that should worry you
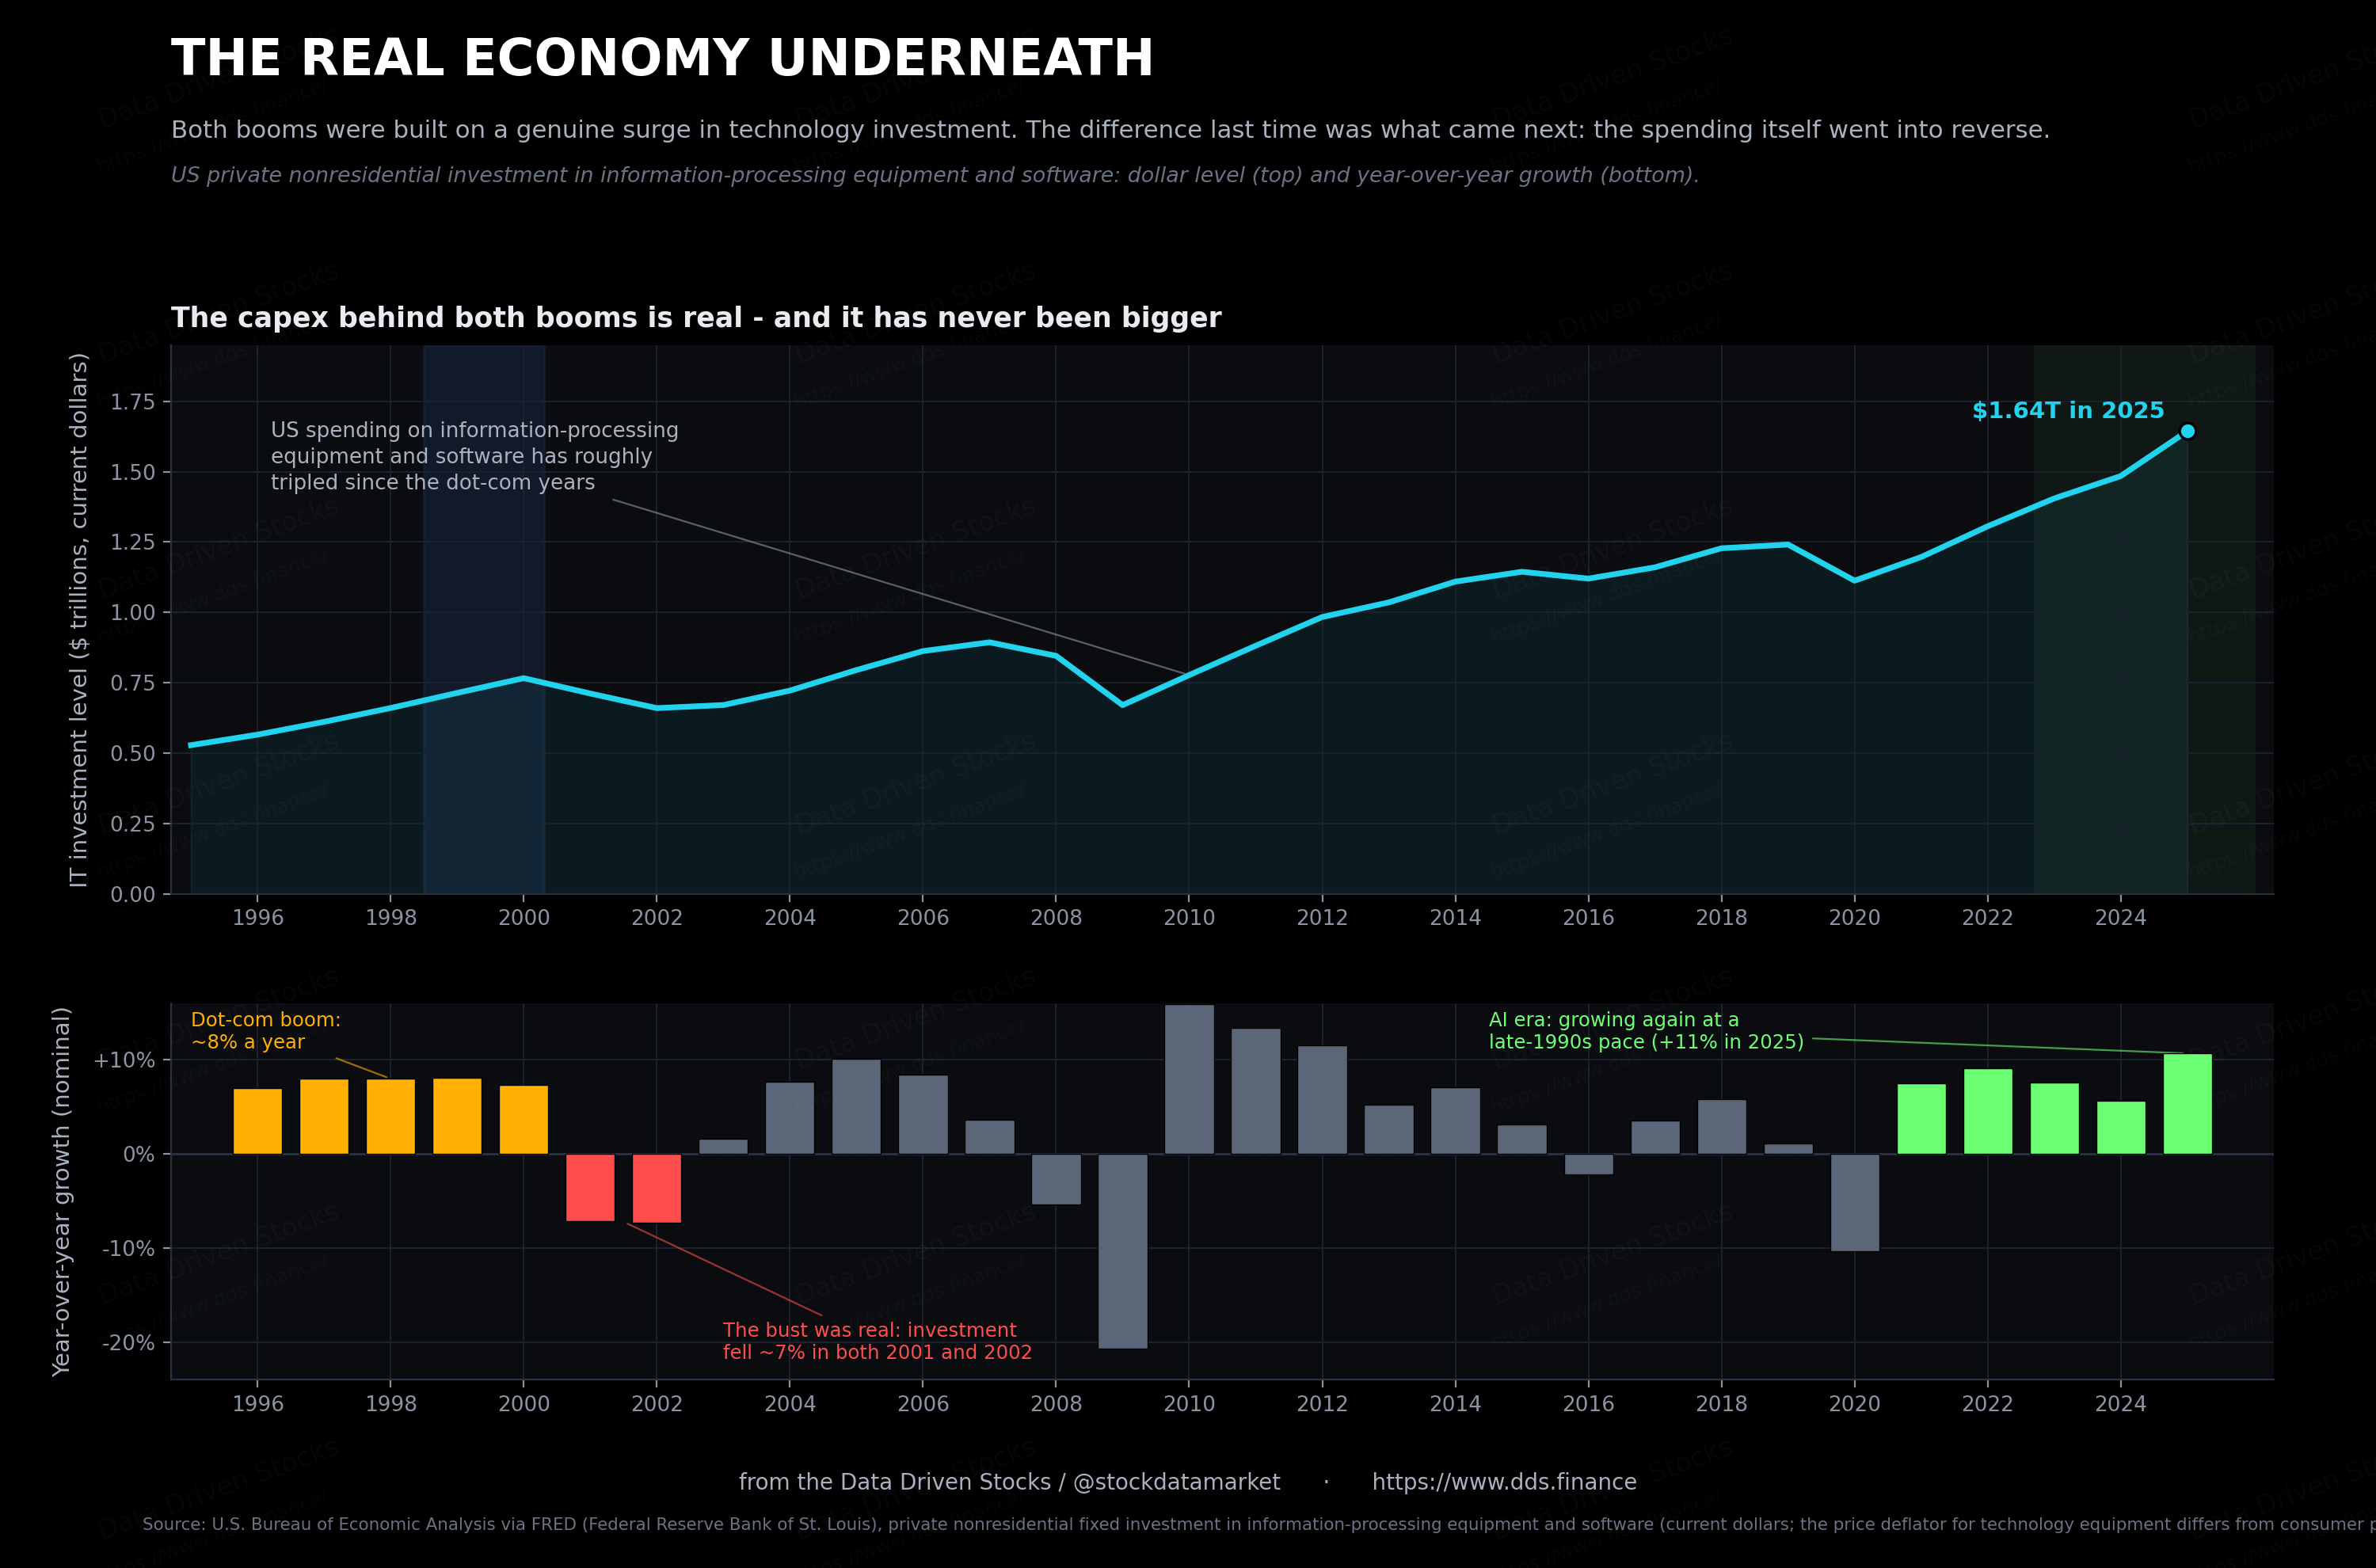
Both booms grew out of a real surge in technology investment, and that surge shows up in the national accounts, not only in stock prices. US spending on information-processing equipment and software grew around 8 percent a year through the late 1990s. In current dollars it has more than tripled since, and it is growing again at a similar clip, about 11 percent in 2025, the fastest rate since the dot-com years. (That series is reported in current dollars; the price of technology gear has fallen for decades, so the real quantity of computing going in has grown faster still.)
The dot-com bust, though, was more than a stock-market event. The spending itself went into reverse. Investment in this category fell about 7 percent in 2001 and roughly the same in 2002, two straight years of the productive economy pulling back, not just the index. That is what actually breaks a build-out. Not a high P/E ratio, but the moment the capital spending everyone has penciled in forever simply stops.
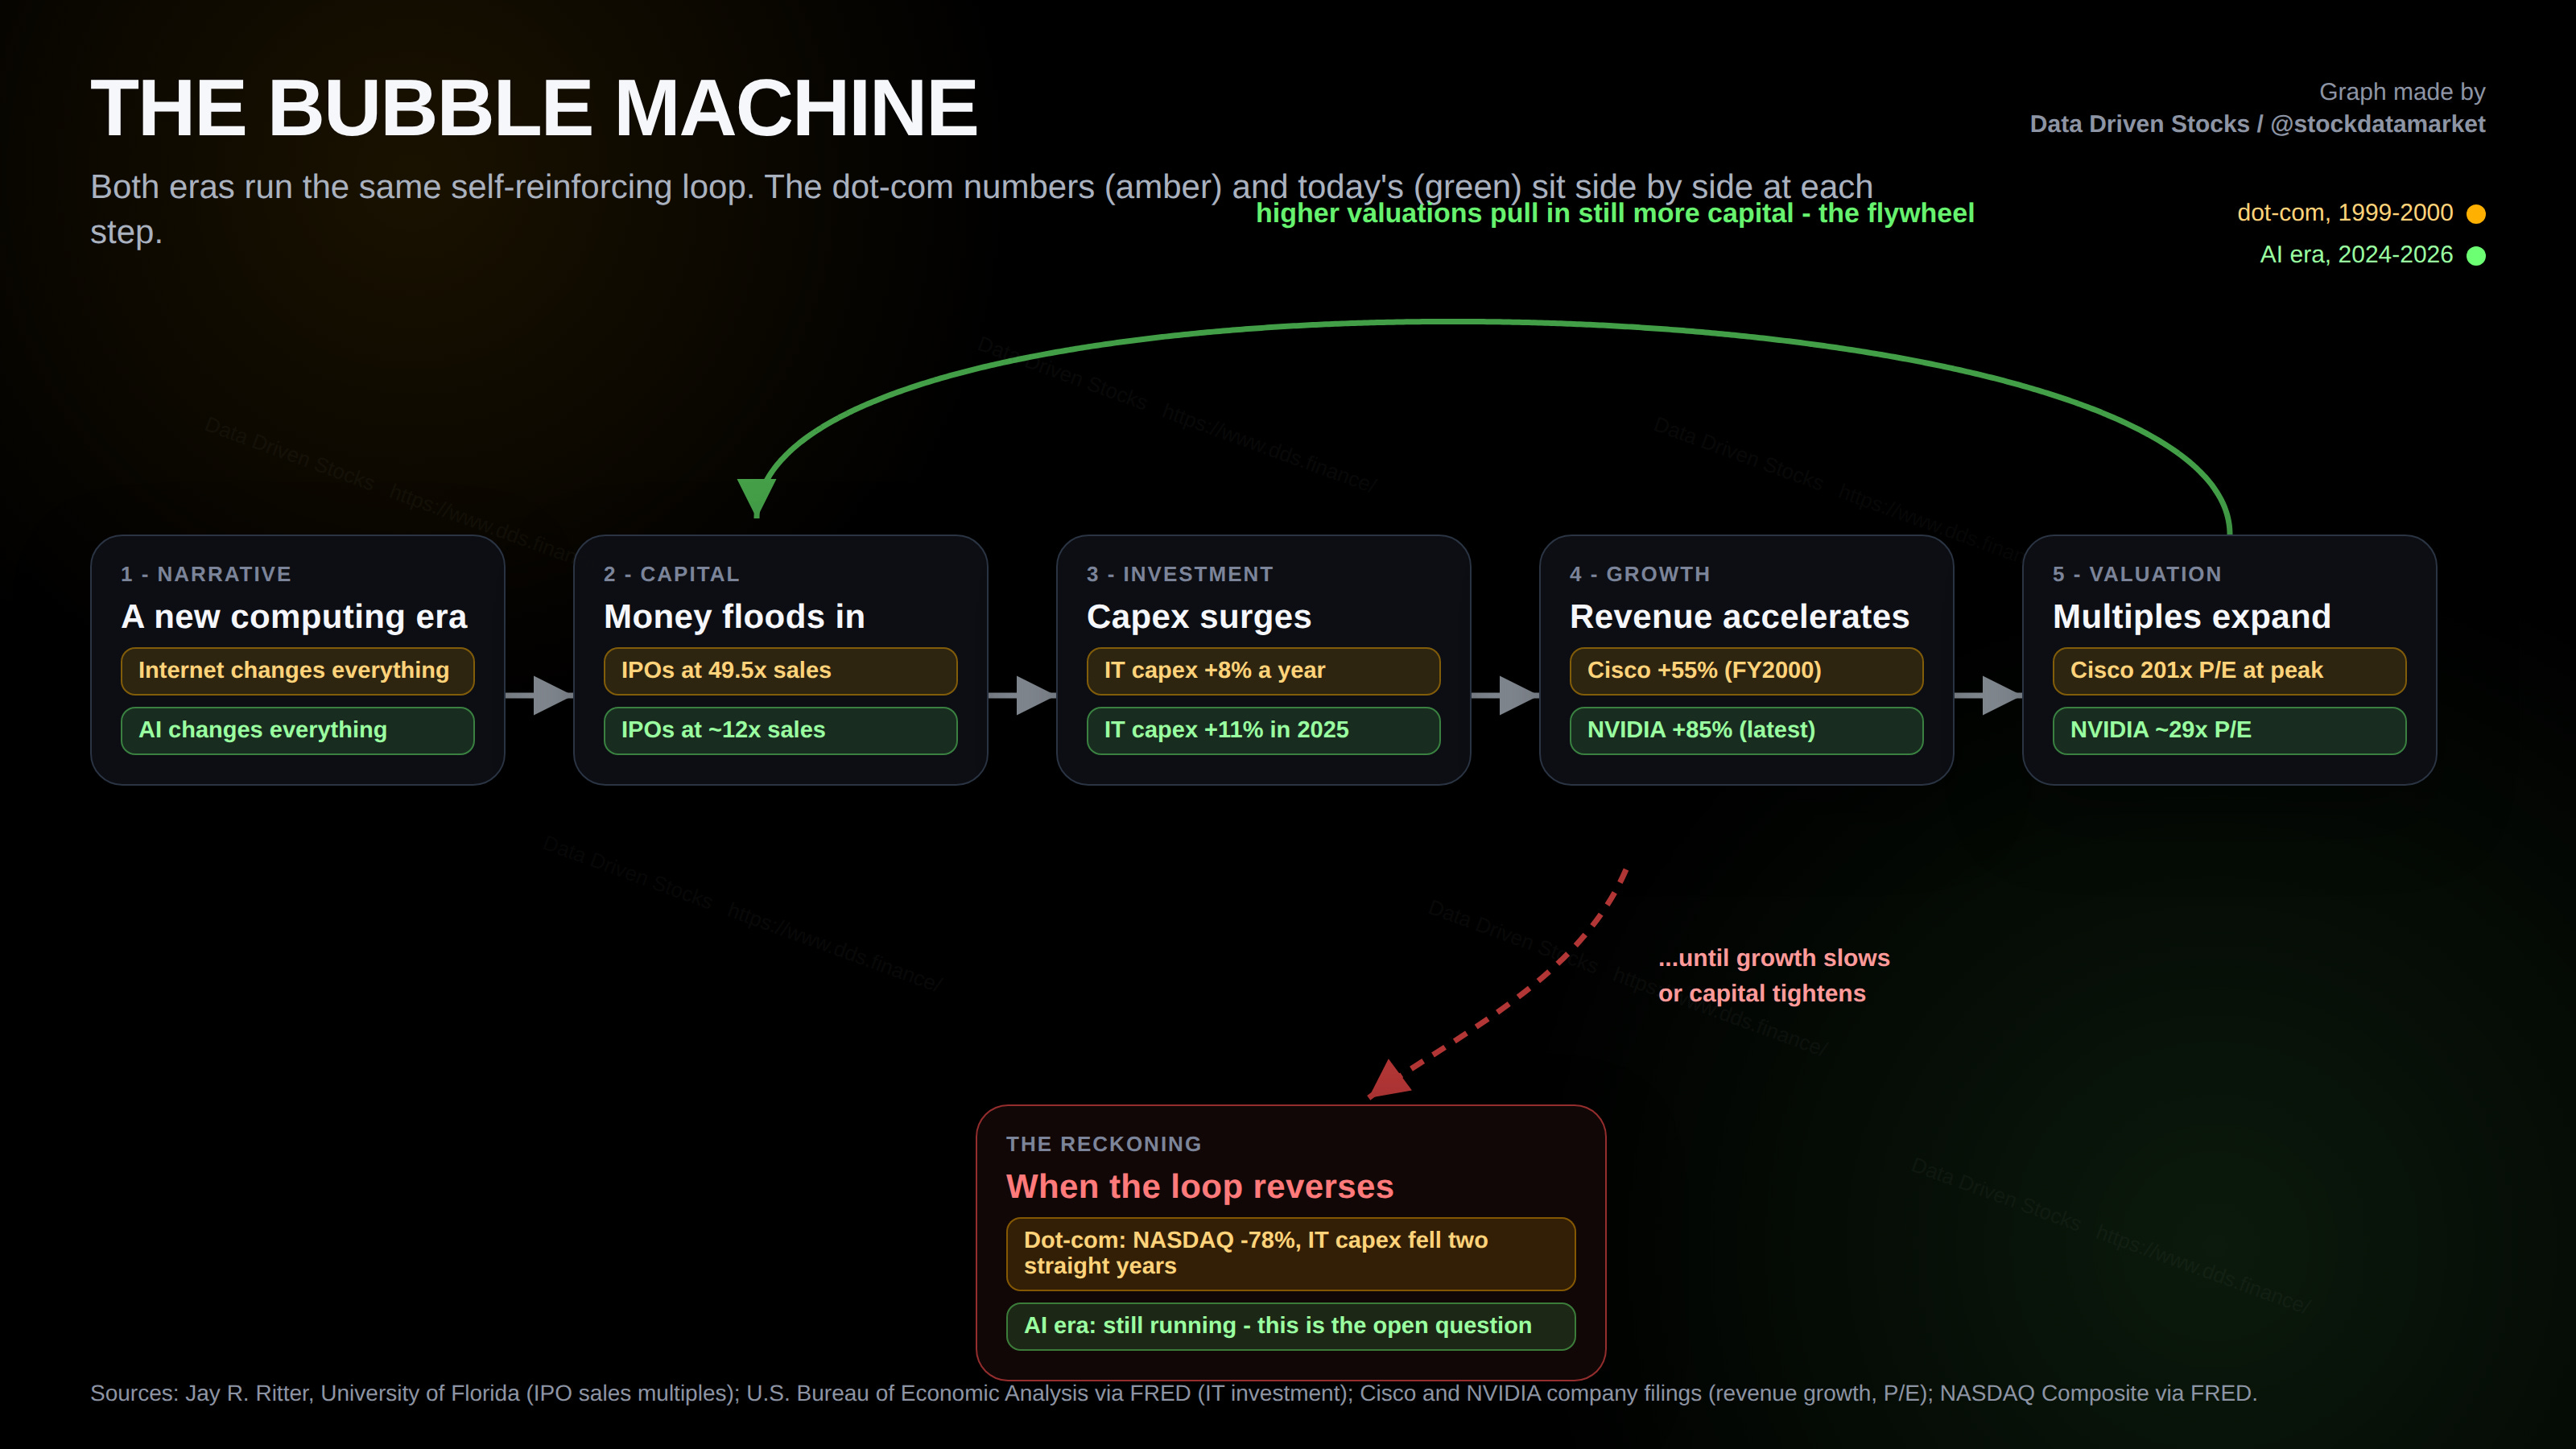
This is the loop both eras share, and laying it out is the easiest way to hold the whole thing in your head. A new computing story pulls in capital, the capital funds capex, the capex drives revenue growth, and the growth lifts valuations. Higher valuations then pull in still more capital, and the wheel turns faster, right up until growth slows or capital tightens and the same wheel starts turning the other way.
So where does that leave the comparison? In two places at once. The bear case is easy to make. The concentration is more extreme than it was in 2000. The capital spending is huge and front-loaded. The executives talk like it’s 1999. A few money-losing giants are now worth close to a trillion dollars each, priced for monopoly outcomes that haven’t arrived. And all of it rests on AI demand holding up. That is step four in the loop, the step the dot-com era proved can slow without warning.
The bull case is just as real. The company at the center is about four times the size of the last bubble’s champion, even after inflation, and it trades at a fraction of the multiple. It throws off more cash in one year than the dot-com leaders did in their best, in today’s money. The broad IPO frenzy never came back. And the investment underneath it all is getting used about as fast as it goes in.
Both are true at once. Anyone who tells you it lands cleanly on “it’s exactly like 2000” or “it’s nothing like 2000” is selling you the easy version. The dot-com era was not a fraud. Its scariest number is mostly a measurement artifact. The AI build-out is better financed and more concentrated, both at the same time. The wheel is the same. What is riding on it is not.
All boils down to the AI thesis becoming profitable, or the bubble will pop.
Sources
NASDAQ Composite and effective federal funds rate: Federal Reserve Bank of St. Louis (FRED), series NASDAQCOM and FEDFUNDS. US investment in information-processing equipment and software: US Bureau of Economic Analysis via FRED, series Y033RC1Q027SBEA, reported in current dollars.
Inflation adjustment: dollar figures from the dot-com era are converted to 2026 dollars using the Consumer Price Index for All Urban Consumers (CPI-U), Federal Reserve Bank of St. Louis (FRED), series CPIAUCSL, indexed to the latest available monthly print. CPI is a general-purpose price index; the price deflator specific to technology equipment has fallen over this period, so for aggregate technology investment the current-dollar series is shown rather than a CPI-adjusted one.
Dot-com company financials (revenue, net income, EPS, cash flow): Intel, Cisco, Dell and Microsoft annual reports and Form 10-K filings via SEC EDGAR; Cisco fiscal 2001 selected financial data; Intel 2000 and 2001 annual reports. Quarterly revenue series for Intel, Cisco, Amazon and eBay: SEC EDGAR Form 10-Q and 10-K filings.
AI-era company financials (revenue growth, free cash flow, backlog, margins): NVIDIA, AMD, Meta, Amazon, Oracle, Intel and Super Micro quarterly earnings releases and Form 8-K and 10-K filings via SEC EDGAR, covering results reported through the first half of 2026.
Price-to-earnings calculations: share prices from Yahoo Finance (split-adjusted) divided by as-reported diluted earnings per share from company 10-K filings. Cisco peak market capitalization of approximately 555 billion dollars and peak price-to-earnings ratio of 201: contemporaneous market data and Morningstar; the peak dot-com market capitalizations are additionally shown in 2026 dollars (Cisco approximately 1.08 trillion, Microsoft approximately 1.12 trillion) using the CPI-U adjustment above. NVIDIA market capitalization of approximately 4.7 trillion dollars and current multiple: market data, June 2026.
IPO statistics (median technology IPO price-to-sales, share of profitable IPOs, issuance volume): Jay R. Ritter, University of Florida, IPO statistics and technology-stock tables.
Valuations of recent technology offerings and private rounds: SpaceX initial public offering of June 2026, including offer price, proceeds, post-listing valuation, 2025 revenue and net loss, and retail allocation, from the company’s registration statement and contemporaneous market reporting and analysis (Morningstar, PitchBook). OpenAI valuation of 852 billion dollars (March 2026 financing) and Anthropic valuation of 965 billion dollars (May 2026 financing), revenue run-rates, profitability expectations and data-center commitments, from company financing announcements and contemporaneous reporting (CNBC, Morningstar, Crunchbase). SpaceX, OpenAI and Anthropic revenue multiples computed from these valuations against 2025 sales (SpaceX) and annualized revenue run-rates (OpenAI, Anthropic).
Executive quotations: Intel and Cisco year-end earnings releases and annual reports (2000-2002); NVIDIA quarterly releases and GTC remarks; AMD, Oracle and Super Micro earnings calls and releases (2025-2026). Comparative analysis of NVIDIA versus Cisco: Morningstar.