Short U.S. Market Update - July 22 Close
We went ... S&P 500 almost flat - only -0.14%. Silver and Gold just wow!

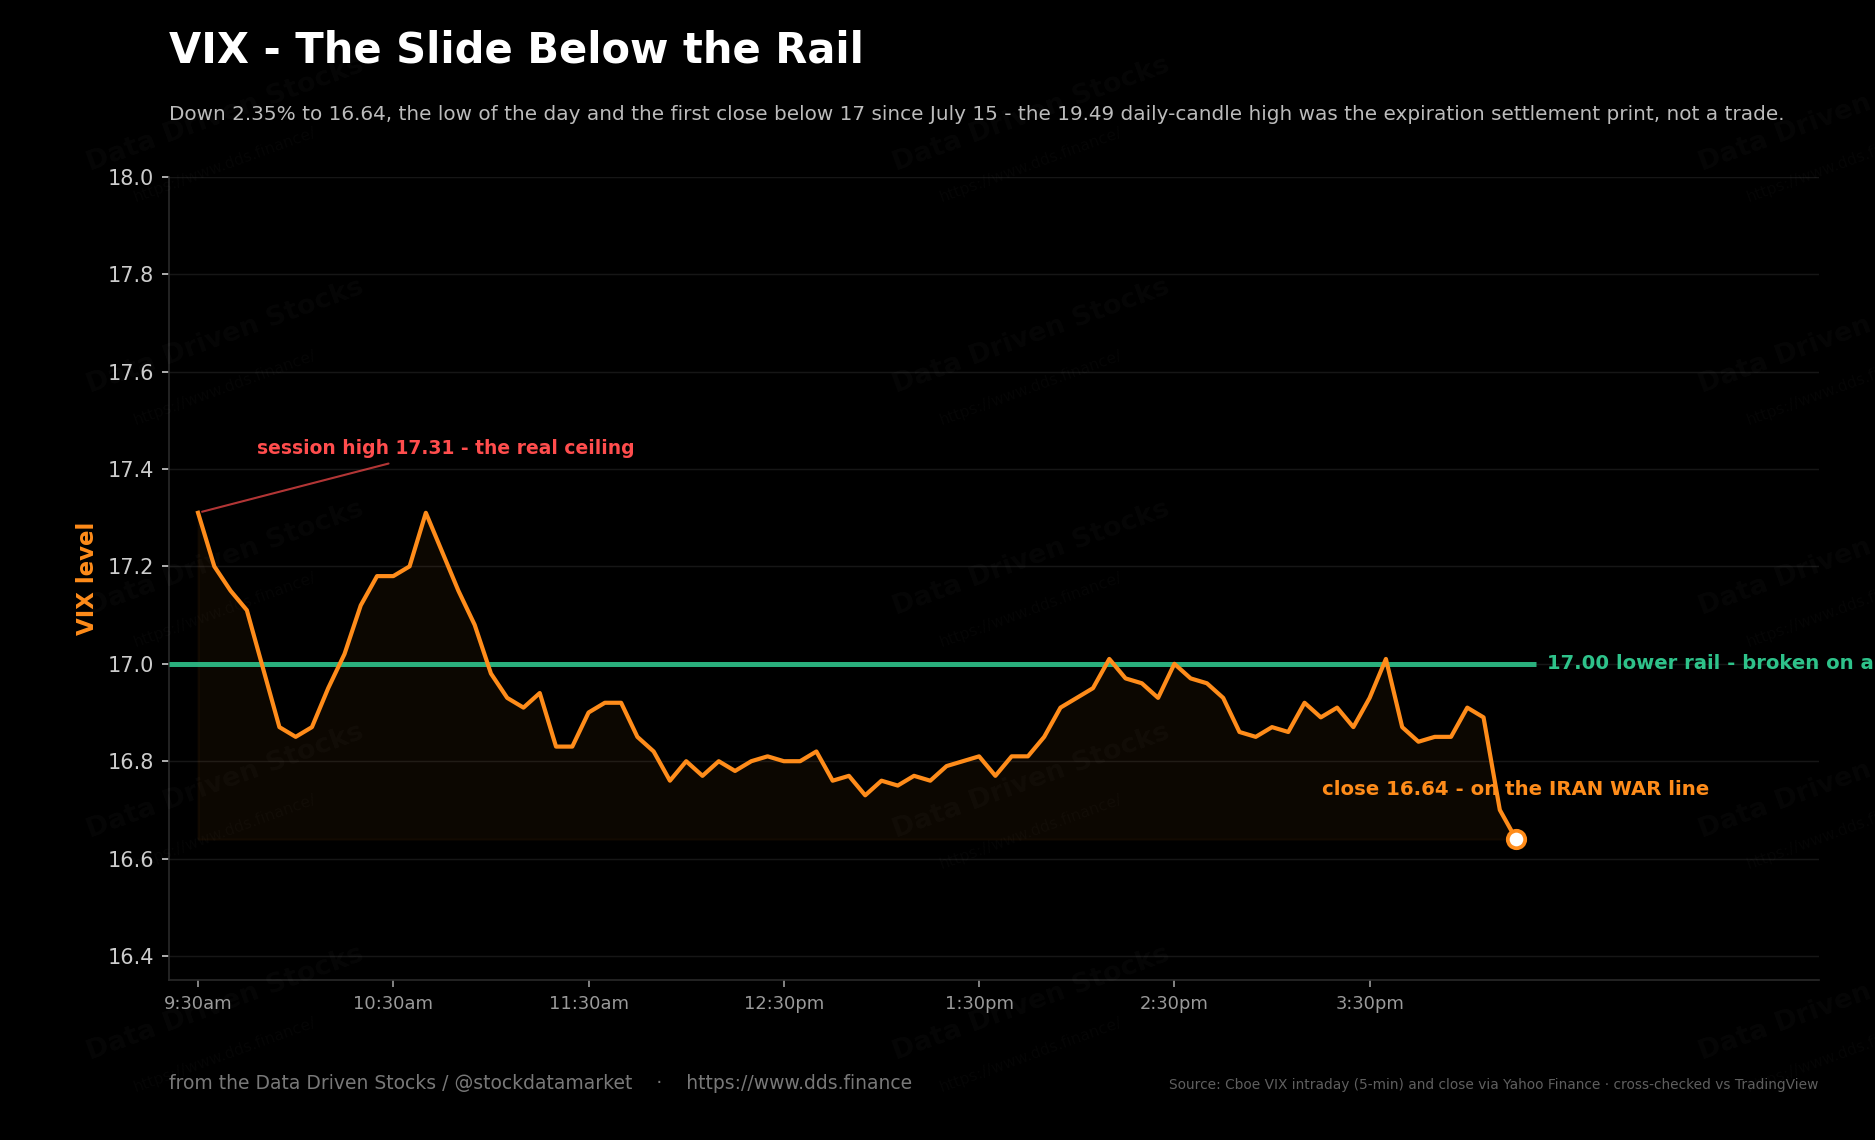
So we survived another stock market day - the quietest-looking close of the week, and maybe the least reassuring one. The S&P 500 slipped 0.14% to 7,498.96, QQQ gave back 0.5%, the VIX fell 2.35% to 16.64, oil climbed again, and the metals ripped. Tesla and Alphabet report minutes after this note goes out, so the quiet ends tonight. Also both nothing spectacular (almost flat, TSLA went down a bit - but still early, let’s wait for the earning call. But options players lost money anyway due to the volcrush)
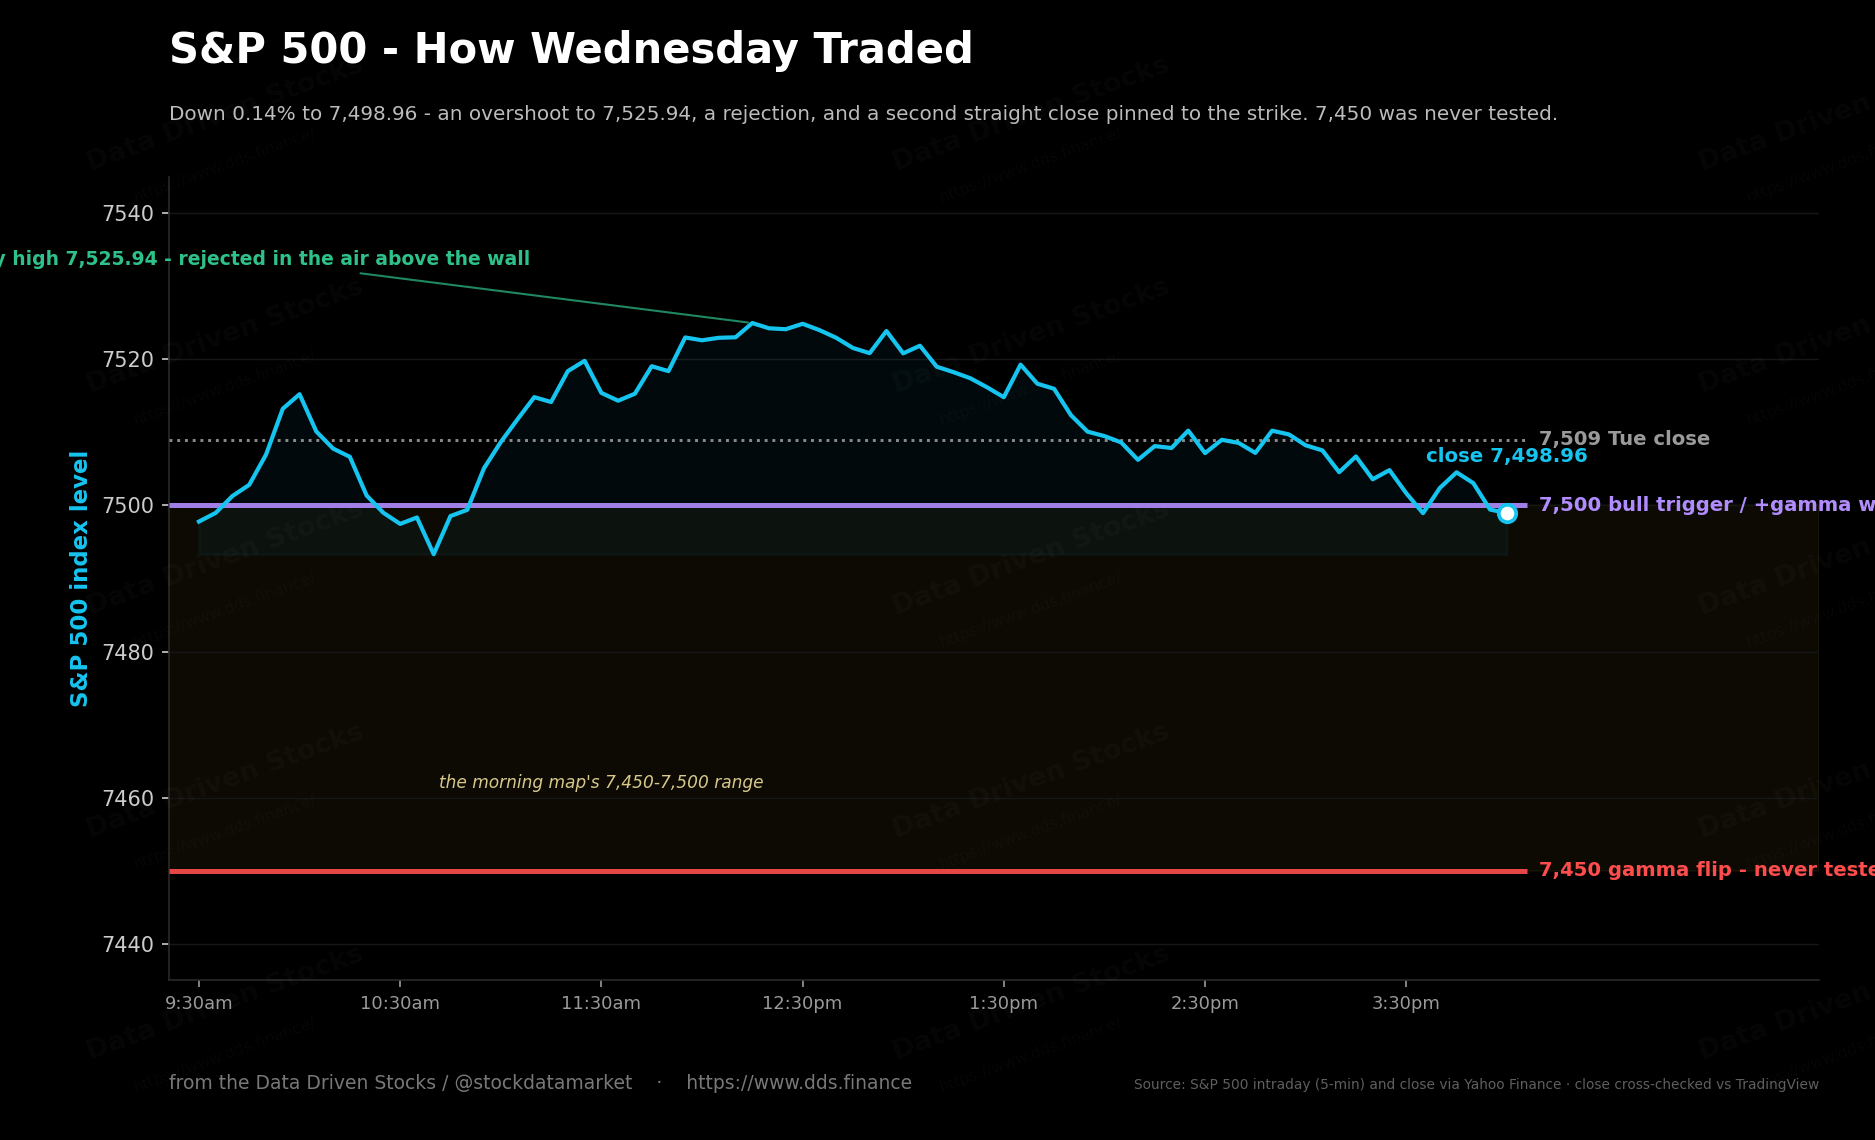
First, the report card against this morning’s map. The call was chop between 7,450 and 7,500. The day overshot to 7,525.94 - into the air above the wall where nothing is positioned - got rejected there, which is exactly the failure mode the map warned about, and closed at 7,498.96: the second consecutive finish pinned to the 7,500 strike, this one within a point. The 7,450 floor we worried about was never tested; the low printed 7,485.85. The wall pinned, the air rejected, the floor untouched. As maps go, this one barely needed the day to happen.
Now the red flag, day two. Yesterday the index could not make new highs while volatility collapsed for three extra hours. Today the divergence went literal: the VIX fell 2.35% and the S&P still closed red. When volatility drops and the index drops with it, the market is telling you it cannot be pushed much higher - and it has now said so two days in a row, a little louder each time.
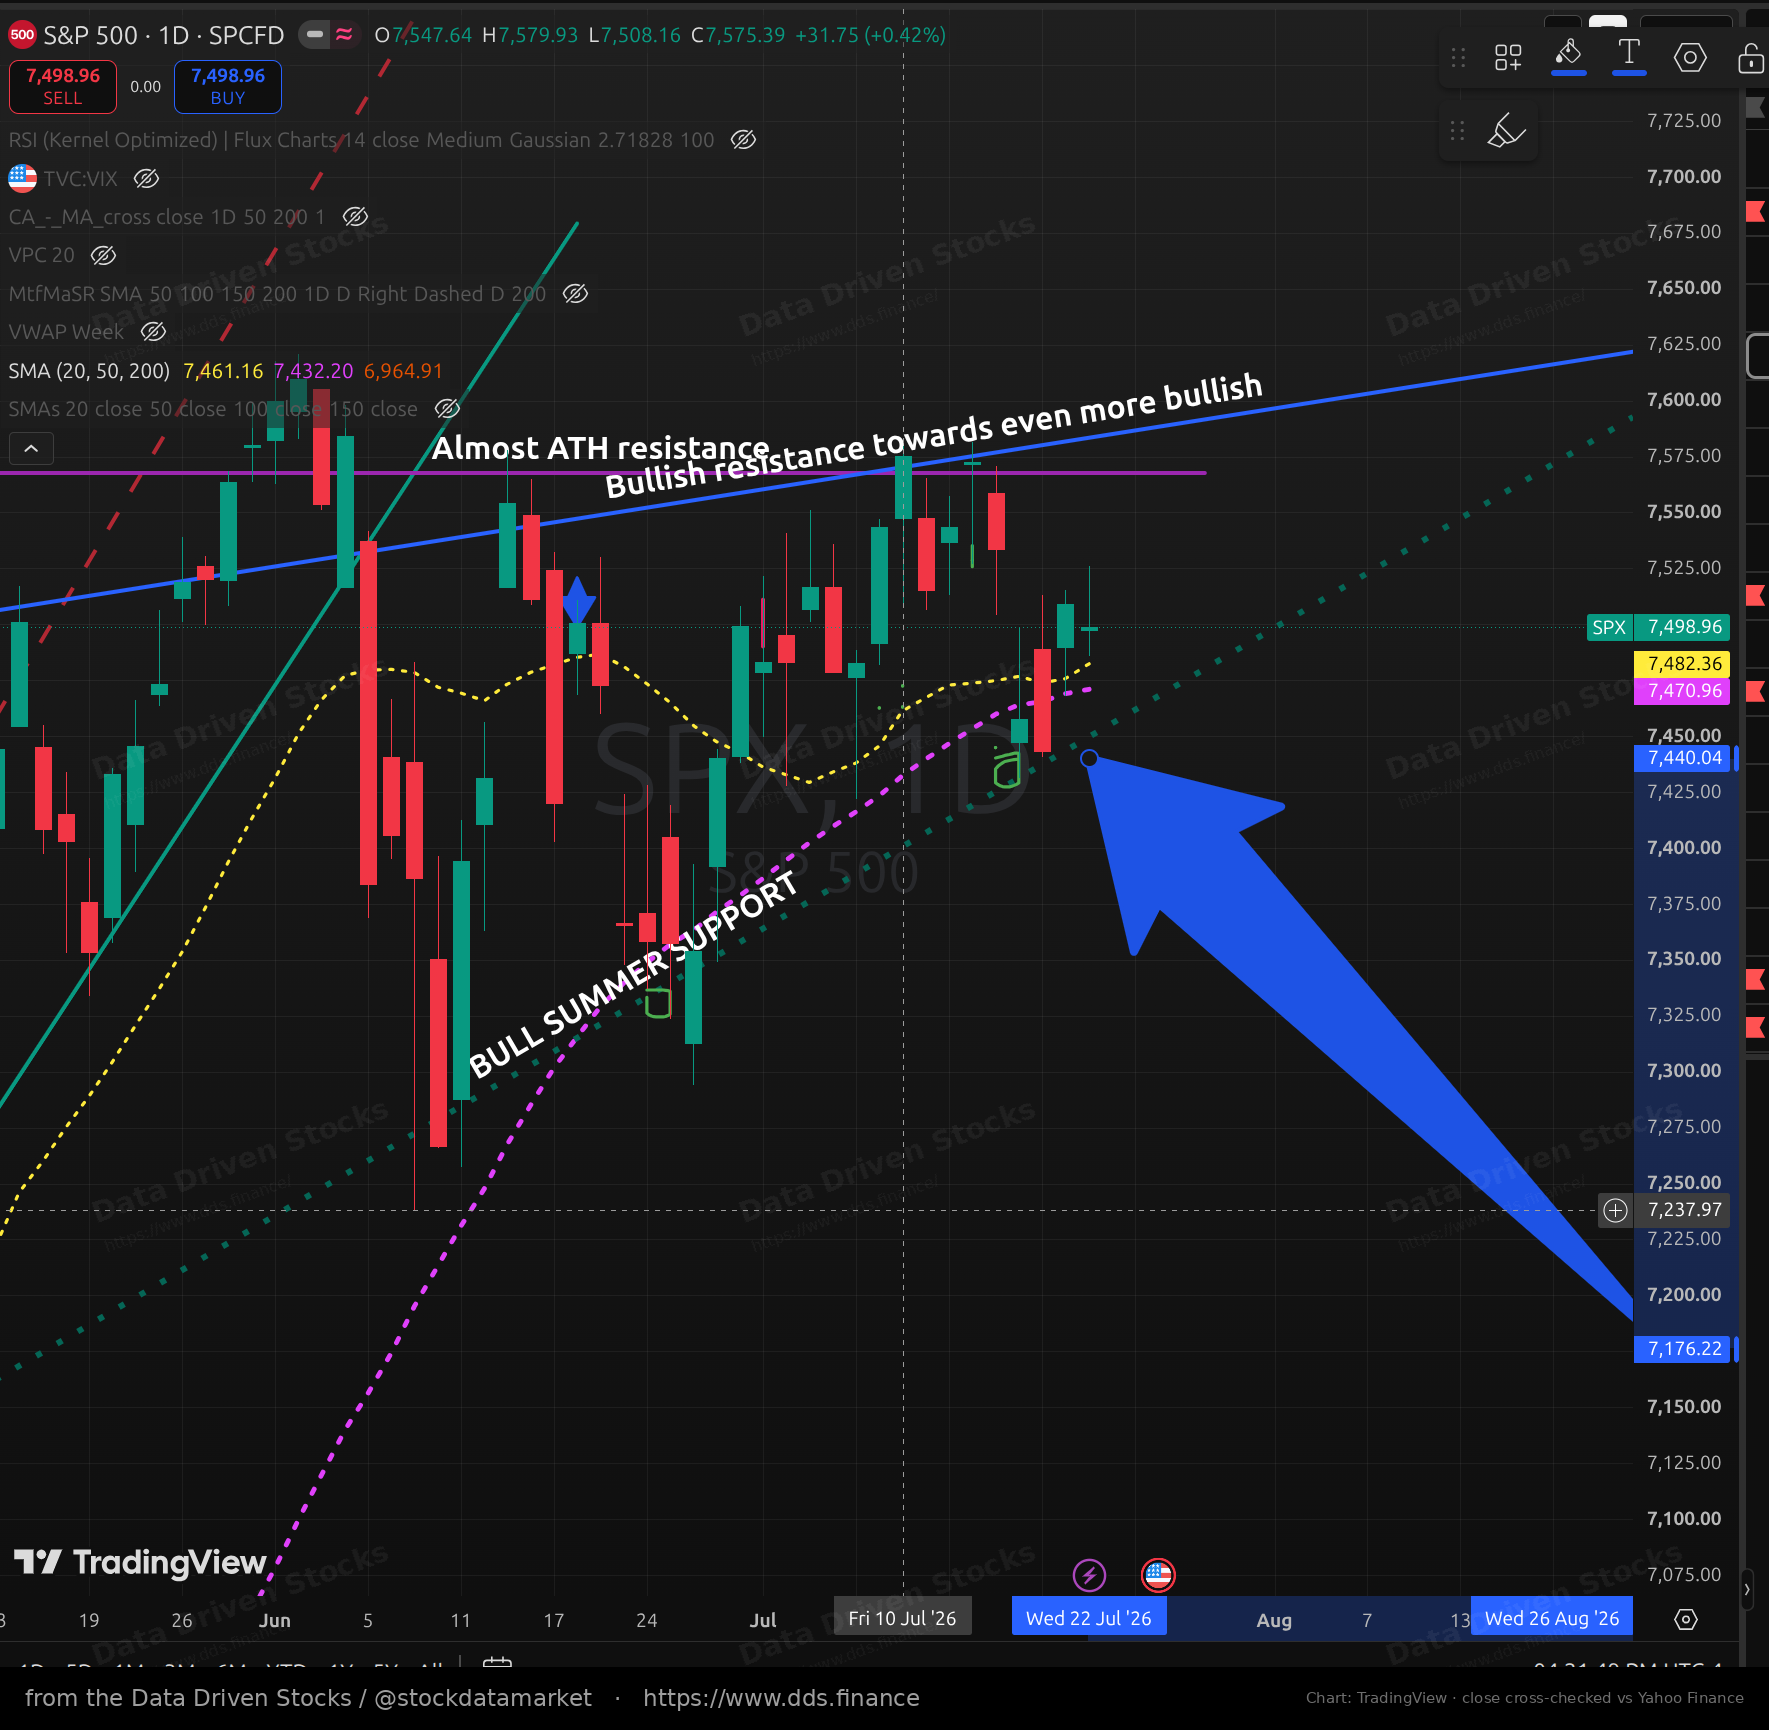
The daily chart adds the context: this is now the fourth session wedged between the rising summer support line and the moving averages flattening out around 7,470-7,480. The coil we have been writing about all week did not resolve today. It just got a day tighter, with the resolution mechanism now scheduled for after hours.
Then there is the day’s genuine anomaly, and it lives in the volatility complex. SVIX - the short-VIX ETF - was red the entire session. It never traded above Tuesday’s close, not once, and finished down 0.7% at 24.23. On a day the VIX itself fell 2.35%. The short-volatility vehicle lost money on a falling-volatility day. Mechanically, that combination means one thing: spot volatility got crushed while the VIX futures curve refused to follow - the market would not sell forward volatility at any point today. A vol complex that crushes the present and refuses to discount the future is bracing for something, and this particular pairing - SVIX and VIX red together - has a habit of showing up near stock market tops.