

Short U.S. Market Update - August 4, 2026 (Closing Bell)
We had extreme bull rally - but what's next ?

Two record closes in two days, and the second one came with volatility going up alongside it. That combination is very rare …
The S&P 500 closed at 7,736.50, up 136.00 points or 1.79%. Nasdaq 100 added 3.32%, the Composite 2.59% and the Dow 1.71% to another record of 54,085.94. QQQ gained 3.40% to 723.85 and the Russell proxy 1.85% to 301.69. Crude fell another 5.48% to 75.94 and ten-year yields eased to 4.63%.
The map, and a branch that never got tested
This morning’s note put a gamma flip at 7,600 with a negative block at 7,595, and said the ground below was undefended down to 7,550 and then 7,515. None of that mattered. The session low was 7,629.10, printed in the first ten minutes, which is 29 points clear of the flip. It was never threatened.
The upside branch ran instead, and it ran hard. Price cleared the 7,650 magnet by 9:50 and closed above it on 75 of the day’s 79 five-minute bars. It cleared 7,680 by 10:40 and 7,700 by 11:20, ran to 7,758.21 at the end of the afternoon and gave back 22 points into the bell.
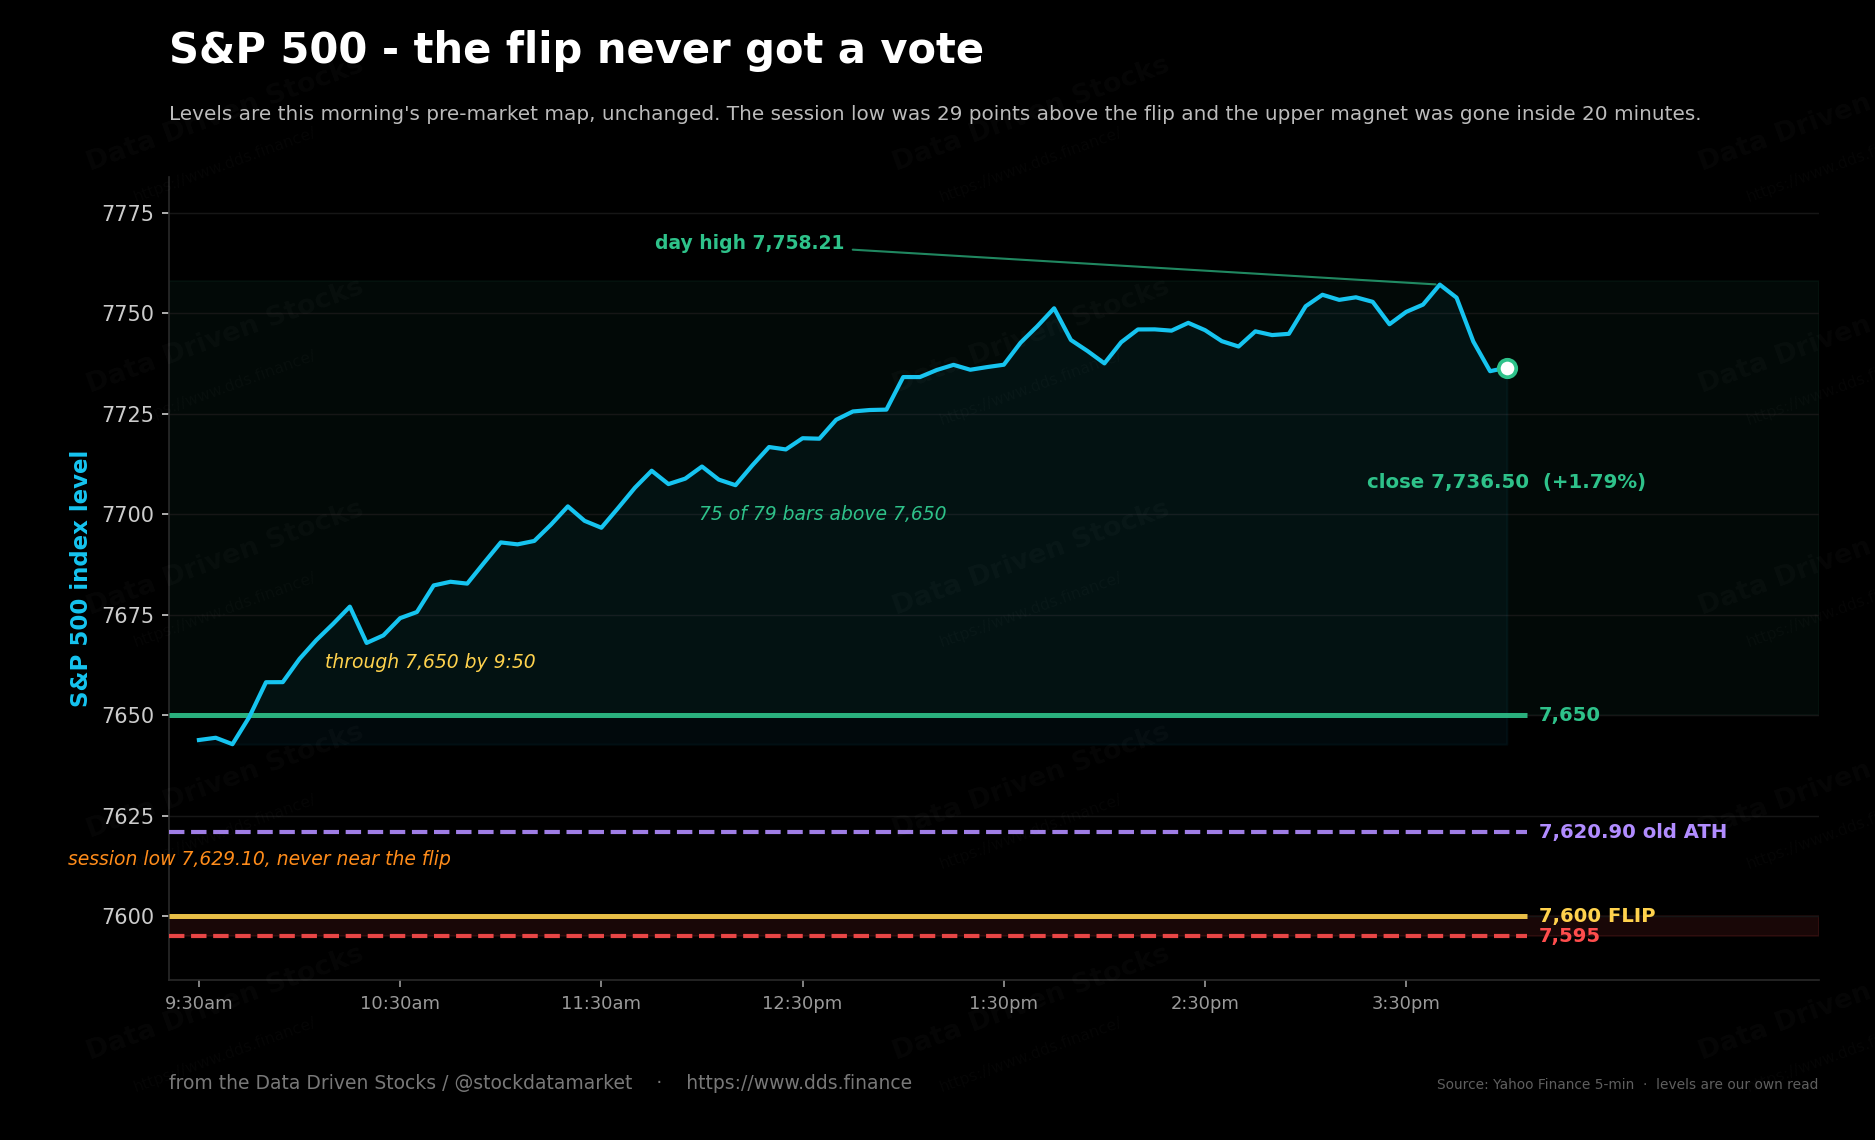
I also warned this morning not to get trapped buying puts into an open that sells. There was no dip to sell into. The low was in by 9:40 and everything after that was one direction. Breaking upper line is very rate - especially by over 100 points. Happens only few times per year. But this year it happens suspiciously too often!
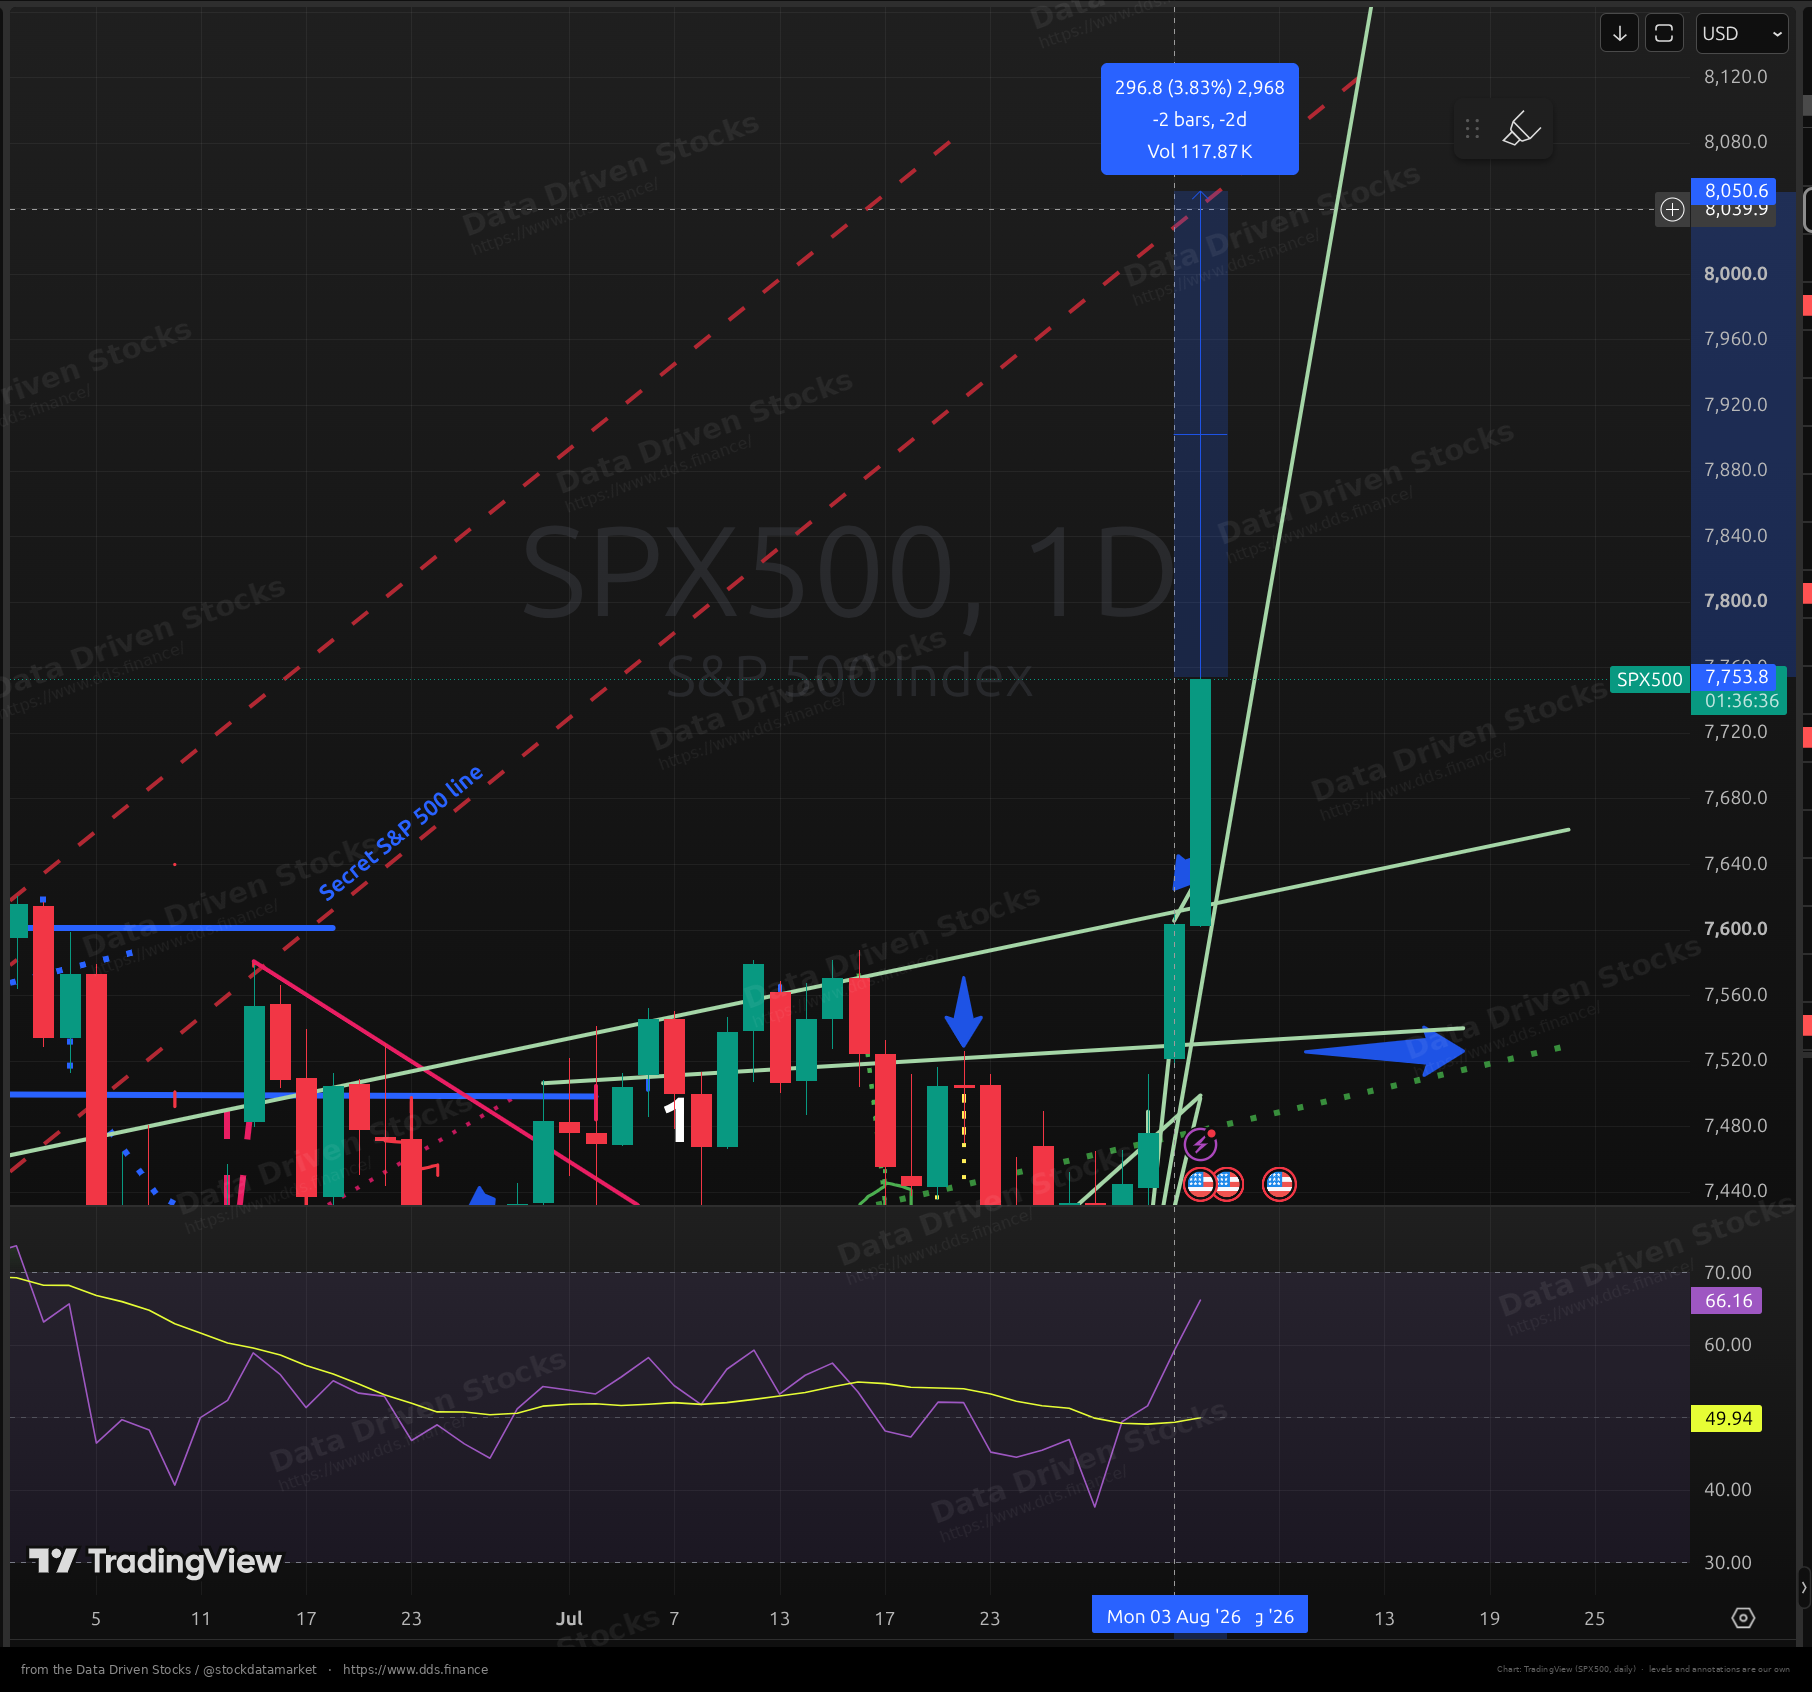
What actually drove it is less flattering. Rather than a wave of new buying, this was a short squeeze: positioning that had been leaning against the index all through July got run over once the record broke, and the covering did the rest. That distinction matters for tomorrow, because squeezes end when the sellers are gone rather than when the buyers get tired. Above here there is no resistance left at all and 8,000 is reachable if the trend holds, but the positioning going into Wednesday is negative, and the more likely outcome is that the trend breaks. Any dip may still get bought back pre-market or at the open, which has been the pattern all week.
The VIX went the wrong way, and that is the signal
Volatility closed at 16.45, up 3.72%, on a day the S&P gained 1.79%. Normally those two move against each other, and the numbers bear that out: over the past two years the daily correlation between S&P and VIX returns is minus 0.819. Intraday today it was plus 0.322.
Or count the comparable sessions. In two years there have been 27 days where the S&P rose more than 1.5%. On exactly one of them did the VIX rise too. Today is the second.
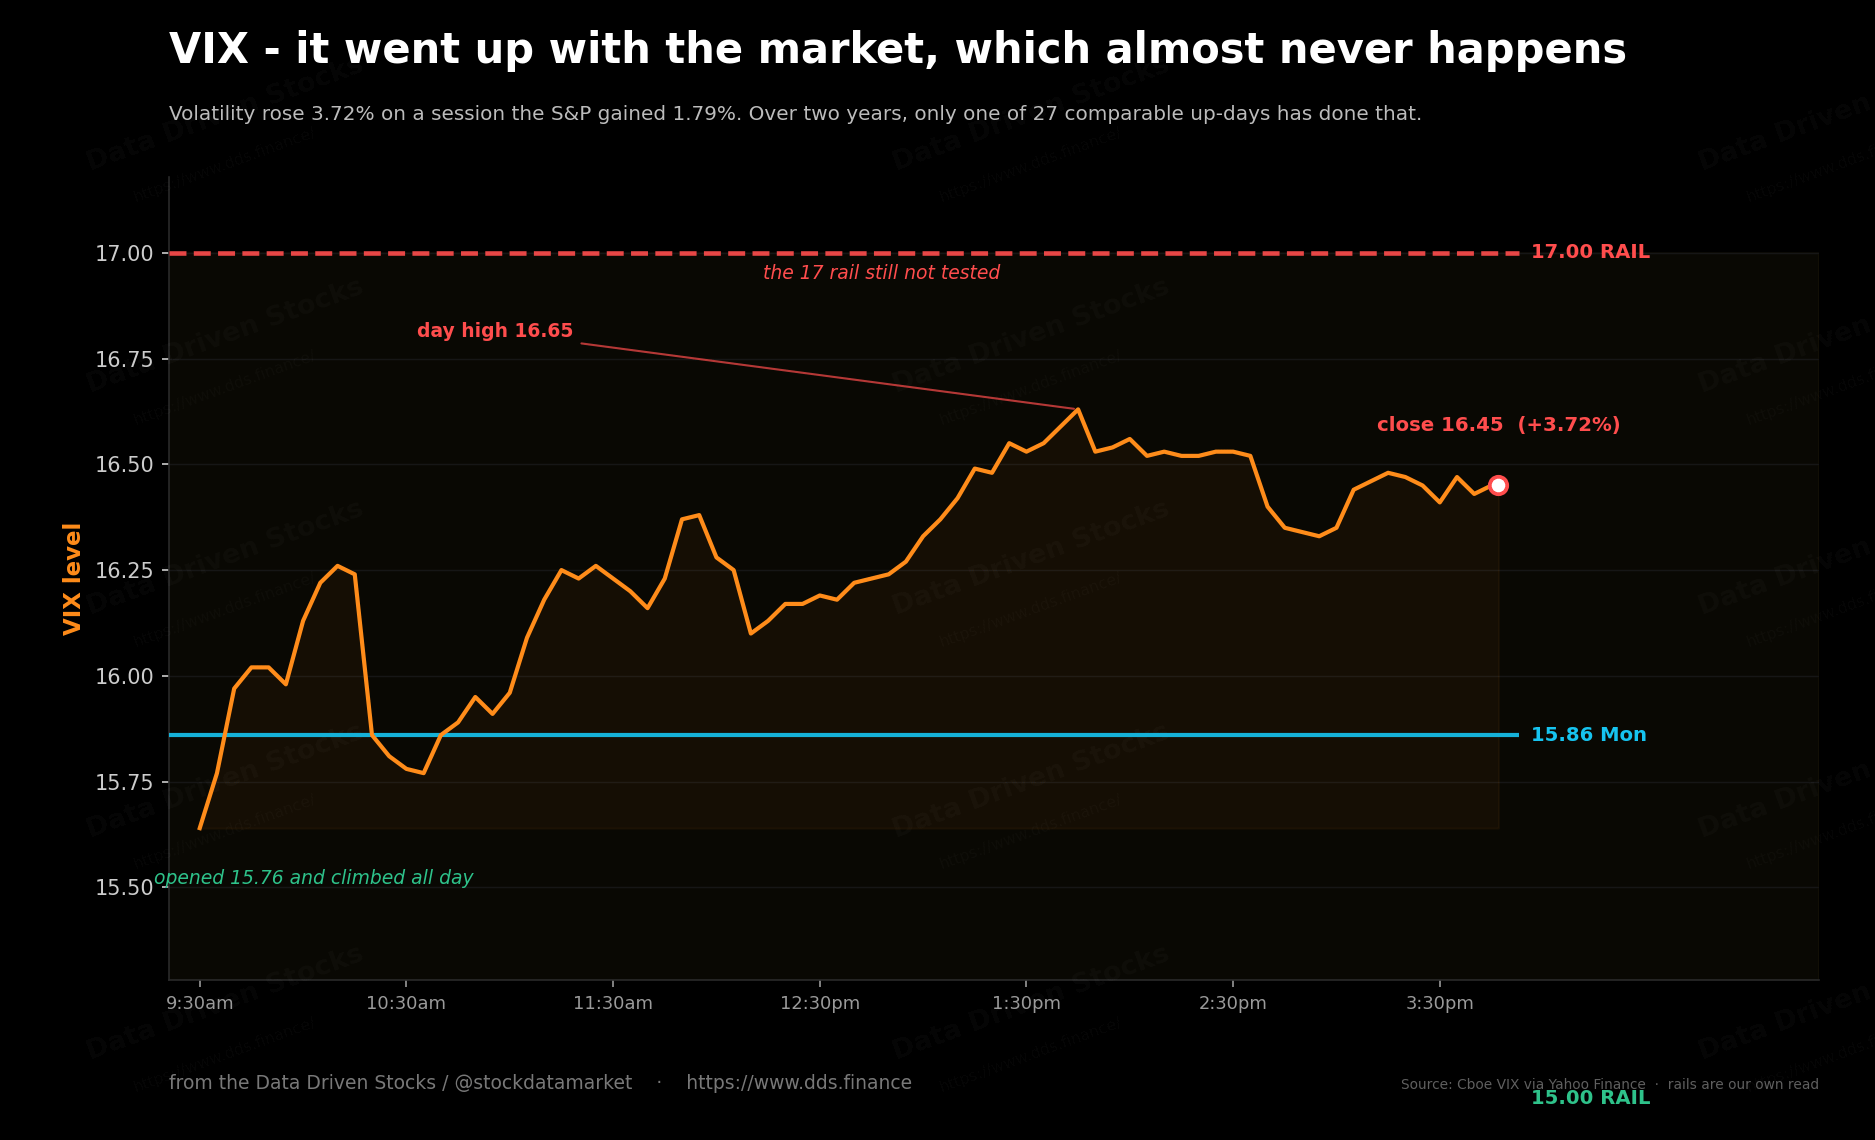
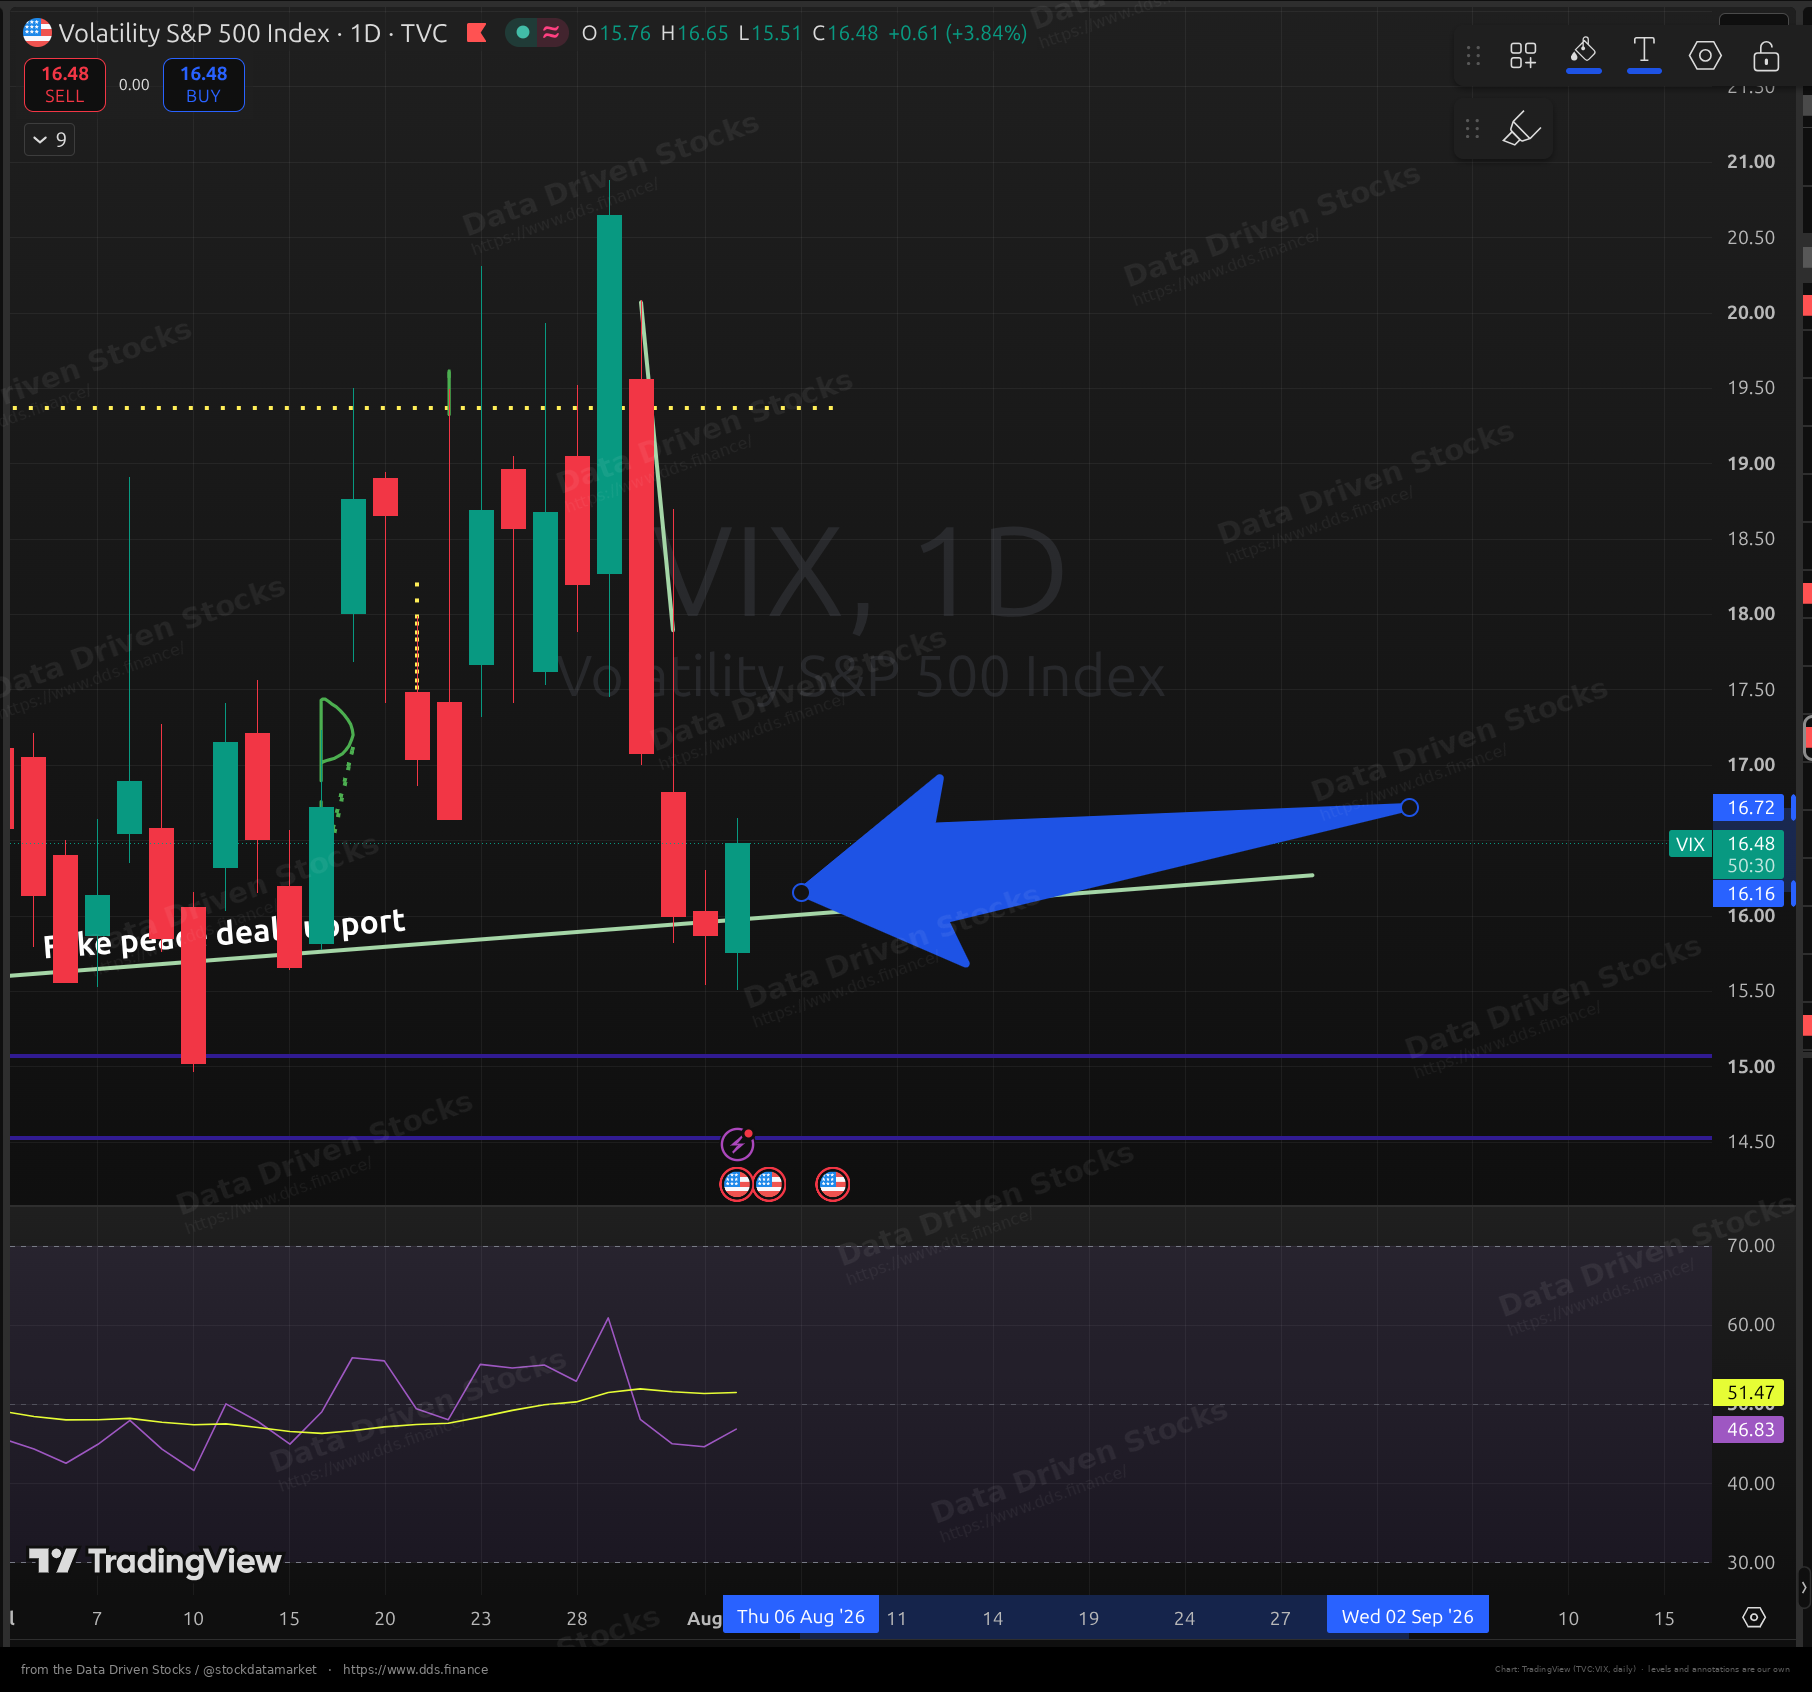
That is what somebody paying up for protection into a rally looks like, and it fits the squeeze reading rather than contradicting it. The 17 rail from this morning’s map still has not been touched, and the 15 rail below was never approached.
The other two indices hit walls
