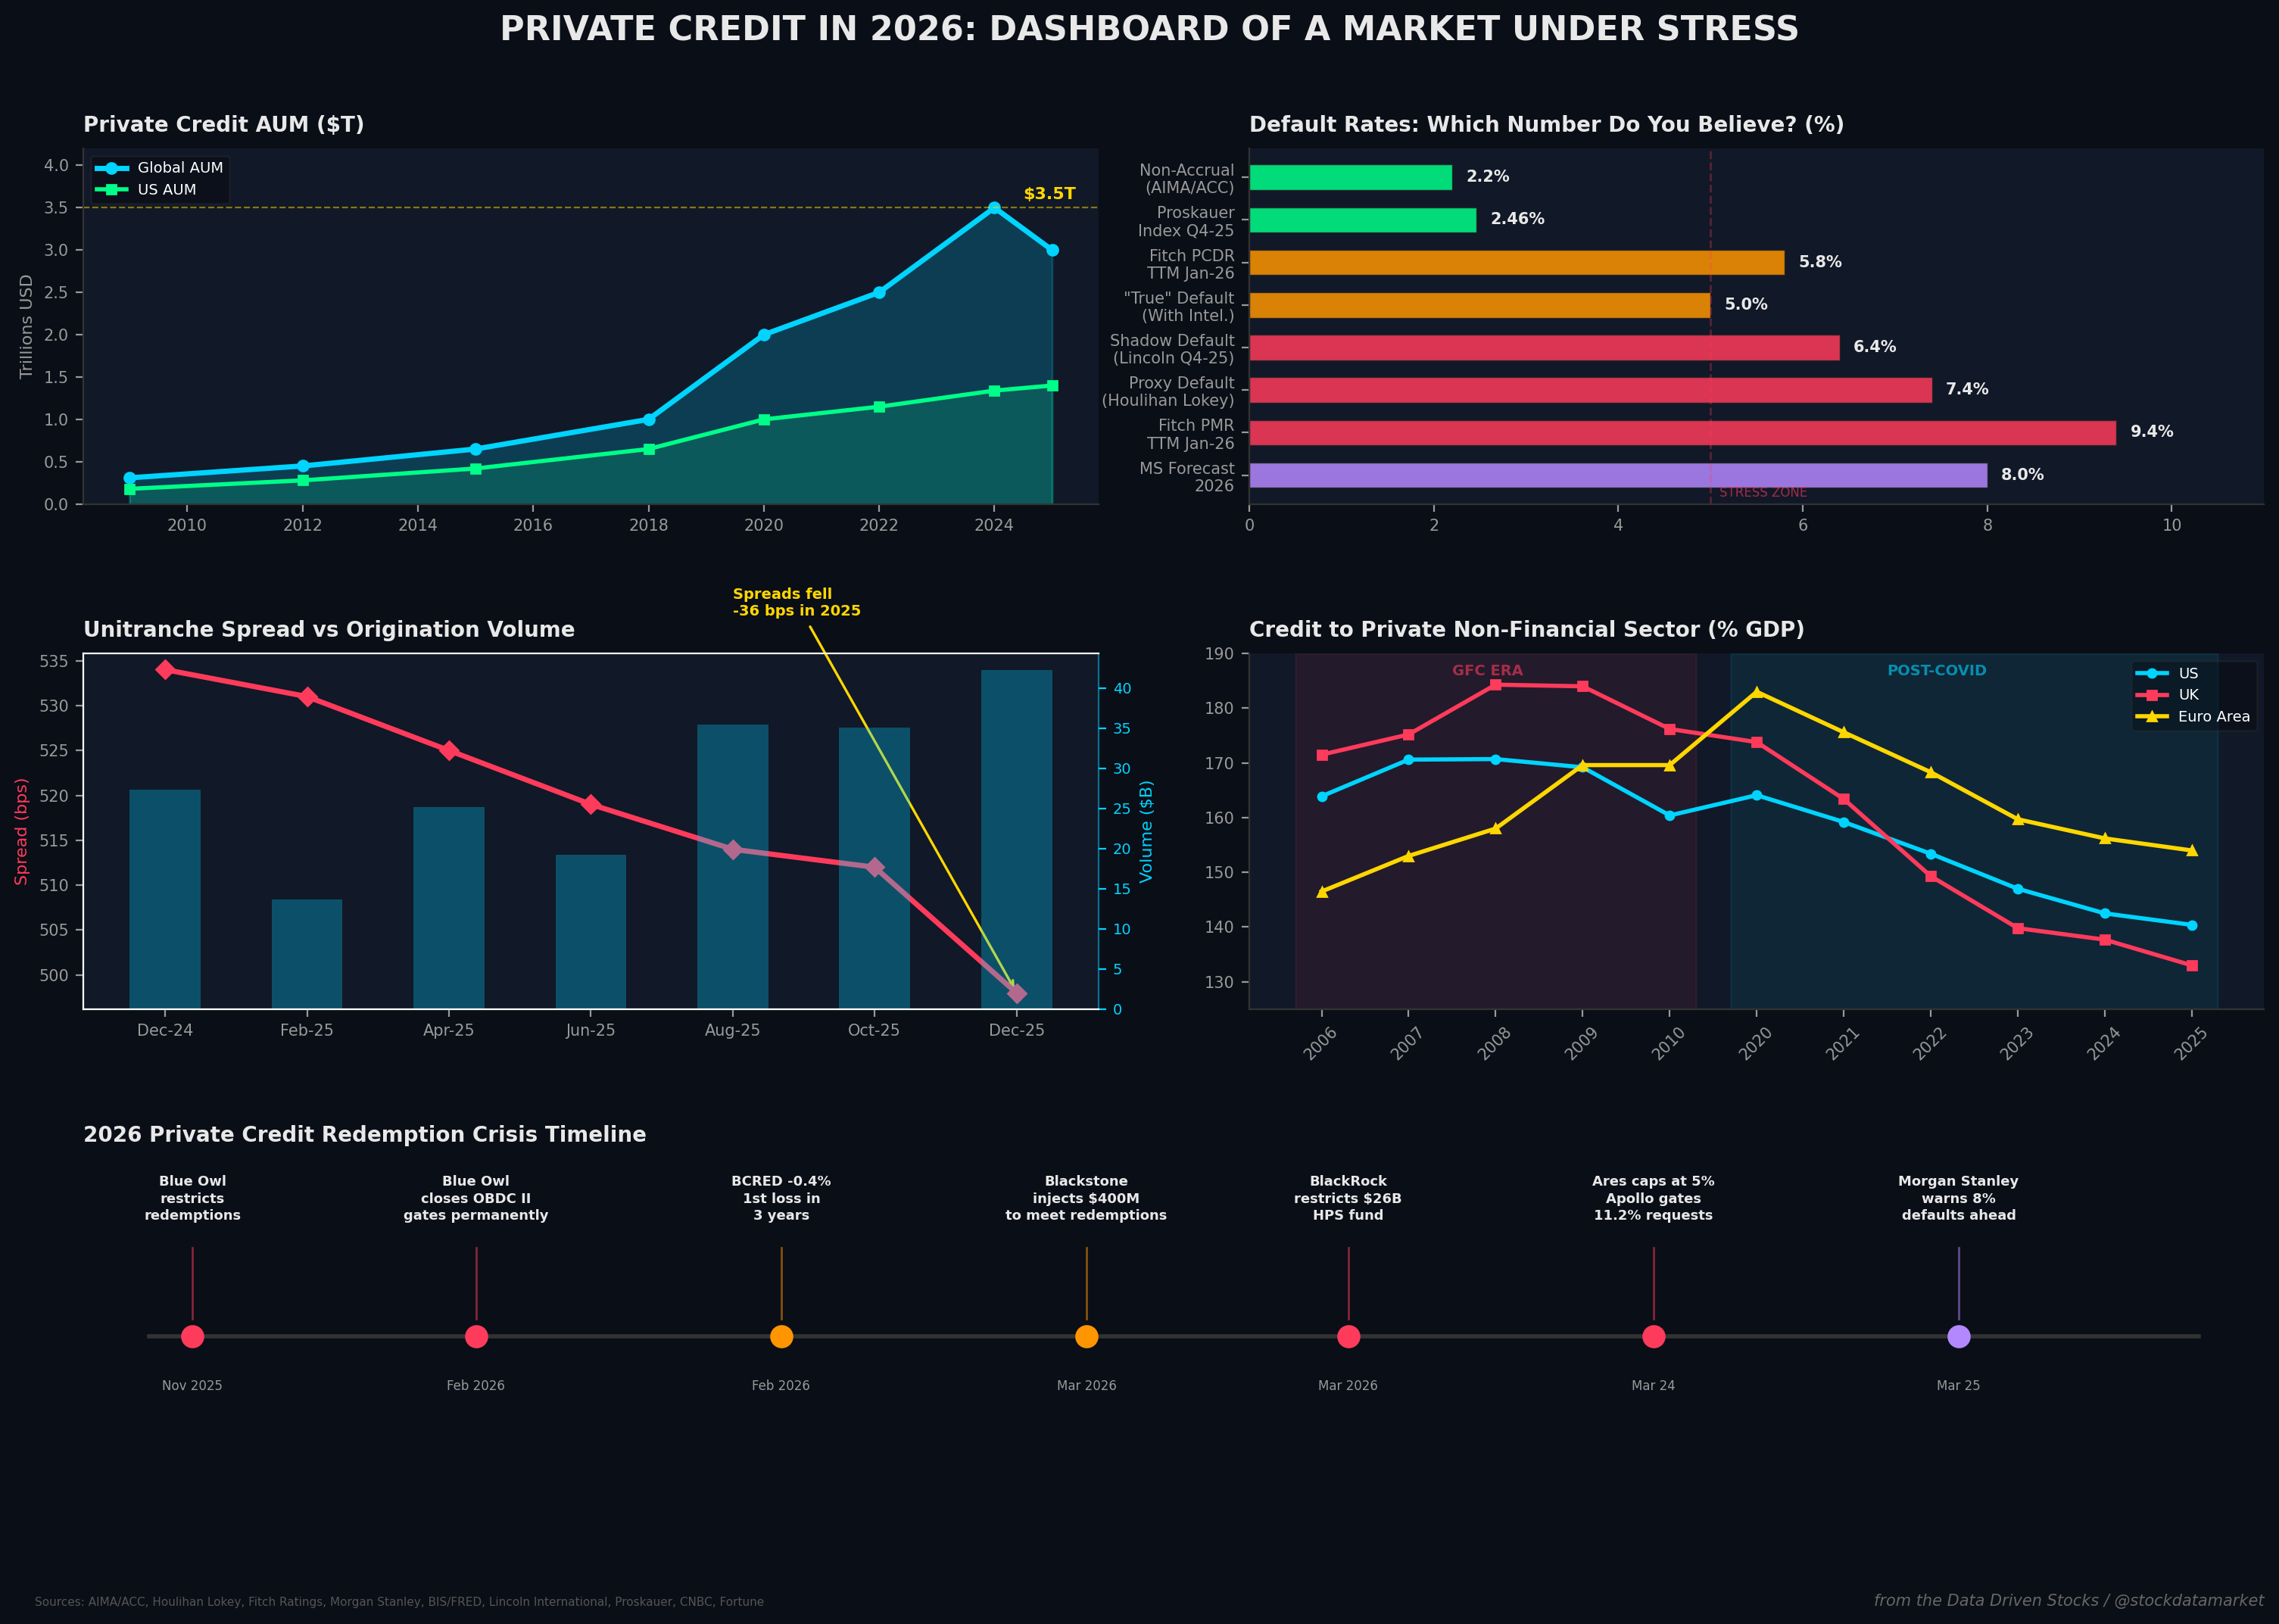
Private Credit 2026 Dashboard - Market Under Stress Private Credit in 2026: The $3.5 Trillion Market That Just Hit a Wall - Is This 2008 All Over Again?
Defaults climbing. Redemption gates slamming shut. Fund managers scrambling. The private credit market is facing its first real stress test - and the comparisons to 2008 are getting louder.

For the better part of a decade, private credit was the darling of institutional finance. Pension funds, sovereign wealth funds, and endowments poured hundreds of billions into the space, drawn by the promise of higher yields, lower volatility, and a pitch that basically boiled down to “it is like lending, but better.” The asset class grew from roughly $200 billion in 2006 to an estimated $3.5 trillion by the end of 2024, according to AIMA’s Alternative Credit Council. That is a 17x expansion in less than twenty years, and most of it happened after 2018.
Now, in the spring of 2026, the music is not exactly stopping - but the tempo has changed dramatically. Default rates are spiking to record levels depending on which number you trust. Investors at Blue Owl, Blackstone, Apollo, and Ares are stampeding toward the exits faster than fund managers can slam the redemption gates shut. Morgan Stanley is warning that defaults could hit 8%. UBS is modeling scenarios where they reach 15%. And the comparisons to the 2008 financial crisis are no longer confined to the fringes of financial Twitter - they are coming from Mohamed El-Erian, the former co-CEO of PIMCO.
So what is really going on? Is private credit the new subprime? Or is this the kind of “healthy reset” that every rapidly growing asset class eventually needs?
Let us dig into the data.
The Rise: How Private Credit Ate the Banking System
The origin story of private credit is inseparable from the wreckage of 2008. When the Global Financial Crisis gutted bank balance sheets and regulators responded with Basel III capital requirements, a massive gap opened in the lending landscape. Middle-market companies - those with revenues typically under $500 million - suddenly found themselves locked out of bank financing. Private credit funds stepped in to fill that void, originating loans directly to these businesses and promising investors something rare in the post-crisis world: attractive, floating-rate yields with minimal volatility.
The U.S. private credit market alone grew from roughly $46 billion in 2000 to approximately $1 trillion by 2023, according to the Boston Federal Reserve. Globally, the picture is even more dramatic. Morgan Stanley frames the market at approximately $2.7 trillion by end-2025 (using gross invested assets including leverage), and projects growth to $3.8 trillion by 2029. AIMA/ACC, using a broader definition that includes originated loans, private debt securities, and mid-market CLOs, estimates global private credit AUM hit approximately $3.5 trillion at end-2024, a 17% increase year-over-year.

The deployment pace tells the story even more vividly. AIMA/ACC survey respondents reported deploying $592.8 billion in new capital during 2024 alone, a 78% jump from the $333.4 billion deployed in 2023. Direct lending now constitutes more than 52% of all private credit AUM, up from just 18% in 2010. What was once a niche corner of alternative investments is now financing more than 80% of sponsored middle-market deals, according to McKinsey.
And it was not just institutions anymore. The retail investor wave that started around 2021 transformed the market’s structure in ways that are only now becoming painfully apparent. The share of private credit assets held by retail and mass-affluent investors grew to 24% of AUM, according to AIMA/ACC data. Retail credit fund assets ballooned from $34 billion at the end of 2021 to $222 billion by end-2025, fueled by nearly $200 billion in inflows over that five-year stretch. The industry sold these products as safe, stable yield machines. For a while, the pitch seemed bulletproof.
The Cracks: A Default Rate Spectrum from 1.5% to 15%
Here is where things get genuinely messy, and where the private credit story diverges most sharply from traditional fixed income. The default rate in private credit depends entirely on how you define “default” - and the industry has not settled on a standard definition. The Financial Stability Board explicitly documented this problem in its 2025 NBFI monitoring report: jurisdictions do not have a standard definition of private credit in statistical or regulatory reporting, complicating any attempt at consistent measurement.
At the benign end of the spectrum, BDC non-accrual rates have hovered around 1-2% over the past four years, and AIMA/ACC reports flagship corporate lending funds’ non-accrual at approximately 2.2% on average. The Proskauer Private Credit Default Index, which tracks senior-secured and unitranche loans, registered 2.46% for Q4 2025 - a notable uptick from 1.84% in Q3 and 1.76% in Q2, but still in the low single digits.
Now step outside the headline numbers and the picture darkens fast.

Fitch Ratings’ Private Credit Default Rate (PCDR) climbed to 5.8% on a trailing-twelve-month basis through January 2026, up from 5.6% in December 2025 - the highest since the index’s inception in August 2024. The privately monitored rating component of that index hit 9.4%. Lincoln International’s “shadow default rate” - measuring the share of companies carrying problematic payment-in-kind (PIK) arrangements - more than doubled from 2.5% in Q4 2021 to 6.4% by Q4 2025. And AIMA/ACC’s own “proxy default” metric, which counts payment defaults, covenant defaults, and amended PIK conversions together, stood at 7.4% as of September 2025.
The mechanism that makes this so tricky is PIK. In traditional lending, a borrower that cannot pay its interest in cash is in trouble. In private credit, lenders can convert that unpaid interest into additional loan principal - the borrower does not technically default, but the debt pile grows larger and the eventual reckoning gets pushed further into the future. This is the financial equivalent of putting a minimum payment on your credit card and pretending you are not in debt. With Intelligence estimates the “true” default rate at approximately 5% when these maneuvers are factored in.
“An 8% default rate takes private credit from a ‘zero loss’ fantasy to a more normal credit asset class - painful in spots, but ultimately a healthy reset that frees up capital for stronger businesses.”
Sunaina Sinha Haldea, Global Head of Private Capital Advisory, Raymond James (via CNBC, March 2026)
And then there is the forward-looking view. Morgan Stanley analysts, led by strategist Joyce Jiang, warned in mid-March 2026 that direct lending default rates could reach 8%, approaching COVID-era peak levels. The primary catalyst? AI disruption in the software sector, which happens to be the single largest sector exposure in many of the largest private credit funds. UBS went further, modeling a “rapid, severe AI disruption” scenario that could push defaults to 15%.
The Late-Cycle Signal: Spreads Collapse While Volume Surges
If you have spent any time around credit markets, you know this story. It is the late-cycle playbook that has repeated before every major credit event: lenders compete aggressively for deals, spreads compress, documentation loosens, and volumes surge as everyone tries to deploy capital before the window closes. The data from Houlihan Lokey’s January 2026 newsletter shows this dynamic playing out in textbook fashion.
Total new US private credit issuance hit $327 billion in 2025, topping the prior record of $302 billion set in 2024. December 2025 alone saw approximately $42.2 billion in origination volume - a single-month record. And while volumes were surging, the price lenders were getting paid for that risk was collapsing. Unitranche spreads fell from 534 basis points in December 2024 to 498 bps by December 2025, a 36-basis-point compression in twelve months. The all-in yield on unitranche loans dropped to 9.33% in December 2025, down 308 basis points from the July 2023 peak of 12.41%.

What makes this particularly concerning is the context. Total leverage on new deals remained stubbornly elevated around 4.7x-4.9x throughout 2025. So borrowers were not deleveraging to justify the tighter pricing - lenders were simply accepting less compensation for roughly the same level of risk. The IMF and FSB have both flagged this pattern as a vulnerability, noting that capital deployment pressure and covenant weakening tend to precede weaker underwriting outcomes later in the cycle.
Meanwhile, covenant-lite structures continued their decade-long march through the leveraged loan market. Dallas Fed data shows cov-lite loans rose from approximately one-fifth of total leveraged loans in 2007 to more than 86% of outstanding volume by 2021, with over 90% of new issuance carrying incurrence-only covenants. The accessible public data for this metric runs dry after 2021, creating a frustrating gap for 2022-2026 trend analysis. But given the deployment pressure and competitive dynamics, few market participants believe documentation quality has improved since then.
The Macro Backdrop: Where Is All the Leverage?
One of the most counterintuitive aspects of the current situation is that the aggregate credit picture looks nothing like 2008. The BIS “credit to private non-financial sector” data, available through FRED, shows that economy-wide leverage has actually declined significantly since the financial crisis.

US credit to the private non-financial sector stood at 140.4% of GDP as of Q3 2025, down sharply from the 170.7% peak during the GFC. The UK shows an even more dramatic decline - from 184.3% at the 2008 peak to 133.0% by Q3 2025. The Euro area peaked at 183.0% in 2020 and has since fallen to 154.0%.
This is critical context. The rise of private credit is not being driven by an economy-wide leverage boom like the one that preceded 2008. Instead, it reflects what might be called a “credit-channel re-plumbing” - a structural shift in who is doing the lending, from banks to nonbanks, from public markets to private vehicles. The aggregate credit pie has been shrinking relative to GDP even as the private credit slice has been growing dramatically within it. This distinction matters enormously when assessing systemic risk.
The Plumbing Problem: Banks, BDCs, and Hidden Interconnections
If private credit is not creating a new aggregate leverage bubble, then where does the systemic risk actually live? The answer, according to the Fed, the IMF, and the FSB, is in the plumbing - specifically, the complex web of interconnections between banks and nonbank private credit vehicles that regulators are only now beginning to map.

The Federal Reserve’s May 2025 FEDS paper revealed that the largest US banks have extended approximately $95 billion in credit lines to private credit vehicles, and this figure likely understates the true exposure since it does not cover all banks. The research showed that BDC reliance on bank credit lines grew sharply after the 2022 tightening cycle, meaning that private credit’s independence from the banking system is partly an illusion. When private credit funds need liquidity - say, to meet redemption requests - they draw on bank-provided credit lines. If dozens of funds draw simultaneously, it creates what one researcher described as a potential “liquidity vacuum” that could propagate back into the banking system.
The IMF’s Global Financial Stability Report highlights four specific vulnerabilities: fragile borrowers whose cash flows cannot support floating-rate debt in a high-rate environment, stale valuations that mask true portfolio deterioration, leverage layering across multiple levels of the capital structure (fund leverage, portfolio company leverage, warehouse lines, NAV facilities), and semi-liquid vehicle structures that promise redemption rights the underlying assets cannot easily support. The FSB reinforces the point about opacity, noting that its own member jurisdictions struggle to distinguish between loan origination and secondary acquisition by nonbanks - making even basic measurement of the market’s true size and risk profile difficult.
March 2026: The Redemption Crisis Unfolds
All of these structural vulnerabilities converged into a live stress test in the first quarter of 2026, and it has been dramatic to watch in real time.
The trigger was Blue Owl Capital, which in November 2025 restricted withdrawals from one of its tech-focused private credit funds. By February 2026, Blue Owl took the unprecedented step of permanently closing redemption gates on its $1.6 billion OBDC II fund after investor withdrawal requests surged. The firm’s stock entered an 11-day losing streak - its longest ever - erasing roughly 60% of market value over a 13-month period.
$10B+ - Redemption requests in Q1 2026 across major managers
$265B - Market cap wiped from alt managers
5% - Redemption cap imposed by most funds
Then contagion spread. Blackstone’s flagship BCRED fund posted a 0.4% loss in February - its first monthly decline in three years - as it marked down loans including debt tied to SaaS company Medallia. Blackstone took the extraordinary step of injecting $400 million from its own capital and senior executives to satisfy $3.8 billion in redemption requests. BlackRock restricted withdrawals on its $26 billion HPS Lending Fund. Cliffwater’s $33 billion flagship fund saw redemption requests of 14%, capped at 7%.
The most recent wave hit just yesterday. Ares Management capped redemptions on its $10.7 billion Strategic Income Fund at 5% after clients sought to pull 11.6%. Apollo imposed the same cap on its $15.1 billion Debt Solutions BDC after 11.2% in redemption requests. At one point on Tuesday, the jitters wiped out $10.2 billion in market cap across Ares, Apollo, Blackstone, and KKR in a single trading session.

Goldman Sachs analysts now predict the retail private credit sector could shed between $45 billion and $70 billion in assets over the next two years, reversing the explosive growth that defined the space from 2021 to 2025. Investment in non-traded BDCs was already down approximately 43% last month compared to the year prior.
2008 vs 2026: The Comparison That Everyone Is Making
It is the comparison that keeps surfacing in every conversation about private credit right now: is this 2008 all over again? Mohamed El-Erian has drawn parallels to the early stages of the financial crisis. The SEC has launched investigations into valuation practices. The Federal Reserve and FSOC have formed a “Market Resilience Working Group.” The pattern of opaque structured products sold to retail investors as safe yield instruments - and now blowing up when liquidity dries up - certainly rhymes with subprime.
But the data tells a more nuanced story.

The most important structural difference is leverage. In 2008, the investment banks at the center of the crisis were running at 30-40x leverage. Today, AIMA/ACC estimates aggregate private credit fund leverage at approximately 32% of net AUM, with weighted-average leverage at approximately 43% of NAV for flagship corporate lending funds. That is not even in the same universe as 2008’s leverage ratios. As one market participant put it, there was “a lot of leverage on similar type assets that had full recourse to whoever owned them” in 2008 - that specific dynamic does not exist in private credit today.
The contagion mechanism is also fundamentally different. In 2008, bank balance sheets were directly loaded with toxic assets, and counterparty risk (think AIG) created cascading failures. In 2026, the linkage is indirect: banks provide credit lines to BDCs and private credit funds, but the assets themselves sit in separate vehicles. A private credit fund blowing up hurts its investors, but the path to systemic contagion requires a much more specific chain of events - namely, simultaneous drawdowns on bank credit lines creating a liquidity crunch.
That said, there are dimensions where 2026 looks arguably worse than the pre-GFC setup. The sheer size of the private credit market ($3.5 trillion globally versus $1.3 trillion in subprime MBS at its peak) means the potential for losses is enormous even if the percentage default rate stays below GFC levels. The opacity of the market - the FSB’s point about no standard definitions - is in some ways more concerning than the pre-2008 environment, where at least rating agencies were attempting (badly) to assess risk. And the retail exposure, while proportionally smaller than in 2008, represents a cohort of investors who were explicitly told these products were safe and stable, and who are now discovering what “illiquid” actually means.
So Is Private Credit in Trouble?
The honest answer is: it depends on what you mean by “trouble.”
If you mean “is the private credit market going to cause a 2008-style systemic financial crisis,” the data strongly suggests no. The leverage is lower. The contagion channels are narrower. Most private credit capital remains in traditional closed-end structures backed by institutional investors with long time horizons, not retail investors demanding quarterly liquidity. Nicolas Roth, head of private markets advisory at UBP, characterized the current situation as the first real liquidity test for the asset class “at scale” - a description that implies growing pains rather than existential threat.
If you mean “are a lot of people going to lose money,” the answer is almost certainly yes. An 8% default rate - Morgan Stanley’s base case - translates to tens of billions of dollars in losses across the $3.5 trillion market. The funds concentrated in AI-vulnerable software, healthcare roll-ups, and covenant-lite structures are going to feel the most pain. Retail investors in semi-liquid vehicles who expected bond-like stability are in for a rude awakening. And the alternative asset managers whose stock prices have been built on the narrative of unstoppable private credit growth are being violently repriced.
If you mean “is this healthy in the long run,” there is a reasonable argument that it is. The “zero-loss fantasy” that surrounded private credit - the idea that you could earn 10%+ yields with no defaults and no volatility - was always unsustainable. The market grew too fast, deployed too aggressively, and sold liquidity promises it could not keep. A period of rising defaults, tighter underwriting, and forced repricing of risk might be exactly what the asset class needs to mature into a more honest version of itself.
The data, in the end, does not support the most apocalyptic narratives. But it does not support the most complacent ones either. Private credit in 2026 is a $3.5 trillion market undergoing its first real stress test, and the fact that nobody can agree on whether the default rate is 2% or 9% tells you everything you need to know about how much opacity remains in a space that now touches pension funds, retail portfolios, bank balance sheets, and the real economy in ways that were unimaginable a decade ago.
Watch the redemption gates. Watch the bank credit lines. And pay very close attention to which numbers the industry chooses to show you - because in private credit, the gap between the headline and the reality has never been wider.
Sources
[1] AIMA/Alternative Credit Council, “Financing the Economy 2025,” published in partnership with Houlihan Lokey, 2025. https://www.aima.org/asset/E18BF558-90F4-4551-9D3FC002B498AFC4/
[2] Houlihan Lokey, “US Private Credit Market Newsletter,” January 2026. https://cdn.hl.com/pdf/2026/hl-us-private-credit-market-newsletter-january-2026.pdf
[3] Fitch Ratings, “U.S. Private Credit Default Rate Continues Upward March to 5.8% in January 2026,” February 23, 2026. Reported via Funds Society: https://www.fundssociety.com/en/news/alternatives/u-s-private-credit-default-rate-continues-to-climb/
[4] Morgan Stanley, “Evolution of Direct Lending,” 2026. https://www.morganstanley.com/im/publication/insights/articles/article_evolutionofdirectlending.pdf
[5] Morgan Stanley analysts (Joyce Jiang et al.), “Private Credit Default Rates to Reach 8%,” reported by Bloomberg, March 16-17, 2026.
[6] IMF, “Global Financial Stability Report, Chapter 2: The Rise and Risks of Private Credit,” April 2024. https://www.imf.org/-/media/files/publications/gfsr/2024/april/english/ch2.pdf
[7] Financial Stability Board, “Global Monitoring Report on Non-Bank Financial Intermediation 2025.” https://www.fsb.org/uploads/P161225.pdf
[8] Federal Reserve, “Financial Stability Report,” November 2025. https://www.federalreserve.gov/publications/files/financial-stability-report-20251107.pdf
[9] Federal Reserve FEDS Paper, “Bank Lending to Private Credit: Size, Characteristics, and Financial Stability Implications,” May 2025. https://www.federalreserve.gov/econres/feds/files/2025059pap.pdf
[10] Bank of England, “Financial Stability Report,” December 2025. https://www.bankofengland.co.uk/-/media/boe/files/financial-stability-report/2025/financial-stability-report-december-2025.pdf
[11] BIS, “Credit to the Non-Financial Sector” via FRED. US series: QUSPAM770A; Euro Area: QXMPAM770A; UK: QGBPAM770A.
[12] Boston Federal Reserve, Policy Perspectives on Private Credit, 2025.
[13] McKinsey, “The Next Era of Private Credit,” 2024. Referenced in CIB Report 2026.
[14] Proskauer Rose LLP, “Private Credit Default Index: Q4 2025,” January 26, 2026. https://www.proskauer.com/report/proskauers-private-credit-default-index-reveals-rate-of-246-for-q4-2025
[15] Lincoln International, “Private Market Index,” Q4 2025 data. Reported via Fortune, February 22, 2026. https://fortune.com/2026/02/22/private-credit-market-shadow-default-rate-deals/
[16] With Intelligence, “Private Credit Outlook 2026: The Market Faces its First Big Test,” March 2026. https://www.withintelligence.com/insights/private-credit-outlook-2026/
[17] CNBC, “Private credit’s ‘zero-loss fantasy’ is coming to an end as defaults and fund exits rise,” March 25, 2026. https://www.cnbc.com/2026/03/25/private-credit-defaults-loan-quality-debt-risk-systemic-ai-disruption.html
[18] Fortune, “The $265 billion private credit meltdown,” March 14, 2026. https://fortune.com/2026/03/14/private-credit-meltdown-how-wall-streets-blackstone-kkr-apollo-ares-blue-owl-investment-craze-panic/
[19] Orange County Register / Bloomberg, “Ares, Apollo cap private credit fund withdrawals as exodus grows,” March 24, 2026. https://www.ocregister.com/2026/03/24/ares-apollo-cap-private-credit-fund-withdrawals-as-exodus-grows/
[20] PitchBook/LCD, “US Private Credit Monitor,” January 2026.
[21] Dallas Federal Reserve, analysis on covenant-lite leveraged loan trends, 2007-2021.
[22] Preqin, “Alternatives in 2025” outlook report, private debt fundraising data through Q3 2024.
[23] UBS Group AG strategists, AI disruption scenario analysis for private credit defaults (15% severe scenario), reported by Bloomberg, February 2026.
[24] Goldman Sachs, retail private credit sector outflow projections ($45-70B over two years), reported via Financial Times and Ryxel, March 2026.
[25] New York Federal Reserve, “NBFIs in Focus: The Basics of Private Credit,” October 17, 2025. https://tellerwindow.newyorkfed.org/2025/10/17/nbfis-in-focus-the-basics-of-private-credit/
[26] Bloomberg, “Blue Owl Redemptions Halt Intensifies Private Credit Fears,” February 22, 2026.
[27] Bloomberg, “Morgan Stanley Limits Redemptions on Private Credit Fund,” March 11, 2026.

