Prices Are Rising Fast In Europe Again - And This Time The Math Doesn’t Work
The March EU's Inflation HICP print wasn’t a blip. It was the first month of a regime change that the consensus is still pricing as transitory. Here is the data.
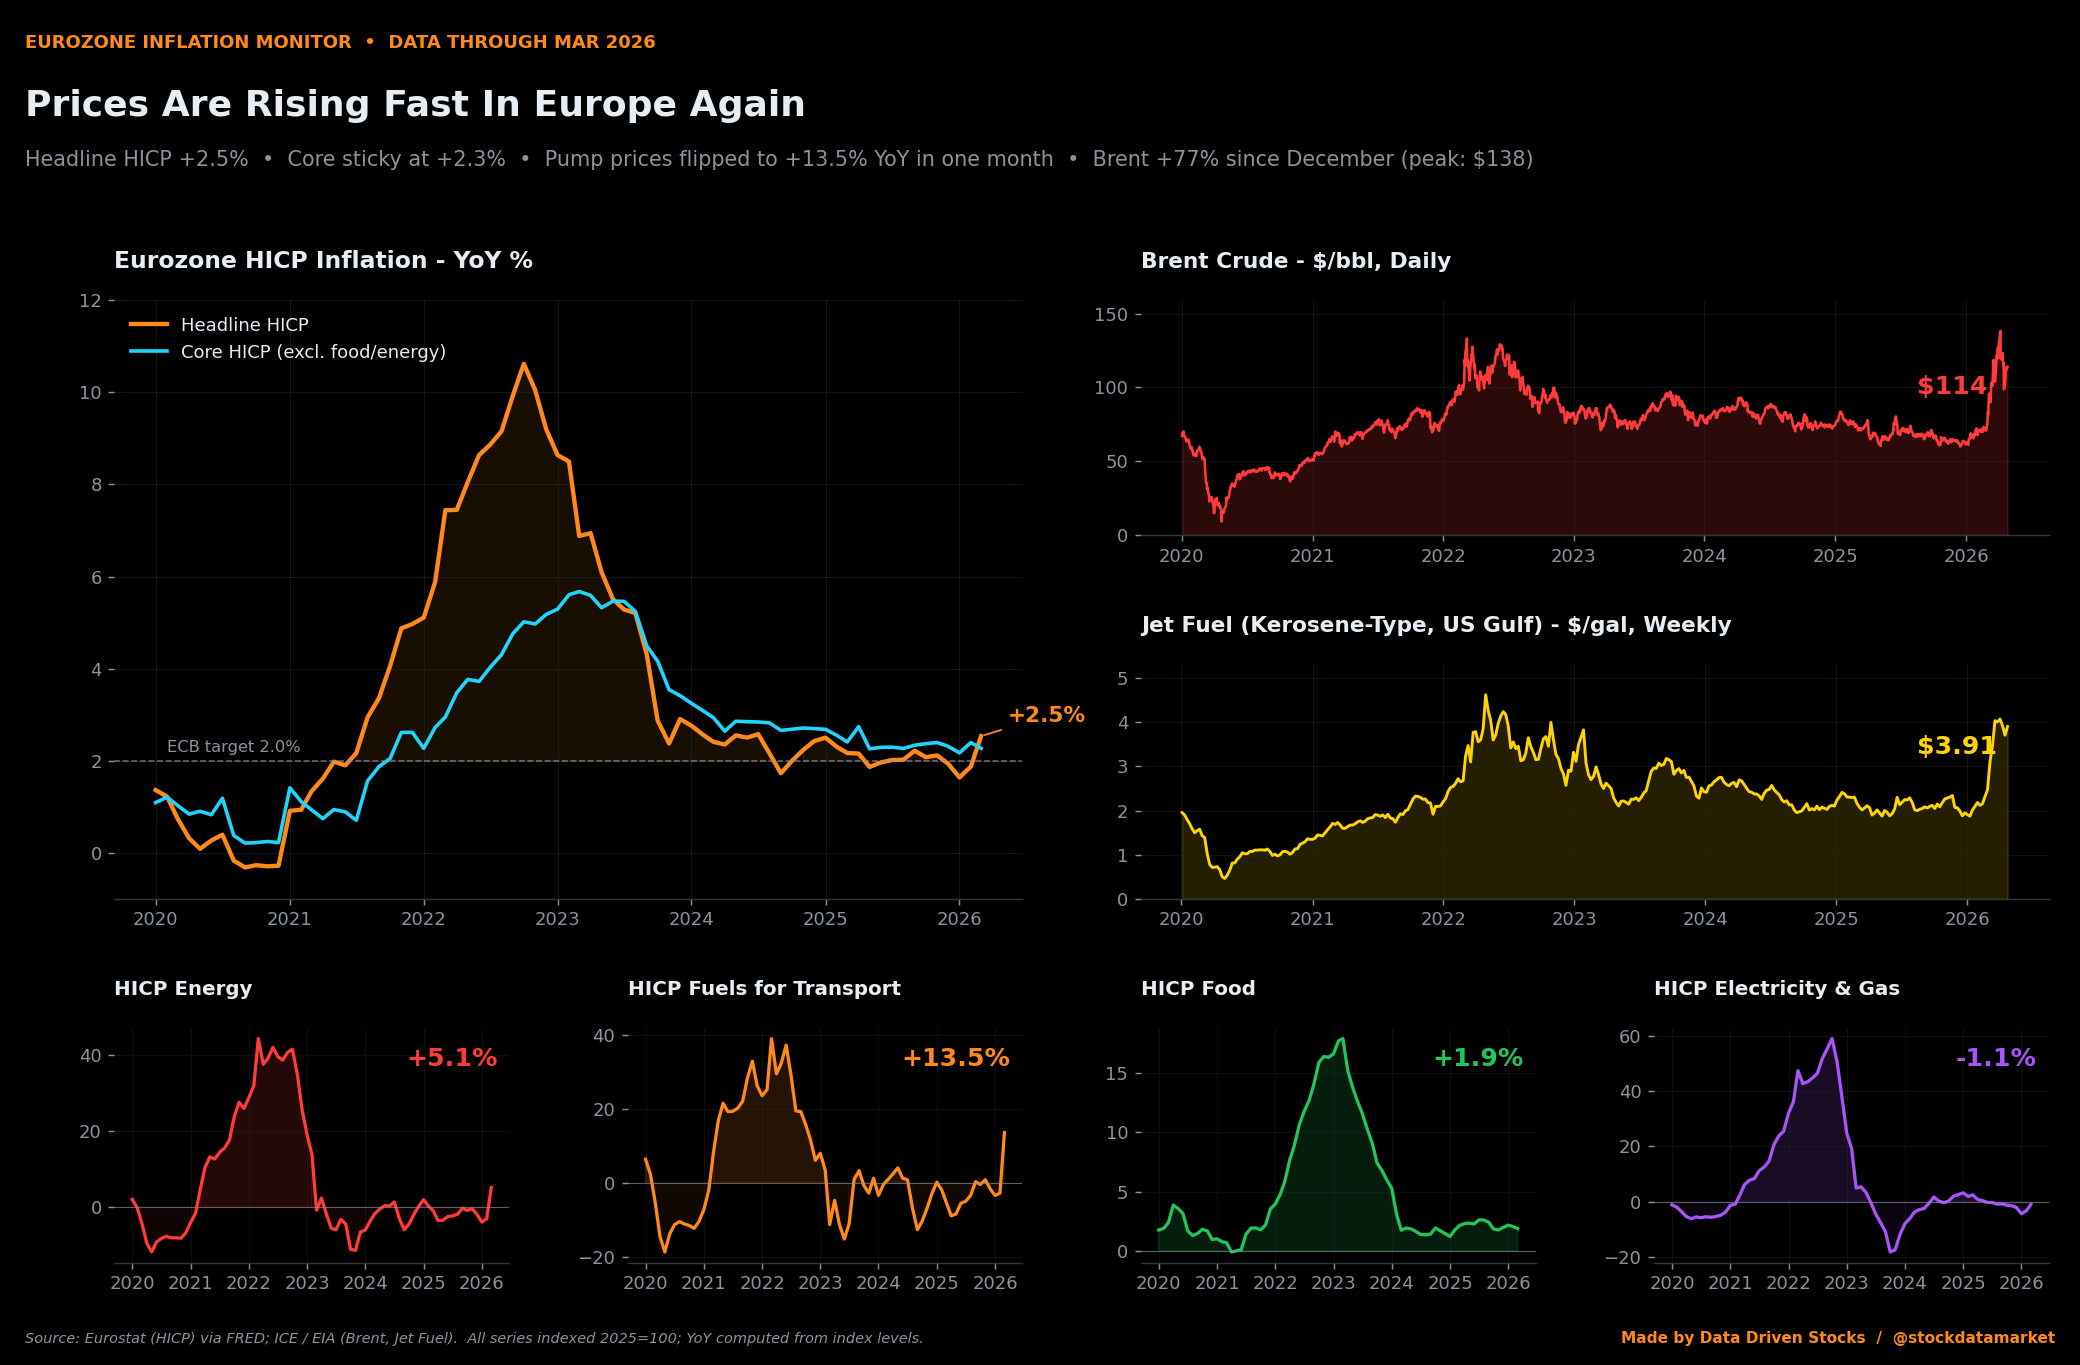
For eighteen months the consensus story on Europe was that inflation had been beaten. Headline HICP had been hovering around the ECB’s 2% target since late 2024. Energy was deflationary. Food had moderated. The disinflation cycle had worked. The ECB was even getting credit in op-eds. December 2025 staff projections had headline inflation falling further to 1.9% in 2026 and 1.8% in 2027 before drifting back to target. Markets priced cuts. Bunds rallied. Everyone moved on.
Then March happened.
Eurozone HICP just re-accelerated to +2.5% year-on-year, later revised by Eurostat to 2.6%. The April flash printed 3.0%, the highest reading since September 2023. The ECB’s March 2026 staff projections, finalised on March 13, raised the 2026 forecast from 1.9% all the way to 2.6%. That is not a marginal revision. That is the central bank publicly admitting that its base case three months ago was wrong, and the new base case still might be wrong on the low side because the energy assumptions are dated.
Most of financial Twitter is still treating this as a one-off energy shock that the ECB will rightly look through. That framing has a problem. The 2022-2023 oil shock took exactly nine months from Brent peak to core HICP peak. The current oil shock peaked in early April 2026. If history runs to script, core inflation crests in early 2027 - and core was already stuck above target before the shock even started.
Below, the chain in detail.
What actually happened in March
Eurozone headline HICP went from +1.6% YoY in January to +1.9% in February to +2.5% in March. The flash estimate was revised up to 2.6% in the final release on April 16. The April flash hit 3.0%, with energy alone contributing +10.9% YoY - the highest energy print since February 2023. This is not a slow grind. This is a step change.

The arithmetic of why this happened is unambiguous. Energy is roughly 9% of the HICP basket in 2026. The energy component swung from -3.2% YoY in February to +5.1% YoY in March - a delta of 8.3 percentage points. Multiply that by the 9% weight and you get a direct contribution of +0.75 percentage points to headline. Headline actually moved +0.66 percentage points. The energy reflation alone explains essentially all of the jump. It is not a story about wages, services stickiness, or fiscal policy. It is a story about a single commodity going up.
Which commodity? Crude oil.
The thing that broke
Brent crude was sitting at $64 a barrel in early December 2025. It traded in a comfortable $60-85 range for almost all of 2024 and 2025. European refiners were happy. Margins were normal. Inventories were healthy. Then the Middle East situation deteriorated, and within ten weeks Brent was at $138 - a clean doubling from the December low and the highest print since the immediate aftermath of the 2022 invasion of Ukraine.

The price has come off the highs - April 27 close was $114 - but it is still 77% above where it sat for most of 2024 and 2025. To get back to the prior trading range would require either a meaningful diplomatic breakthrough in the Middle East, an unexpected recession that crushes demand, or a coordinated supply response from OPEC+. None of those is impossible. None of them is the base case. The forward curve is still pricing oil materially higher than it was at year-end 2025.
Now watch how this propagates.
How an oil shock becomes a grocery bill
The economics of inflation transmission are not mysterious. Oil is the input cost for refined products, which become motor fuels, which become both the price you pay at the pump and the cost of moving everything else around. Diesel powers trucks. Diesel also powers tractors and combines. Natural gas (which moves with oil) is the feedstock for nitrogen fertilizer. Plastic packaging is petrochemical. Refrigerated supply chains run on diesel. Aluminum cans are energy-intensive to produce. Even services prices contain energy embedded in heating and electricity costs for the buildings where the services happen. The chain is mechanical. It is also lagged.

The crucial point that gets missed in the “energy is volatile so we should look through it” framing is that pass-through is non-linear. The ECB’s own working paper by Bobeica et al. (2025) shows that small energy shocks decay quickly and do not leak much into core. Medium shocks leak more. Large shocks leak even more, and they leak further down the supply chain, and they leak into wage demands which then make services inflation sticky for years. The current shock just crossed the threshold from “medium” to “large” by the ECB’s own classification. That is not my opinion. That is in their March 2026 outlook deck.
Stage 3: The pump
This is the most violent number in the entire European inflation file right now. Eurozone HICP for fuels and lubricants for personal transport - the line that maps almost one-for-one to what you pay at the pump - went from -2.9% YoY in February to +13.5% YoY in March. That is a +16.4 percentage point swing in a single month.

Some context for how violent this is. In 2018-2025, the average single-month change in this YoY rate was essentially zero with a standard deviation of about 4 percentage points. The +16.4 ppts swing is roughly a four-sigma event. The previous record for a single-month upward swing was March 2022 at +13.8 ppts, in the immediate aftermath of the Russian invasion. The March 2026 print beats that record. It is the largest single-month positive YoY swing in this series since FRED has data, going back to 2018.
European households felt this within weeks. Spring 2026 driving season is being repriced in real time at every petrol station in the eurozone. The disinflation tailwind from cheap fuel is gone. The new headwind has barely started.
Stage 3 (continued): The runway
Jet fuel doubled. Not approximately doubled - measurably, on the spot market, doubled. Kerosene-type jet fuel at the US Gulf Coast (the global benchmark that European carriers index off) was at $2.02 a gallon in April 2025. As of April 24, 2026 it was at $3.91, a year-on-year increase of 94%.

Airlines hedge a portion of fuel exposure - typically somewhere between 30% and 60% of expected consumption, with rolling tenors of six to eighteen months. They do not hedge twelve straight months of a near-doubling in input cost. The hedge book absorbs some of the shock, but the spot market resets ticket prices and cargo rates faster than the hedge book can re-roll. For European carriers heading into summer 2026 - the peak revenue season - this is a margin event. Lufthansa, Air France-KLM, IAG and Ryanair will all report Q2 numbers that look very different from Q1.
The cargo side moves faster than the passenger side. Air freight rates on the Asia-Europe corridor have already started repricing. Anything that flies through European airspace just got materially more expensive to move. That cost shows up in finished-goods prices three to six months downstream.
Stage 4: The slow burn that hasn’t started yet
Eurozone food HICP is currently at +1.9% year-on-year. That looks reassuring. It is not reassuring. It is just early.

Food has the longest lag of any non-services component in the HICP, because food is downstream of everything. Diesel-powered tractors, gas-derived nitrogen fertilizer, plastic-and-aluminum packaging, refrigerated transport, refrigerated warehousing, refrigerated retail. Plus a layer of fixed-price contracts (typically three to six months) between producers and supermarket chains that delay the pass-through even further. The 2022 oil shock took roughly 9 to 12 months to fully bleed into European food inflation, which is why food HICP peaked at +18% YoY in March 2023, a full year after Brent peaked.
The current oil shock is two months old. The food line is the dog that has not barked yet. If the historical lag holds, the food contribution to headline HICP starts moving meaningfully higher in Q3 2026 and peaks somewhere in Q1-Q2 2027. That is not a forecast. That is just timing the same chain that played out four years ago.
Stage 4 (continued): The household bill
Electricity, gas and other household fuels in the HICP have been in deflation for months. In January they printed -4.4% YoY - genuine, real deflation that was helping the headline number look benign. By March that had narrowed to -1.1%. The total energy component (which includes pump fuels) flipped to +5.1% YoY, the first positive print since February 2025.

The mechanics of how this turns into utility bills depend on national regulation - Germany’s gas pricing is different from France’s nuclear-heavy electricity grid is different from Italy’s mixed system. But the direction is uniform. The deflationary tailwind from cheap household energy that helped 2024 and 2025 inflation prints look tame is in the process of disappearing. The next twelve months will look very different on the gas and electricity statement, and on the wholesale futures curves that lock in tariffs for the following year.
This matters for the consumer-spending side of the European economy. Cheap utility bills in 2024-25 effectively functioned as a real-income transfer to households, supporting consumption. That transfer is now being clawed back, just as ticket prices, food contracts and pump prices are all going up. Real disposable income is going to feel the squeeze before nominal wages adjust.
The argument that everyone is going to make
The pushback writes itself. Energy is volatile, the ECB should look through it, this is a supply shock not a demand shock, mechanical pass-through has been overstated by hawks for two cycles in a row. All defensible. All have a rebuttal.
The rebuttal is core inflation.

Eurozone core HICP - which strips out food and energy precisely so we can see the underlying signal - has been pinned in a tight range of +2.2% to +2.4% for nine straight months. The disinflation that everyone celebrated in 2024 stopped happening in mid-2025. Core never actually got back to 2%. Services inflation is running at +3.2%, with negotiated wages and ECB compensation per employee both elevated (Q4 2025 compensation per employee was +3.7%). The “transitory” interpretation requires you to believe that this stuck core was a coincidence about to resolve on its own, and that a fresh four-sigma energy shock layered on top of it will somehow not produce second-round effects.
The ECB’s own scenario analysis, published on March 13, contradicts that. The adverse scenario adds +0.9 percentage points to 2026 headline inflation. The severe scenario adds +1.8 percentage points in 2026 and remains 2.8 ppts above baseline in 2027 with a meaningful effect on core (HICPX) of more than 1 percentage point in 2027-28. Even the baseline already raised 2026 inflation from 1.9% to 2.6%. The ECB knows. They put it in writing.
What the data actually says about timing
Two empirical anchors are worth keeping in mind. First, in the 2022-2023 cycle, Brent crude peaked monthly average at $123 in June 2022. Core HICP peaked at +5.7% in March 2023. The lag from oil peak to core peak was exactly nine months. Second, the same energy series that just spiked +8.3 ppts in March 2026 had its only larger single-month positive swing in March 2022, when it printed +12.4 ppts in one month. That was followed by 18 consecutive months of headline HICP above target, including 12 months above 5%.
History does not repeat. But the transmission lags are mechanical, and the central bank, the supermarket chains, the airlines, the freight forwarders and the wholesale electricity markets all operate on the same calendar they did in 2022. If Brent stays above $100 through Q2 2026, the implied path for core HICP through end-2026 and into 2027 is not consistent with the rate cuts the curve was pricing in March.
What this means for markets
The clean way to think about positioning is to take the ECB’s own scenario fan and ask which scenarios markets have priced. The OIS curve as of mid-April was still pricing essentially no change in policy through end-2026, with cuts starting in early 2027. That curve is consistent with the December 2025 baseline (1.9% inflation) and roughly inconsistent with the March 2026 baseline (2.6% inflation). Either the ECB will be forced to delay cuts further, or it will tolerate inflation persistently above target, or both. None of those outcomes are friendly to the front end of the bund curve.
The equity-side implications are more nuanced. Energy producers benefit directly. European utilities with regulated pass-through provisions benefit slightly. European airlines, road haulage, food retailers with thin margins, and any business with inelastic demand and energy-heavy inputs (chemicals, steel, cement, glass, ceramics, paper, ammonia-derivative agriculture) get squeezed. The euro itself sits in the middle: higher rates would be supportive, higher imported energy costs (priced in dollars) are negative, and the net depends on which dominates over which horizon.
The commodity side is its own story, but the basic mechanics suggest curves stay backwardated, refining cracks stay wide, and middle distillates (diesel, jet, heating oil) outperform light products on physical tightness.
What to watch next
The April HICP final release, scheduled for mid-May, will tell us whether the +3.0% flash held or got revised. Watch the components: if the energy component is at or above +10%, it confirms the chain is fully active. The May flash, scheduled for end of May, will tell us whether April was a peak or a stepping stone. The June ECB meeting will publish updated staff projections - if the 2026 headline forecast moves from 2.6% to 2.8% or higher, the central bank is officially in catch-up mode.
On the commodity side, the question is whether Brent settles above $100 or grinds back to the $80-90 range. Above $100 is consistent with the ECB’s adverse-or-worse scenarios. Below $90 means much of the second-round risk fades and the consensus “transitory” narrative survives.
The food line is the last shoe to drop and the slowest to develop. Watch the food sub-component of HICP from Q3 2026 onwards. If it starts climbing back toward 4-5%, the cycle is fully replaying.
Bottom line
Eighteen months of “we beat inflation” was, in retrospect, the favorable side of a base effect. The actual underlying inflation pressure - core stuck at +2.3%, services at +3.2%, wage growth at +3.7% - never went away. It was just hidden by the disinflation in food and energy that bled out of the 2022 shock. That hiding mechanism has now been removed and replaced with a fresh inflationary impulse of comparable magnitude.
The transmission chain is mechanical. The lags are knowable. The ECB has already published the scenarios. The market has not yet priced any of them.
Two years of victory laps just got cancelled. Welcome to the second wave.
Sources
European Central Bank, ECB staff macroeconomic projections for the euro area, March 2026: ecb.europa.eu/press/projections/html/ecb.projections202603_ecbstaff~ebe291cd3d.en.html
European Central Bank, Economic Bulletin Issue 2, 2026: ecb.europa.eu/press/economic-bulletin/html/eb202602.en.html
European Central Bank, Eurosystem staff macroeconomic projections for the euro area, December 2025: ecb.europa.eu/press/projections/html/ecb.projections202512_eurosystemstaff~12ead61977.en.html
Eurostat, Annual inflation up to 2.6% in the euro area (16 April 2026 release): ec.europa.eu/eurostat/web/products-euro-indicators/w/2-16042026-ap
Eurostat, Euro area annual inflation up to 2.5% (March 2026 flash, 31 March 2026): ec.europa.eu/eurostat/web/products-euro-indicators/w/2-31032026-ap
Eurostat, Inflation in the euro area - Statistics Explained: ec.europa.eu/eurostat/statistics-explained/index.php?title=Inflation_in_the_euro_area
Eurostat, Eurostatistics - data for short-term economic analysis: ec.europa.eu/eurostat/statistics-explained/index.php?title=Eurostatistics_-_data_for_short-term_economic_analysis
Deutsche Bundesbank, Harmonised Index of Consumer Prices: bundesbank.de/en/statistics/economic-activity-and-prices/harmonised-consumer-prices/harmonised-index-of-consumer-prices-932146
Federal Reserve Bank of St. Louis (FRED) - data series used:
Headline HICP, Euro Area 19: fred.stlouisfed.org/series/CP0000EZ19M086NEST
Core HICP (excl. energy, food, alcohol, tobacco): fred.stlouisfed.org/series/00XEFDEZ19M086NEST
HICP Energy: fred.stlouisfed.org/series/ENRGY0EZ19M086NEST
HICP Fuels and Lubricants for Personal Transport: fred.stlouisfed.org/series/CP0722EZ19M086NEST
HICP Electricity, Gas and Other Fuels: fred.stlouisfed.org/series/CP0450EZ19M086NEST
Brent Crude Oil, Europe: fred.stlouisfed.org/series/DCOILBRENTEU
Kerosene-Type Jet Fuel, US Gulf Coast: fred.stlouisfed.org/series/WJFUELUSGULF
Bobeica, E., Holton, S., Huber, F., Martínez Hernández, C. (2025), Non-linear pass-through of energy shocks into euro area inflation - cited in ECB Economic Bulletin Issue 2, 2026.
Data Driven Stocks publishes data-first analysis on financial markets, economic news and policy. If this analysis was useful, share it with someone who is still pricing the disinflation that ended six months ago.

