Oil Goes to $100 This Week due to Iran and strait of Hormuz? And How Far Can It Actually Go?
An in-depth data analysis of Brent crude’s historic 30% weekly spike, the 10-month decline that preceded it, and what Wall Street thinks comes next.
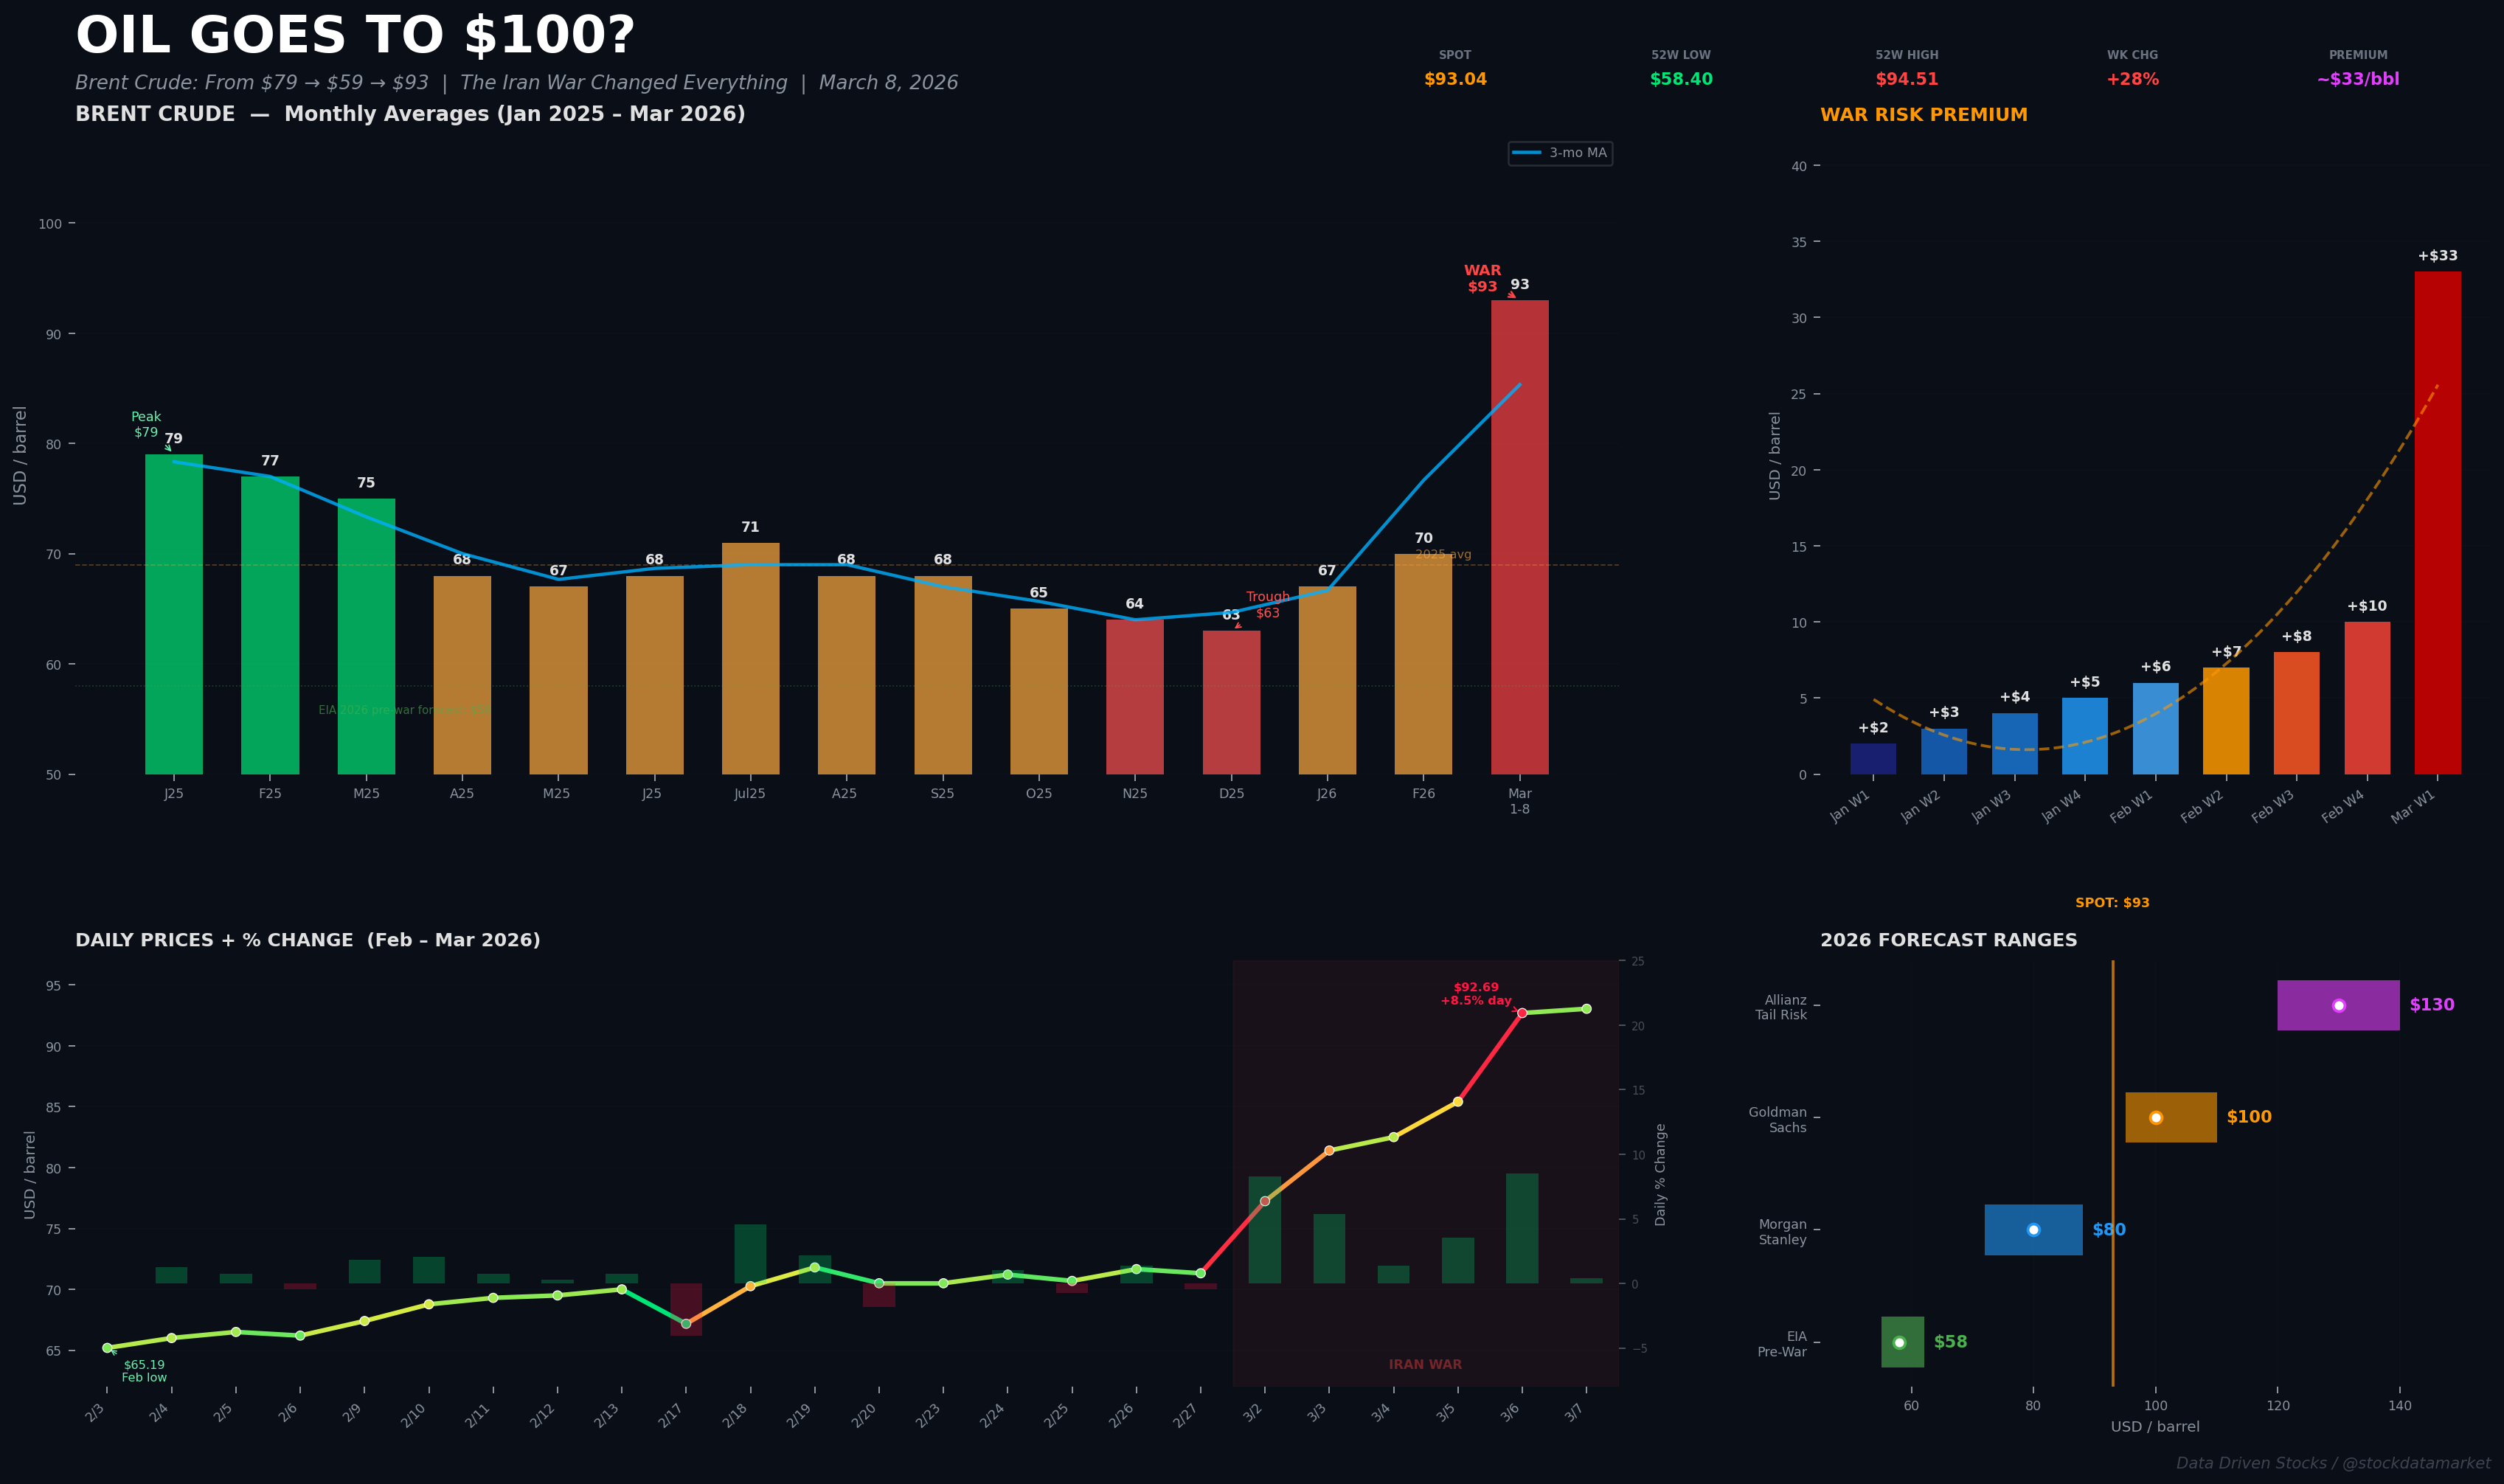
If you went to sleep (assuming that anyone sleeps in finance, because I don’t) on Friday, February 27th with Brent crude at $71.32 and woke up a week later, you’d think your Bloomberg terminal was broken. Brent closed March 6th at $92.69 — up nearly 30% in five trading sessions — and blew past $93 over the weekend. That’s the biggest weekly gain since the pandemic chaos of April 2020, and it happened for the most straightforward reason imaginable: war.
U.S.-Israeli airstrikes on Iranian military and nuclear facilities, codenamed “Operation Epic Fury,” launched over the weekend of February 28 and triggered a chain of events the oil market hadn’t priced in at all. Iran’s Revolutionary Guard declared the Strait of Hormuz closed. Tanker traffic through the chokepoint — which normally handles about 20% of the world’s oil supply, or roughly 14 million barrels per day — dropped to near zero. And just like that, months of oversupply narratives, demand doom, and OPEC+ unwinding fears were obliterated by the most basic principle in commodities: if you physically can’t move the oil, the price goes vertical.
But this story isn’t just about one week in March. To understand why this spike matters — and whether $100 oil is a real possibility — you need to look at the full 10-month arc that got us here.
The Long Bleed: How Brent Went From $79 to $59
For most of 2025, oil was a one-way trade — down.
Brent started the year at roughly $79 per barrel in January 2025, and by mid-December it had cratered to an intraday low of about $59. The full-year average came in at $69/bbl, which was the lowest annual average since 2020. If you were long oil last year, you were probably having a bad time.

The decline wasn’t mysterious. It was driven by a collision of bearish forces that reinforced each other month after month.
OPEC+ was the biggest factor. The group tripled the pace of its monthly production hikes, unwinding 2.88 million barrels per day of voluntary cuts between April and December 2025. Saudi Arabia in particular seemed willing to tolerate lower prices to defend market share — a posture reminiscent of 2014. Combined with relentless non-OPEC supply growth from the U.S. (which hit a record 13.5–13.6 million bpd), Canada, Guyana, and Brazil, the world was simply drowning in crude. Total observed inventories rose by 477 million barrels during the year, and OECD stocks surpassed their five-year average for the first time since 2020.
Then there was demand. Or rather, the lack of it. China’s economic slowdown continued to disappoint, and Trump’s “Liberation Day” tariffs in April 2025 crashed Brent to an intraday low of around $58/bbl on fears of a global recession. A 90-day pause and subsequent negotiations partially unwound the damage, but tariff uncertainty remained a persistent drag. Punitive 25% tariffs on India for purchasing Russian crude further scrambled global trade flows, adding another layer of unpredictability to an already confused market.
The EIA’s quarterly breakdown tells the story concisely: Q1 2025 averaged $75.83, Q2 dropped to $68.01, Q3 came in at $69.00, and Q4 collapsed to roughly $63. Each quarter was lower than the last, with the exception of a modest Q3 bounce driven by a brief Israel-Iran conflict in June that spiked prices to ~$80 before they reverted just as quickly.
February 2026: The Calm Before the Storm
January 2026 provided the first real sign that the bearish trend might be exhausting itself. Winter Storm Fern shut approximately 2 million bpd of U.S. production, Kazakhstan’s Tengiz field suffered outages, and Venezuela’s exports collapsed from 880,000 bpd to just 300,000. Global unplanned outages approached 3.0 million bpd — the most since September 2024. Brent rallied from $63 to $67 on these disruptions alone.
February then became a volatile consolidation. The month played out in two distinct phases. During the first half (February 2–17), Brent traded in a tight $65–$70 band as U.S.-Iran nuclear negotiations produced mixed signals. The monthly low of $65.19 was printed on February 3rd. The second half (February 18–27) saw a decisive shift into a $70–$72 range as war risk premiums built. By February 26th, Brent hit $72.36 intraday and closed above $71 for three consecutive sessions. Arbat Capital estimated at the time that markets were already embedding roughly $10/bbl of war risk premium.
In hindsight, the February price action was textbook. The market was telling you something. It just wasn’t screaming yet.
The Week That Changed Everything: March 2–8, 2026
And then it screamed.

The first trading day after the strikes, Monday March 2nd, saw Brent gap open to $77.24 — a 7% jump overnight. Tuesday brought $81.40 as the war entered its fourth day and Trump’s offer of tanker insurance briefly tempered the panic. By Wednesday, tanker attacks were being reported in Gulf waters and Brent climbed to the low $80s. Thursday delivered the news that Iraq had shut 1.5 million bpd of production and Kuwait had cut output, pushing Brent to $85.41.
Friday March 6th was the day the market went truly parabolic. Brent surged 8.5% in a single session — up $7.28 — to close at $92.69 and briefly touch $90 for the first time in roughly two years. Goldman Sachs issued an urgent client note warning that $100 oil could arrive the following week if no resolution emerged. Over the weekend, as Iran targeted U.S. facilities in the UAE, Brent futures hit an intraday high of $94.51.
The 52-week range now stands at $58.40 to $94.51. That’s a 62% spread, which tells you everything about the kind of regime change this market just experienced.
What’s Driving This? The Supply Factor Breakdown
The temptation is to say “it’s just Iran” and leave it there. But the reality is more nuanced. This spike happened because of a specific constellation of supply factors that were already straining the market before the bombs fell.

The Strait of Hormuz is the single largest factor, with 14+ million bpd of transit flows now at risk. To put that in context, that’s nearly 15% of global oil production flowing through one narrow waterway that is currently closed. No amount of spare capacity or strategic reserve releases can immediately replace that volume — especially since most of OPEC+’s spare capacity (concentrated in Saudi Arabia, the UAE, and Kuwait) sits behind the closed strait.
OPEC+’s emergency response was telling. The group announced an increase of 206,000 bpd starting in April, which is effectively a rounding error against the 14 million bpd at stake. It was a symbolic gesture, not a material one. The January unplanned outages of 3.0 million bpd were already the highest in over a year, and adding the Hormuz closure on top creates a supply deficit that the market simply cannot solve through normal mechanisms.
On the bearish side, the OPEC+ production unwinding added 2.88 million bpd over the course of 2025, and U.S. production at a record 13.6 million bpd provides a substantial baseline. But that supply was already priced into the $60-something range. The war is additive disruption on top of a market that had only just started finding a floor.
Technical Analysis: What the Charts Say
Beyond the fundamentals, the technical picture offers additional context for how far this move could extend.

The long-term weekly chart reveals something important. Brent has been trading within a broad descending channel since the 2022 highs near $128. The $80 area — marked by the dashed blue trendline — acted as both support and resistance multiple times between 2023 and 2025. The March spike has now decisively broken above that trendline, which transforms it from resistance into potential support on any pullback.
The next major resistance zone sits at $100, which has obvious psychological significance and aligns with the blue projection line on the chart. Above that, the $120–$128 zone (the 2022 highs) represents a major ceiling. The $150 area (2008 peak) is the kind of extreme scenario that only materializes if the Strait remains closed for months.

The daily chart is even more telling. The series of large green candles from March 2–6, each with minimal upper wicks, indicates that buyers are aggressively chasing every dip with almost no selling pressure at the highs. The price is tracking the steeper of the two projection lines, which points to $100 by roughly March 10 and potentially $107 by March 13. This isn’t a prediction — it’s a momentum trajectory that will hold until one of two things happens: a ceasefire announcement, or an exhaustion gap that signals a short-term top.
Where Does Oil Go From Here? The Analyst Scoreboard
Wall Street has been scrambling to revise forecasts all week. The divergence between pre-war models and post-war reality is staggering.

The EIA’s February 2026 Short-Term Energy Outlook called for a $58 annual average, based on a world where oversupply of 3.1 million bpd in inventory builds was the dominant story. That forecast is now effectively dead. Morgan Stanley moved fast, revising its full-year 2026 Brent forecast from $62.50 to $80/bbl — acknowledging that even a swift resolution would leave elevated risk premiums in place for months. Goldman’s warning of $100+ was the most aggressive near-term call, while Allianz and Barclays both modeled extreme tail scenarios of $120–$130 under a prolonged conflict.
The gap between the EIA’s $58 and Allianz’s $130 is $72 per barrel. That’s not a forecast range — that’s a confession that nobody knows what’s going to happen.
The Binary Outcome: $60 or $100+
The Brent crude market as of March 8, 2026 is defined by an extraordinary divergence between fundamentals and geopolitics.
Pre-war fundamentals pointed toward $55–60/bbl for 2026. The supply picture was bearish, demand was soft, and OPEC+ had effectively lost the pricing battle by flooding the market. The Iran conflict has added a $20–40/bbl risk premium (per Morgan Stanley’s estimate), pushing prices to ~$93. The war premium alone is larger than the entire price move of the preceding 10 months of decline.
Two relief valves exist but may not be enough. China purchased roughly 1.0 million bpd of crude for strategic reserves throughout 2025, representing stored supply that could theoretically be released. Meanwhile, approximately 140 million barrels of Russian oil remain stranded at sea — crude that India was buying before Trump’s sanctions, and for which a 30-day waiver was granted on March 6th. These are meaningful volumes, but they’re band-aids on a market facing the potential loss of 14 million bpd of transit capacity.
The honest answer is that this is a binary outcome. A swift ceasefire and Hormuz reopening could see prices retrace much of the spike, potentially back toward the $70–$80 range — following the template of the June 2025 Israel-Iran war that spiked prices briefly before a quick ceasefire brought them back down. A prolonged closure, on the other hand, would push Brent past $100 with conviction and potentially toward the $120–$130 range that the most bearish analysts have been modeling.
The market is pricing in the latter scenario. Whether it’s right depends on decisions being made in Tehran, Washington, and Riyadh — not in trading pits.
If you found this useful, subscribe to Data Driven Stocks on Substack (@ddstocks) and follow @stockdatamarket on X for more data-driven market analysis.
Sources:
FRED (Federal Reserve Economic Data) — Daily EIA Brent spot (DCOILBRENTEU) and Monthly IMF averages (POILBREUSDM), accessed March 2026. https://fred.stlouisfed.org
EIA (U.S. Energy Information Administration) — Short-Term Energy Outlook, February 2026 and prior monthly reports. https://www.eia.gov/outlooks/steo/
Trading Economics — Brent Crude Oil real-time CFD data and historical prices. https://tradingeconomics.com/commodity/brent-crude-oil
OPEC Monthly Oil Market Report (MOMR) — Official OPEC Brent price assessments and production data. https://publications.opec.org/momr
IEA Oil Market Report — February 2026 monthly market analysis. https://www.iea.org/reports/oil-market-report-february-2026
Goldman Sachs Research — Client note on Brent crude outlook, March 6, 2026.
Morgan Stanley Research — Revised 2026 Brent forecast, March 2026.
Allianz Global Investors — Tail-risk scenario modeling for prolonged Strait of Hormuz closure.
Arbat Capital — War risk premium estimate, mid-February 2026.


