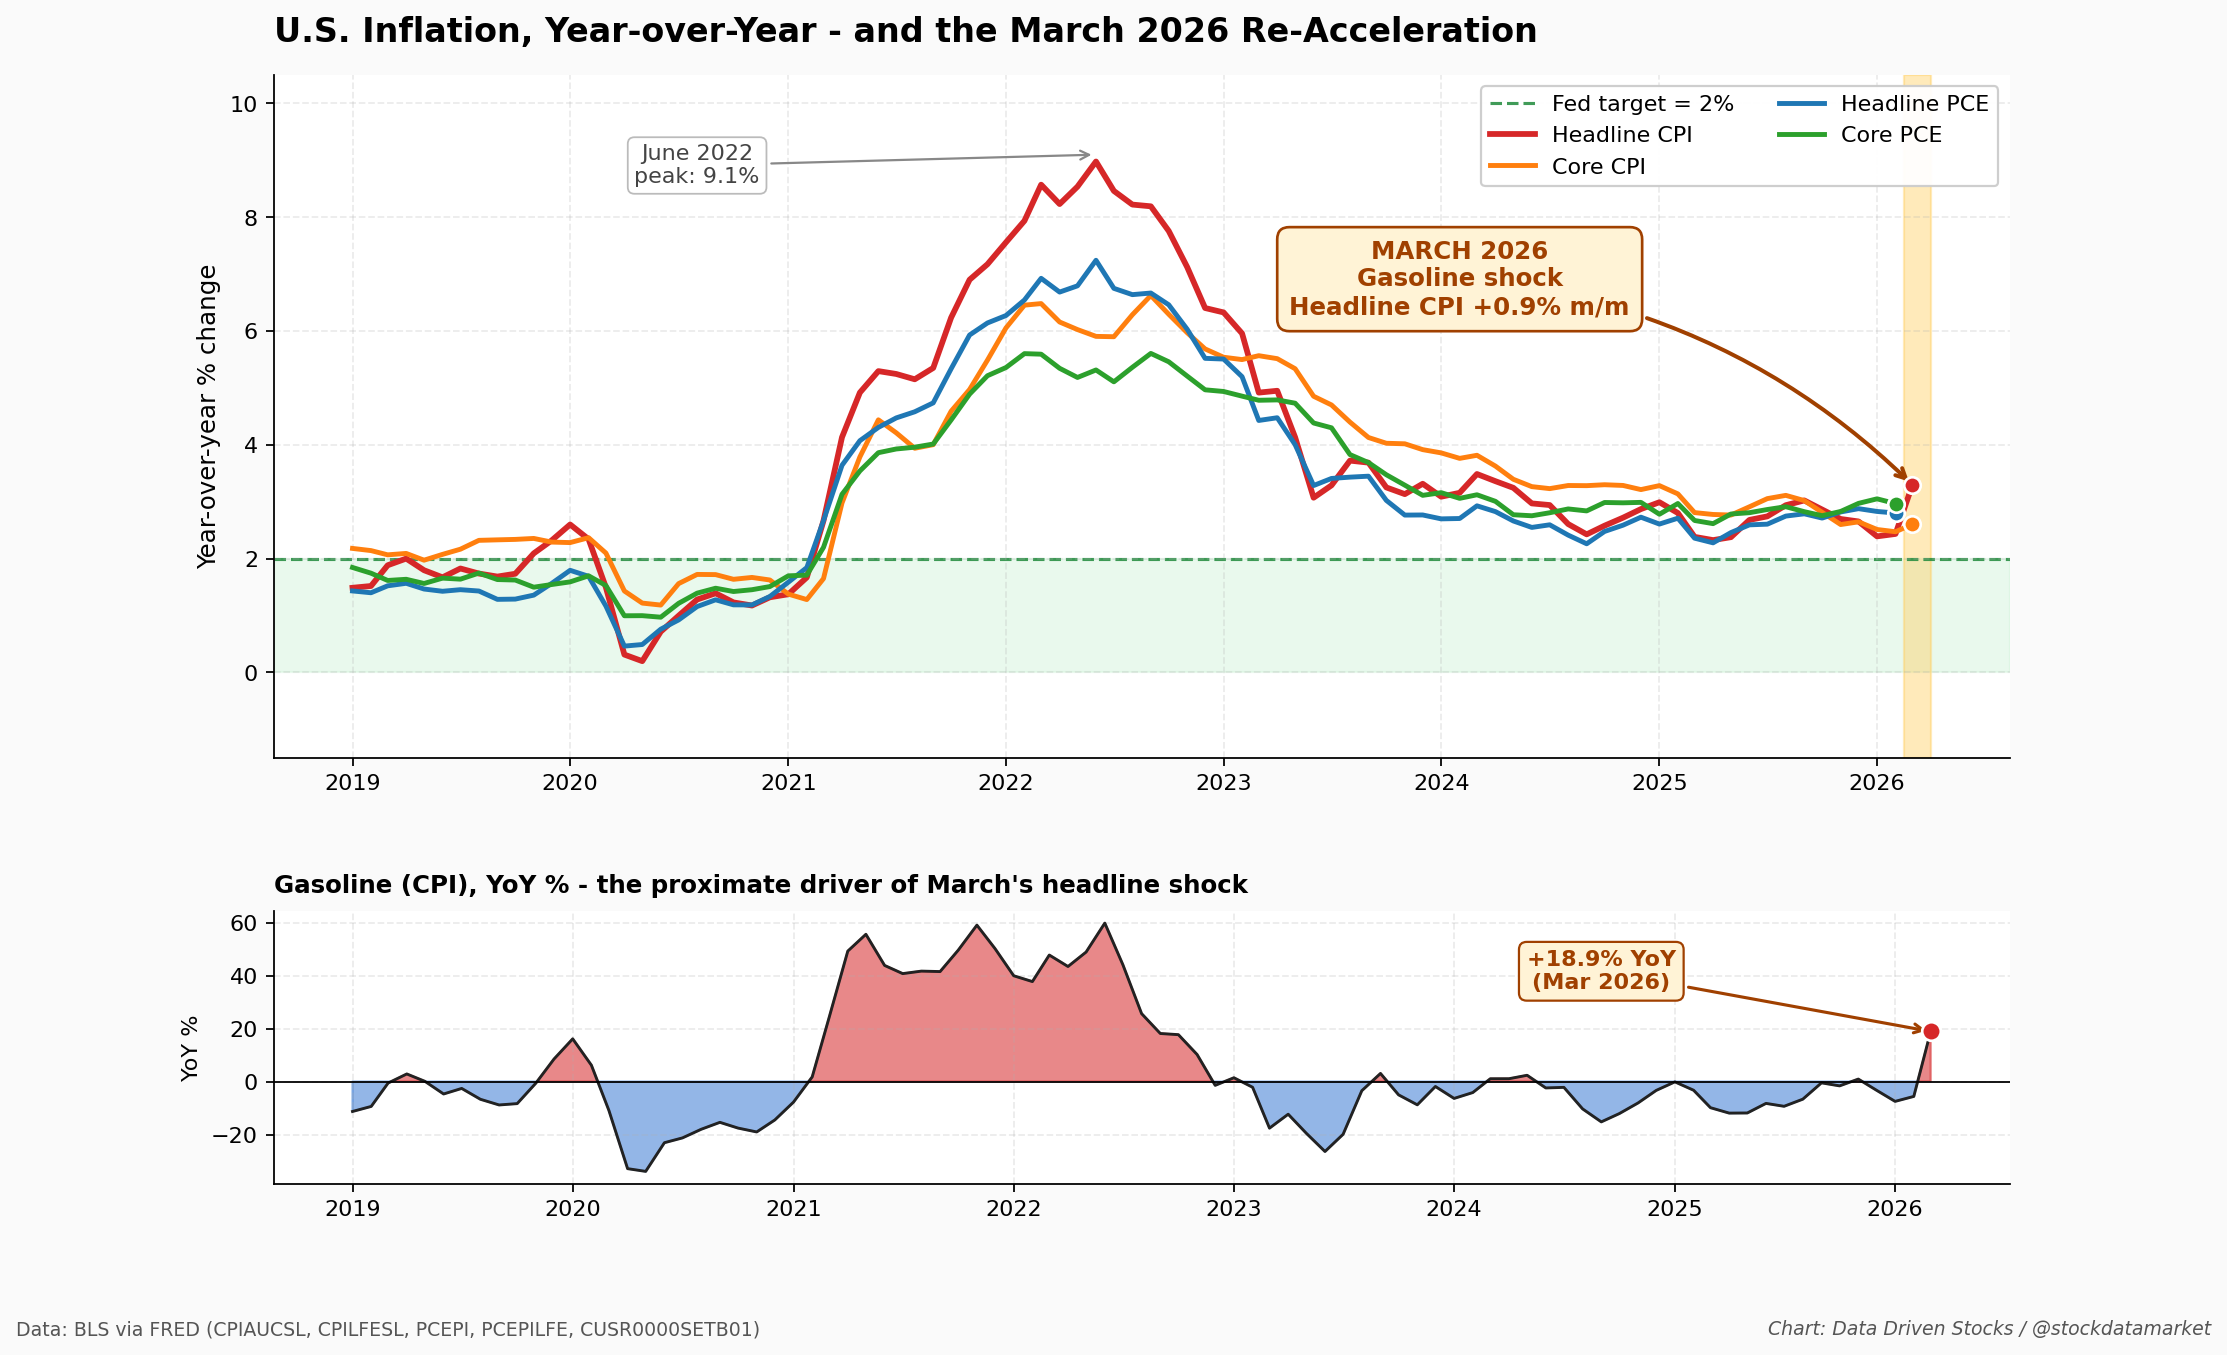
March CPI Just Detonated At 0.9%: Gasoline Did 75% Of The Damage, And Now The Fed Has A Problem
April 2026 inflation data is out, and it’s worse than the past year suggested. The real story isn’t the +0.9% - it’s what’s beneath it and what BLS is warning about next month.

When the Bureau of Labor Statistics released the March 2026 CPI on April 10, the number that printed across every terminal was three digits and a decimal: +0.9% month-over-month, seasonally adjusted. That is the largest monthly headline jump since mid-2022, lifting the 12-month rate from a sleepy 2.4% in February to 3.3% in March. For a Fed that spent the back half of 2025 telegraphing cuts, that single number is a small earthquake.
But before anyone starts screaming “inflation is back,” it’s worth slowing down. The composition of this print is genuinely unusual, the data quality questions stacked behind it are real, and the path forward through May’s release runs straight through some BLS plumbing that almost nobody outside the building thinks about. Let’s break it down.
The Headline: A Number With A Single Address
The +0.9% headline didn’t come from a broad reflation. It came from one place. Energy prices rose +10.9% month-over-month, with gasoline alone up +21.2%. Fuel oil added another +30.7% on top. By BLS’s own arithmetic in their one-month analysis table, gasoline contributed roughly +0.64 percentage points of the +0.9% headline move - in other words, about three-quarters of the entire inflation print was the price you saw at the pump.
Strip out food and energy and the picture changes completely. Core CPI rose just +0.2% month-over-month and sits at +2.6% year-over-year, which is essentially where it was in February (and where it has been hovering for most of the past six months). Shelter, the stickiest of the sticky core categories, came in at +0.3% - more or less the same monthly cadence it has shown all year. The dispersion across components is striking once you look at them all together.

Look at where prescription drugs landed (-1.5%), where used cars fell (-0.4%), where medical care declined (-0.2%), where personal care dropped (-0.5%). These are not the fingerprints of a generalized inflation impulse. They are the fingerprints of a relative-price shock - a sharp, narrow, energy-driven dislocation sitting on top of a core inflation backdrop that is, frankly, kind of boring.
The Pump: Where The Shock Actually Comes From
If you want to know why CPI gasoline jumped 21% in a single month, you don’t need an econometric model. You just need to look at the EIA’s weekly retail gasoline series. The story is right there.

From the early-February low to the most recent weekly print, the average U.S. retail gasoline price moved from $2.78 to $4.12 per gallon. That’s a 48% move in eight weeks. CPI gasoline can only do what retail gasoline does, and retail gasoline did a great deal in March. Whatever combination of refinery margins, geopolitics, and crude-side dynamics is driving this is somebody else’s article - what matters here is that the upstream trigger is unambiguous, real-time, and not going to politely revise itself away in next month’s seasonal-adjustment update.
Upstream: The PPI Tells The Same Story, In The Same Voice
If gasoline is the murder weapon, the PPI is the murder weapon’s receipt. Producer prices for final demand rose +0.5% in March after the same +0.5% in February, lifting the 12-month rate to +4.0% - the largest annual increase since February 2023.
Pull off the lid and the same energy story is sitting underneath. Final demand goods rose +1.6%, but final demand services were unchanged at 0.0%. Inside goods, final demand energy rose +8.5% with gasoline up +15.7% at the wholesale level. That is exactly the pattern you expect when an oil/refined-product shock is propagating from upstream to retail with a short lag. Core PPI - which BLS defines as final demand less foods, energy, and trade services - rose just +0.2% m/m and +3.6% y/y, the same kind of contained-but-still-elevated reading we’ve seen on core CPI.
The pipeline indicators reinforce that this is a refined-product story rather than a broad commodity surge. Processed goods for intermediate demand rose +2.6%, almost entirely on processed energy goods (+11.3%). Unprocessed goods for intermediate demand actually fell -2.6%, with unprocessed natural gas down a stunning -51.7% on its own. So crude/wholesale gasoline ripped, but raw natural gas collapsed - that is a very specific commodity-level dislocation, not a uniform price-level surge.
PCE: The Fed’s Preferred Yardstick Is Already Above 3% On Core
The Fed doesn’t actually target CPI. It targets PCE. And the picture there - which lags by a month and was itself rescheduled because of the 2025 government shutdown - is one of an inflation rate that has been quietly running hot for a while now.
BEA’s February 2026 Personal Income and Outlays release (published April 9, after originally being scheduled for March 27) showed the PCE price index up +0.4% m/m and +2.8% y/y, with core PCE up +0.4% m/m and +3.0% y/y. That core PCE 3.0% reading is materially above the Fed’s 2% objective and was the number Chair Powell himself referenced in his March 18 press conference. It also predates the March gasoline shock entirely - the February PCE print was already tracking hot before energy decided to add a quart of gasoline to the kitchen fire.
When the March PCE release hits in early May, the energy pass-through from the CPI/PPI shock is going to mechanically lift the headline number further. Core PCE is the one to watch: if it stays sticky around 3.0% with services not rolling over, the Fed has a real problem articulating any cut at all.
Expectations: Survey Respondents Are Not Calmly Distinguishing Headline From Core
Here is where it stops being a tidy academic exercise. Households don’t read BLS Table 6. They look at gas prices. And in two separate, well-respected consumer-expectations surveys, those expectations just lurched higher in a way that should worry every Fed watcher.

The University of Michigan’s preliminary April reading on next-year inflation jumped from 3.8% to 4.8% in a single month. Five-to-ten-year expectations also moved up, to 3.4% from 3.2%. The NY Fed’s March SCE, surveying households over March 2-31 and published April 7, showed median 1-year expectations rising +0.4 pp to 3.4%, with the 1-year expected gasoline price change jumping +5.3 pp to 9.4% - the highest gas-expectation reading since March 2022.
The encouraging detail in the NY Fed data is that 3-year expectations only ticked up +0.1 pp and 5-year expectations were unchanged. So far, households appear to be re-pricing the near term in response to what they’re seeing at the pump while keeping the long-run anchor more or less in place. That’s the single most important piece of information for the Fed in the entire release. If that anchor starts moving, the conversation changes.
The Data Quality Elephant: Why April’s Numbers Will Be “Atypical”
If everything above looked clean, you can stop reading here. If you want the part most market commentary skips, it’s this: the inflation statistics you’re consuming right now have been mechanically distorted by the October-November 2025 lapse in appropriations, and BLS is openly warning that those distortions don’t fully wash out until April 2026 - which is to say, the very release everyone is about to scrutinize next month.

There are three separate things going on, and they layer.
First, carry-forward imputation. When BLS could not collect October prices for most CPI commodities and services during the shutdown, the September value was substituted in. In the API and in the supplemental tables, those October cells appear as a literal dash, and one-month percent changes for affected series are suppressed. November indexes were then computed by comparing observed November prices to those carried-forward October values - which means even the November-to-December changes you might think are “clean” have a slight artificial smoothness baked in.
Second, geometric-mean interpolation for seasonal adjustment. To keep the seasonal-factor estimation procedure from blowing up at the shutdown, BLS approximated each missing October value with the geometric mean of September and November (and for series missing November as well, with Sep and Dec). That is a defensible workaround for a one-time emergency, but it is not the way seasonal adjustment normally works, and the resulting seasonal factors will be carrying a small artificial fingerprint of that interpolation for some time.
Third, the rent and owners’ equivalent rent (OER) panel rotation. CPI rent samples are rotated on a six-month cadence. The shutdown disrupted that rotation. BLS itself states - in plain text on its shutdown-impact page - that the April 2026 monthly change in rent and OER will be “atypical”, effectively reflecting a 1/6 root of a 12-month change rather than the usual 6-month change. Practically, that means the rent and OER monthly numbers in the May 12 CPI release should not be interpreted as comparable to the trailing months. Some analysts will read them as a clean signal anyway. They shouldn’t.
On top of all that, the April 2026 CPI release also marks the formal rebasing of several CPI series to a December 2024 = 100 reference period. Historical continuity is preserved by back-calculation, so the long histories you and your charts have been working with remain comparable. But the published index levels will look different, which is its own small source of next-month confusion.
This is not a conspiracy. BLS is being unusually transparent about every one of these mechanics. But it does mean that the April 2026 CPI report - the one that lands May 12 and will be parsed through the lens of “did the gasoline shock actually persist” - has at least three separate sources of mechanical, BLS-acknowledged noise sitting inside it before any real economic signal even arrives. Anyone trading on the first headline print without reading the technical notes is going to get half a story.
What This Means For The Fed
The Cleveland Fed’s daily nowcasting model, as of April 15, was projecting April 2026 CPI at roughly 3.58% YoY with core CPI at 2.56% YoY and a monthly headline of about +0.46%. That nowcast uses high-frequency oil and gasoline inputs, so it is essentially saying the energy shock will continue to lift headline but core will stay roughly where it has been.
Stack the pieces together and the path is reasonably clear. Headline inflation has just re-accelerated for energy-specific reasons that are real and visible at the pump. Core inflation has not, and remains stuck in a 2.5-3.0% range that is uncomfortable but not deteriorating. Producer prices confirm the energy story upstream and confirm that services pressure has actually eased on a monthly basis. The Fed’s preferred PCE measure was already above target on core before the gasoline shock added another half-point of headline pressure. And consumer expectations have moved up on the near-end of the curve while the long-end has held.
For a Federal Reserve trying to maintain its credibility while debating rate cuts, the headline shock does the political work of pushing easing further out, but the core dynamics don’t really change the underlying problem. Core PCE at 3.0% with a sticky shelter component and now a fresh shock to expectations is not a rate-cut environment. It is a hold-and-watch environment, with a meaningful risk that if the next two prints don’t reverse, the Fed has to talk much more cautiously than the consensus currently expects.
The thing to watch on May 12 is not the headline. It will be ugly because gasoline will be ugly. The thing to watch is whether core CPI accelerates above its recent 0.2% monthly cadence and whether services ex-shelter does anything weird. If core stays at 0.2-0.3% and the rent/OER move can be visibly attributed to the BLS-flagged “atypical” rotation, this is a one-component shock that the Fed can credibly look through. If core drifts up to 0.3-0.4% and services ex-shelter joins in, the picture changes meaningfully and the rate-cut conversation shifts from “when” to “if.”
For now, March 2026 is what it is: a 0.9% headline print with a single street address, a core picture that is contained but not improving, and a data quality footnote that almost nobody is reading. The next four weeks are going to be informative.
Sources
BLS, Consumer Price Index - March 2026 (released April 10, 2026): https://www.bls.gov/news.release/cpi.nr0.htm
BLS, archived CPI release (March 2026): https://www.bls.gov/news.release/archives/cpi_04102026.htm
BLS, Producer Price Index - March 2026 (released April 14, 2026): https://www.bls.gov/news.release/ppi.htm
BLS, PPI Detailed Report (March 2026): https://www.bls.gov/web/ppi/ppi_dr.pdf
BLS, “2025 Federal Government Shutdown - Impact on CPI”: https://www.bls.gov/cpi/additional-resources/2025-federal-government-shutdown-impact-cpi.htm
BLS, Seasonal adjustment in the CPI: https://www.bls.gov/cpi/seasonal-adjustment/
BEA, Personal Income and Outlays, February 2026 (released April 9, 2026): https://www.bea.gov/news/2026/personal-income-and-outlays-february-2026
BEA, full release PDF: https://www.bea.gov/sites/default/files/2026-04/pi0226.pdf
University of Michigan Surveys of Consumers, Expected Changes in Inflation Rates (April 2026 preliminary): https://www.sca.isr.umich.edu/files/tbcpx1px5.pdf
Federal Reserve Bank of New York, Survey of Consumer Expectations (March 2026, released April 7, 2026): https://www.newyorkfed.org/newsevents/news/research/2026/20260407
Federal Reserve Bank of Cleveland, Inflation Nowcasting: https://www.clevelandfed.org/indicators-and-data/inflation-nowcasting
Federal Reserve Chair press conference transcript, March 18, 2026: https://www.federalreserve.gov/mediacenter/files/FOMCpresconf20260318.pdf
St. Louis Fed FRED database (series CPIAUCSL, CPILFESL, PCEPI, PCEPILFE, CPIENGSL, CUSR0000SETB01, CUSR0000SAH1, GASREGW, MICH, T5YIE, PPIFIS, WPSFD49116): https://fred.stlouisfed.org/
PNC Economics Research, CPI (April 10, 2026): https://www.pnc.com/content/dam/pnc-com/pdf/aboutpnc/EconomicReports/EconomicUpdates/2026/PNC_Economics_Research_CPI_10_April_2026.pdf
EFG International, US March CPI: Energy-Driven Inflation Delays Fed Easing (April 14, 2026): https://www.efginternational.com/us/insights/2026/us_march_cpi_energy_driven_inflation_delays_fed_easing.html
Goldman Sachs (Marcus), February 2026 CPI Update: https://www.marcus.com/us/en/resources/heard-at-gs/february-2026-cpi-update
Wall Street Journal, March 2026 CPI coverage: https://www.wsj.com/economy/cpi-inflation-report-march-2026-bb353007

