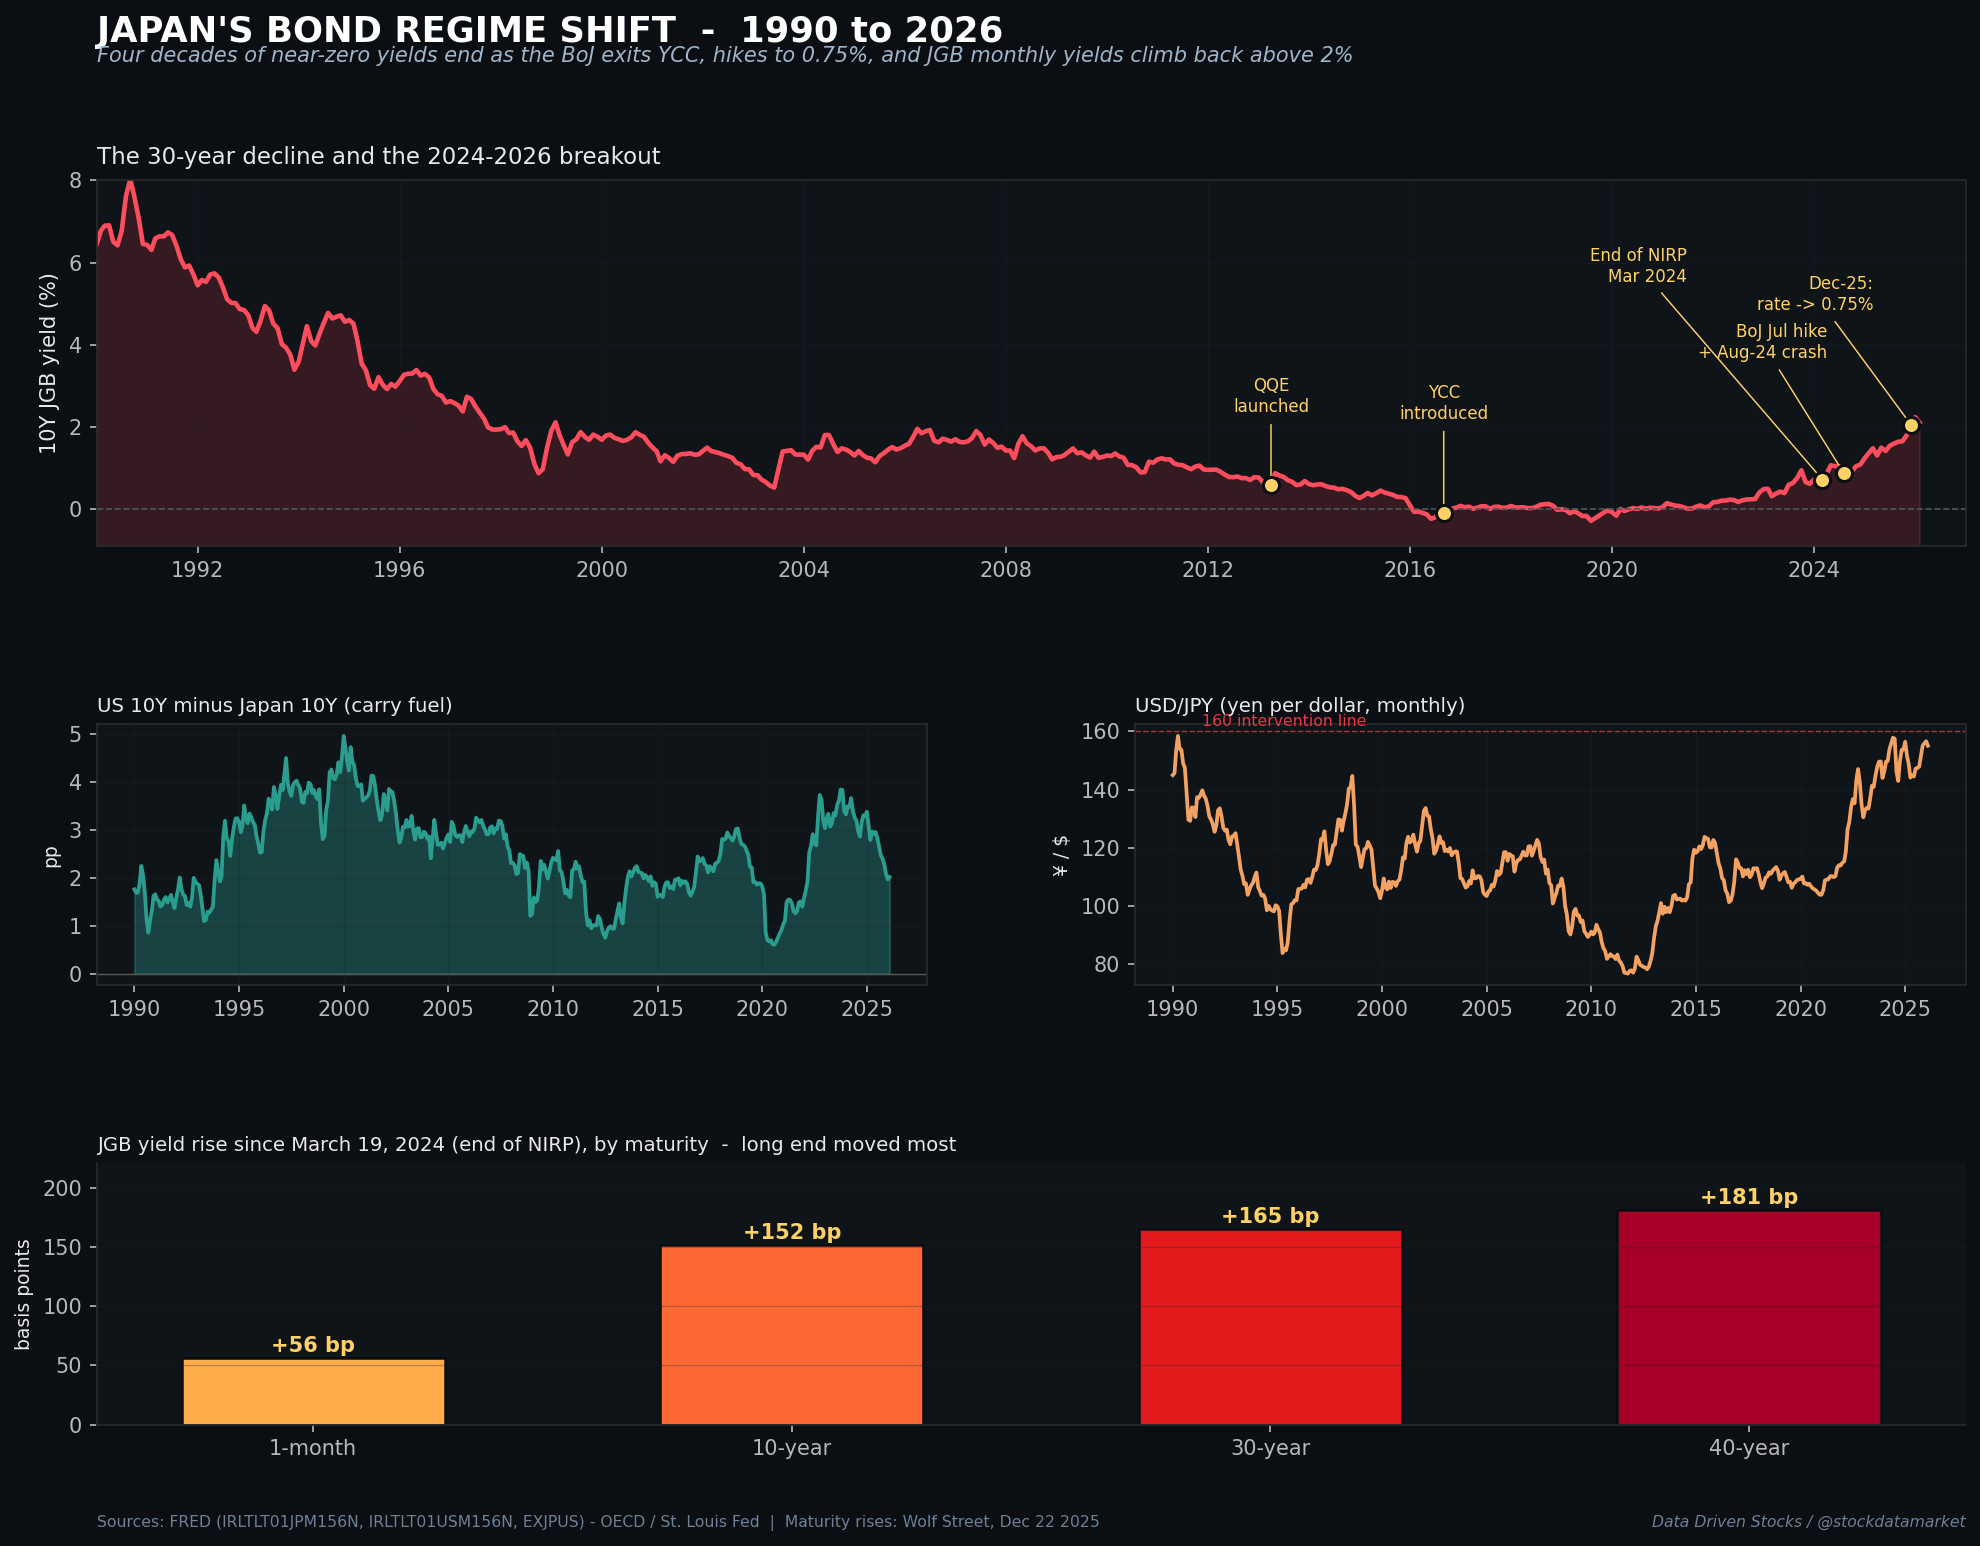
Japan Just Ended 30 Years of Free Money - And Your Portfolio Hasn’t Priced It In Yet
Did you hear about the yen carry trade? Be prepared for a few more. Japanese bonds are falling (yields are rising) at the fastest pace ever.

For thirty years, the most important number in global finance was a zero. It was printed on the front end of the Japanese yield curve, stamped onto the back of every carry trade in every emerging market, and quietly embedded into the valuation of every growth stock that required cheap money to make the math work. That zero is gone. On December 19, 2025, the Bank of Japan raised its policy rate to 0.75%, the highest level since 1995, and told markets more hikes are coming. The Japanese 10-year yield, which spent most of the last decade trading near or below zero, climbed to 2.11% on the FRED monthly series in February 2026 - its highest monthly reading in nearly 27 years - and Japan Bond Trading Co. daily benchmarks showed the 10Y at 2.38% on April 3, 2026. The world’s second-largest sovereign bond market is being repriced in real time, and most investors outside of Tokyo have not yet worked out what that means for the assets they own.
This article is the attempt to work it out. It is long because the story is long. Japan is not a side quest in the global macro narrative; it is the sleeping giant of duration risk, the funding desk for roughly half a trillion dollars of leveraged bets on everything from the Nasdaq to Mexican peso bonds, and the only developed-market central bank that is tightening while the Fed cuts. When the gravity of Japanese rates shifts, orbits change everywhere else.
The thirty-year flatline nobody questioned
To understand why this matters, you have to understand how abnormal the old regime was. After the 1989 bubble collapse, Japan fell into a slow-motion deflation that nothing seemed to fix. The Bank of Japan cut short rates to zero in 1999. It reintroduced quantitative easing in 2001. It launched “Quantitative and Qualitative Monetary Easing” in 2013 under Haruhiko Kuroda, doubled the monetary base, and started buying government bonds at a pace that was unprecedented even by post-crisis central-bank standards. In 2016 it did something no other major central bank had tried: it pinned the 10-year yield to a target of 0% under a policy called Yield Curve Control, promising to buy as many bonds as needed to keep the yield there. The BoJ effectively took the duration risk of the entire Japanese economy onto its own balance sheet and told private investors not to worry about it.
For nearly a decade, the entire Japanese yield curve traded in a tight, BoJ-managed corridor. The 10Y bounced between -0.2% and +0.1% for years at a time. Investors who had priced Japanese government bonds since the bubble watched a generation of analysts retire without ever seeing a yield above 2%. The BoJ’s balance sheet swelled past 130% of GDP - a scale unmatched by any major economy - and by 2024 the central bank owned more than half of every JGB outstanding, a figure that would have been considered a financial-stability red flag in any other country.

The paradox at the center of all this is simple and terrifying. Japan runs the largest government debt load in the developed world - a gross general government debt ratio that peaked at 258% of GDP in 2020 and still sits around 240% today, per the IMF data on FRED - and simultaneously has one of the lowest interest bills as a share of GDP in the G7. That arithmetic only works because the BoJ has been holding yields down and absorbing supply. Take the BoJ’s bid out of the market and the arithmetic changes fast. This is exactly what is now happening.
The regime change in slow motion, then all at once
The first crack appeared on March 19, 2024. The BoJ raised its policy rate for the first time in seventeen years, ending the negative interest rate policy that had been in place since 2016, and simultaneously scrapped yield curve control. Markets took it as a dovish exit - the hike was tiny, the rhetoric was cautious, and the yen actually weakened afterwards. The 10Y yield drifted to about 0.73%, up from zero but hardly dramatic.
Then on July 31, 2024, Governor Kazuo Ueda did it again. The BoJ raised the policy rate by another 25 basis points and hinted at further increases. The market read it as hawkish, the carry trade cracked (more on that in a minute), and for a week the global financial system had a near-death experience. But once the dust settled, the BoJ kept tightening. It moved rates again. It started actively selling bonds - Quantitative Tightening, or QT - and has since shrunk its balance sheet by roughly ¥61 trillion, or 8.1%, since mid-2024, according to reporting by Wolf Street.
Then on December 19, 2025, the BoJ delivered the move the market had been pricing in all autumn: the policy rate went to 0.75%, the highest level since 1995. The next morning, Governor Ueda used his first public appearance of 2026 to tell markets the hiking cycle is not over.
The curve tells the whole story. Since the end of NIRP in March 2024, the 1-month rate has risen only 56 basis points, but the 10-year yield has risen about 152, the 30-year about 165, and the 40-year about 181. The long end has moved more than the front end, which is classic bear steepening: investors are not just pricing in more BoJ hikes, they are demanding a much bigger term premium to hold long Japanese duration in a world where the biggest buyer is stepping back.
The raw numbers are worth pausing on. Japan Bond Trading Co. (JBTS) benchmark rates on April 3, 2026 showed the 2-year at about 1.38%, the 5-year at 1.80%, the 10-year at 2.38% and the 30-year at roughly 3.68%. These are not scary numbers by American or European standards. But they are the highest Japanese yields in a generation, and every basis point has a first-order effect on the second-largest bond market in the world and the trillions of dollars of global positioning that depend on cheap yen.
The mechanism: how the yen carry trade actually works
The single most important channel through which Japanese rates affect your portfolio is the yen carry trade. It has many variants and many names, but the basic mechanism is simple enough that a schematic can explain it better than paragraphs can.

The key insight is that the carry trade is not just a speculative strategy run by hedge funds. It is a funding mechanism that indirectly supports the price of almost every global risk asset. Cheap yen borrowing has been used to buy US Treasuries, US tech stocks, Mexican bonds, Turkish lira deposits, Brazilian real carry products, gold, Bitcoin, commodity inventories, and emerging market equities for the better part of two decades. The exact size is unknowable - the Bank for International Settlements said so explicitly in its post-mortem on the August 2024 event - but estimates run from a few hundred billion dollars on a narrow definition to over a trillion once derivative exposures and indirect positions are included.
When the funding currency reprices, everything funded with it reprices at the same time. That is the transmission channel. And that is what August 5, 2024 looked like.
August 5, 2024: the day the machine seized
In the first week of August 2024, the global financial system had a seizure. It did not start with US macro data. It did not start with a bank failure. It started with a 25 basis point rate hike in Tokyo and a hawkish press conference.

What happened is textbook. The BoJ hiked and signaled more tightening on July 31. The yen, which had been drifting weaker all year, reversed violently. Every carry trade that was long-dollar-short-yen - which is to say, almost all of them - was suddenly underwater on the FX leg. Margin calls went out. Funds had to sell dollar-denominated assets to buy yen to repay their loans. That selling pushed the yen higher, which tightened margin further, which forced more selling. In three days the mechanism short-circuited.
The BIS Bulletin published afterwards put the damage in clinical terms. Currency carry trades funded in yen were “the hardest hit” of any strategy. The Nikkei 225 fell 12.4% on Monday August 5 - its worst single day since 1987 - and the Nikkei volatility index spiked to levels typically seen only in crises. The Eurostoxx fell 1.7%, the S&P 500 dropped another 3.0%, and the VIX spiked above 60 in off-hours trading. Emerging market currencies from the Mexican peso to the South African rand sold off sharply as carry traders scrambled to cover. Bitcoin fell roughly 20% in 48 hours.
And then, almost as quickly as it started, it stabilized. By the close of Friday August 9, the S&P 500 had recovered all the losses incurred since Monday. The TOPIX had recovered most of them. The VIX receded. Positions rebuilt within weeks.
That last detail is the part that should worry you. The August 2024 episode did not deleverage the system. It paused it.
January 2025, December 2025: the slow unwind
The January 23, 2025 BoJ meeting delivered another rate hike, this time with explicit guidance that more were coming. The reaction was more orderly than August because the market was no longer positioned for a surprise - Ueda had telegraphed the move at a bankers’ conference weeks in advance. The yen rallied but did not crash. Equities wobbled but did not collapse. Carry positions were unwound in the days around the meeting rather than in the hours.
But the direction of travel was unmistakable. Through 2025, Japanese yields climbed relentlessly. The 2-year JGB yield crossed 1% on December 1, 2025 for the first time since 2008. The 10-year crossed 1.85% around the same date - a seventeen-year high. Market reporting from BeInCrypto cited Bloomberg data showing the 2Y rising to 1% and the 10Y reaching intraday levels not seen since June 2008. Then on December 19, Ueda delivered the hike to 0.75% that markets had been pricing in heavily through early December, with probability estimates from different sources ranging from around 62% to 71% in the weeks before the meeting. Morgan Stanley estimated $500 billion of carry positions remained in the market on the eve of that meeting.
What analysts at Morgan Stanley and others have called a “controlled deleveraging” is under way. Unlike August 2024, the December 2025 hike was fully anticipated, and the S&P 500 actually rose the day of the decision. But Bitcoin and leveraged risk assets faced intense selling pressure, emerging market currencies like the Mexican peso and Brazilian real came under downward pressure, and the yen reversed from 157 toward 153 in a matter of sessions. The pattern is now clear: every BoJ hike triggers a discrete, partial unwind of the carry book. The question for 2026 is whether the next one is orderly again or whether the cumulative weight of the repricing finally breaks something.
The global map of Japanese gravity
Japan matters to every region of the world, but not in the same way. Two distinct channels operate at once, and they affect different places differently. The first channel is the carry trade: who borrows yen to fund leveraged positions. The second is real-money Japanese capital: where Tokyo’s banks, insurers, pension funds and the Government Pension Investment Fund actually park their reserves.

The United States is, counterintuitively, the single most exposed economy to Japanese monetary tightening. Around 44% of Japan’s outward portfolio investment sits directly in US dollar assets - Treasuries, agency MBS, corporate credit and equities - and another large chunk flows through offshore wrappers in the Cayman Islands and Luxembourg that ultimately hold substantial US exposure, so the effective total is closer to half the portfolio. Japanese lifers and banks have been the largest foreign buyers of long-dated US Treasuries for years, and their buying is famously price-insensitive on a hedged basis until it isn’t. When JGB yields rise enough that hedged domestic bonds out-yield hedged US Treasuries, that buying stops, and the marginal price-setter of the long end of the US curve disappears. The equity channel is indirect but real: higher US term premia mean higher discount rates, which mean lower fair values on long-duration growth stocks. Every carry unwind since 2020 has hit the Nasdaq harder than the Dow, and the August 2024 episode was no exception.
The Euro Area is the second-largest destination for Japanese capital and the second-largest carry-trade counterparty. Japanese insurers hold significant exposure to European sovereigns (particularly French OATs and Italian BTPs), and a portion of the European periphery’s tight spreads reflects that bid. A disorderly repricing of Japanese rates could widen peripheral spreads at precisely the moment the European Central Bank is trying to ease. There is also a currency feedback loop: a stronger yen weakens the dollar on some crosses, which compresses euro competitiveness in export markets.
Emerging Asia ex-China is the most under-discussed spillover channel. Indonesia, Thailand, the Philippines and Malaysia have significant yen-denominated debt, strong trade and investment ties with Japan, and equity markets that attract Japanese retail and institutional flow. A sharp yen appreciation makes servicing that debt more expensive while simultaneously making their exports less competitive against Japanese goods in third markets. In past Japanese tightening episodes these markets have tended to sell off sharply on a cross-asset basis even when their own fundamentals were fine.
China is a special case. The direct financial linkage is smaller than many assume - Japanese portfolio investment in mainland China is only around 3% of outward holdings, and the carry trade has not traditionally used renminbi as a long leg because of capital controls. But the second-order effects are large. Japan and China compete fiercely in automobiles, electronics, and capital goods. A stronger yen is a windfall for Chinese exporters, who can undercut Japanese competitors in Southeast Asia and Europe. This is happening just as Beijing is trying to manage a property deleveraging and an export-led growth rebalancing. Japanese rate hikes arguably help China on the margin, which is one of the few silver linings in the current macro picture and also explains why the yuan has been relatively stable through the 2025 yen volatility.
Russia is almost entirely disconnected from Japanese financial markets in the direct sense. Sanctions have severed most capital linkages, and Russian debt is not in anyone’s index. But Russia is deeply exposed to commodity prices, and commodity prices correlate with global liquidity. A carry-trade unwind that tightens global financial conditions tends to push oil and base metals lower, which hits Russian export revenue. The indirect channel matters more than the absent direct one.
North Africa - Egypt, Morocco, Tunisia, Algeria - is exposed mainly through the EM bond and currency channel. Egyptian Treasury bills have been a favorite carry trade destination in certain years because of their double-digit local yields, and a disorderly yen unwind tends to trigger outflows from all high-yield EM carry destinations at once. These are also countries with significant dollar-denominated external debt and thin reserves, so any tightening of global liquidity hits them quickly. The August 2024 episode saw EM local currency bond funds take meaningful outflows and several frontier currencies (though not Egyptian specifically) weaken sharply.
The Gulf states occupy an unusual position. They have large sovereign wealth funds that actually buy Japanese equities and real estate, and their fixed pegs to the dollar insulate them from direct FX volatility. But Gulf capital is recycled into global markets through the same funding channels as everyone else’s, and a yen-driven risk-off shock hits Saudi, Kuwaiti, and Emirati equity markets with a one-day lag as foreign flows reverse. Oil price exposure is the more meaningful channel: if a Japanese-triggered tightening slows global growth, Brent prices fall, and Gulf fiscal balances deteriorate. The 2024 and 2025 episodes have both shown this pattern in mild form.
The United Kingdom is, after the US and Euro Area, probably the third-most-exposed major economy. The City of London hosts an enormous amount of yen funding activity, Japanese banks have large London books, and gilts have been a secondary carry destination during some periods. A repeat of the August 2024 volatility on a larger scale would hit sterling, gilts, and UK bank equities in that order.
What to actually watch
The important question now is not whether Japanese yields will keep rising. They almost certainly will - Ueda has said so explicitly, the BoJ Governor himself acknowledged in late December that “Japan’s real policy interest rate is by far at the lowest level globally,” and inflation is running above target for the first time in a generation. The important question is whether the adjustment stays orderly or goes sideways again.
The three signals to track are, in order: the BoJ’s communication around each meeting, because that is the thing that triggered the August 2024 break; the demand at ultra-long JGB auctions, because weak auctions are the leading indicator of a private-sector duration buyers’ strike; and the USD/JPY exchange rate, because below about 150 the carry trade starts losing money on the FX leg alone, and below 145 the forced-covering dynamic kicks in. Recent 20-year JGB auctions have seen strong demand with bid-to-cover ratios above 4 - the strongest since 2020 - which is a reassuring sign. But the same sources note that any sustained deterioration in those metrics would signal a more disorderly phase ahead.
The second-order question is what all this means for US equity valuations. Every discount-rate-based model of stock prices has a term that is, directly or indirectly, a long-dated government bond yield. For most of the last decade, that yield was held down globally by the combined effect of the Fed’s QE and the BoJ’s yield curve control. The Fed stopped QE in 2022. The BoJ stopped YCC in 2024. The marginal price of global duration is now being set by private investors for the first time in fifteen years, and the early returns suggest private investors want more compensation for holding it than central banks did.
That is the part of this story that has not been priced into most risk assets. The August 2024 crash scared people for a week and then reverted. The December 2025 hike barely made the front page outside Japan. The consensus narrative is still that the BoJ will move slowly, that the carry trade will unwind in an orderly fashion, and that US growth stocks can keep compounding at valuations that require 10-year Treasury yields to trend lower, not higher. That consensus is one more Ueda press conference away from being tested.
Thirty years ago, Japan was where the deflation playbook was invented. The world adopted it with enthusiasm after 2008 and spent a decade pretending central bank balance sheets could absorb duration risk indefinitely. Japan is now where the unwind is being piloted, at live-fire scale, with the world’s largest debt load and half a trillion dollars of global carry positioning as the test subject. What happens in Tokyo over the next two years will write the first chapter of the post-QE era for everyone.
The good news is you can see it coming. The data is public. The mechanism is understood. The BoJ has told you, in remarkably plain language, what it intends to do. The bad news is that most portfolios are still positioned as if the zero is still there.
It is not.
Sources
Bank for International Settlements. “The market turbulence and carry trade unwind of August 2024.” BIS Bulletin No 90, August 2024. https://www.bis.org/publ/bisbull90.pdf
Wolf Richter. “Carry Trade at Risk: Japan’s 10-Year JGB Yield Hits 25-Year High, Yield Curve Steepens, Finance Ministry Verbally Props Up Yen.” Wolf Street, December 22, 2025. https://wolfstreet.com/2025/12/22/yen-carry-trade-at-risk-japans-10-year-jgb-yield-hits-25-year-high-yield-curve-steepens-finance-ministry-verbally-props-up-yen/
Financial Times. Coverage of rising Japanese government bond yields, fiscal stimulus expectations, and spillovers to global bond markets, December 4, 2025.
Invesco. Commentary on Japan’s joint fiscal-monetary outlook, supply-demand dynamics in the JGB market, and yen weakness, November 28, 2025.
DWS. “Japanese yields and the risk of global spillover.” Commentary, June 13, 2025.
International Monetary Fund. “Japan: Selected Issues.” 2025 Selected Issues Paper on JGB curve dynamics and macro-financial spillovers.
Federal Reserve Bank of St. Louis. FRED Economic Data. Series IRLTLT01JPM156N (Interest Rates: Long-Term Government Bond Yields: 10-Year: Main for Japan), IRLTLT01USM156N (same for United States), EXJPUS (Japan/US Foreign Exchange Rate), and GGGDTAJPA188N (General Government Debt for Japan). https://fred.stlouisfed.org
Bank of Japan. “Japanese Government Bonds Held by the Bank of Japan” statistical releases. https://www.boj.or.jp/en/statistics/boj/other/bond/index.htm/
Japan Ministry of Finance. “Japanese Government Bonds” data pages, including debt-management statistics and holder breakdowns. https://www.mof.go.jp/english/policy/jgbs/
Japan Bond Trading Co., Ltd. (JBTS). “JGB Rates” daily benchmark yields by maturity (2Y/5Y/10Y/20Y/30Y/40Y). https://www.bb.jbts.co.jp/en/historical/main_rate.html
International Monetary Fund. Coordinated Portfolio Investment Survey (CPIS), Japan’s outward portfolio investment positions, end-2023 data. https://data.imf.org/CPIS
Bagholder Brief. “Yen Carry Trade Unwind: BOJ Rate Hikes Drain Global Liquidity,” December 15, 2025. https://bagholderbrief.com/yen-carry-trade-unwind/
BeInCrypto. “Japan Signals More Hikes: Bitcoin Has Crashed After Every Single One,” January 5, 2026, and “Yen Carry Crypto Trading Over? Japan Signals Rate Hike,” December 1, 2025. https://beincrypto.com
Investing.com. “USD/JPY: Yen Carry Trade Back in Focus as BoJ Rate Hike Looms,” December 15, 2025.
Reuters. Coverage of the August 5, 2024 Nikkei crash and the BoJ’s July 31, 2024 policy decision.
Tradingeconomics. Japan 10-Year Government Bond Yield historical data and commentary, accessed April 2026. https://tradingeconomics.com/japan/government-bond-yield
Chronicle Journal / MarketMinute. “The Great Unwind: Bank of Japan’s Historic Rate Hike Signals a New Era for Global Capital,” December 19, 2025.

