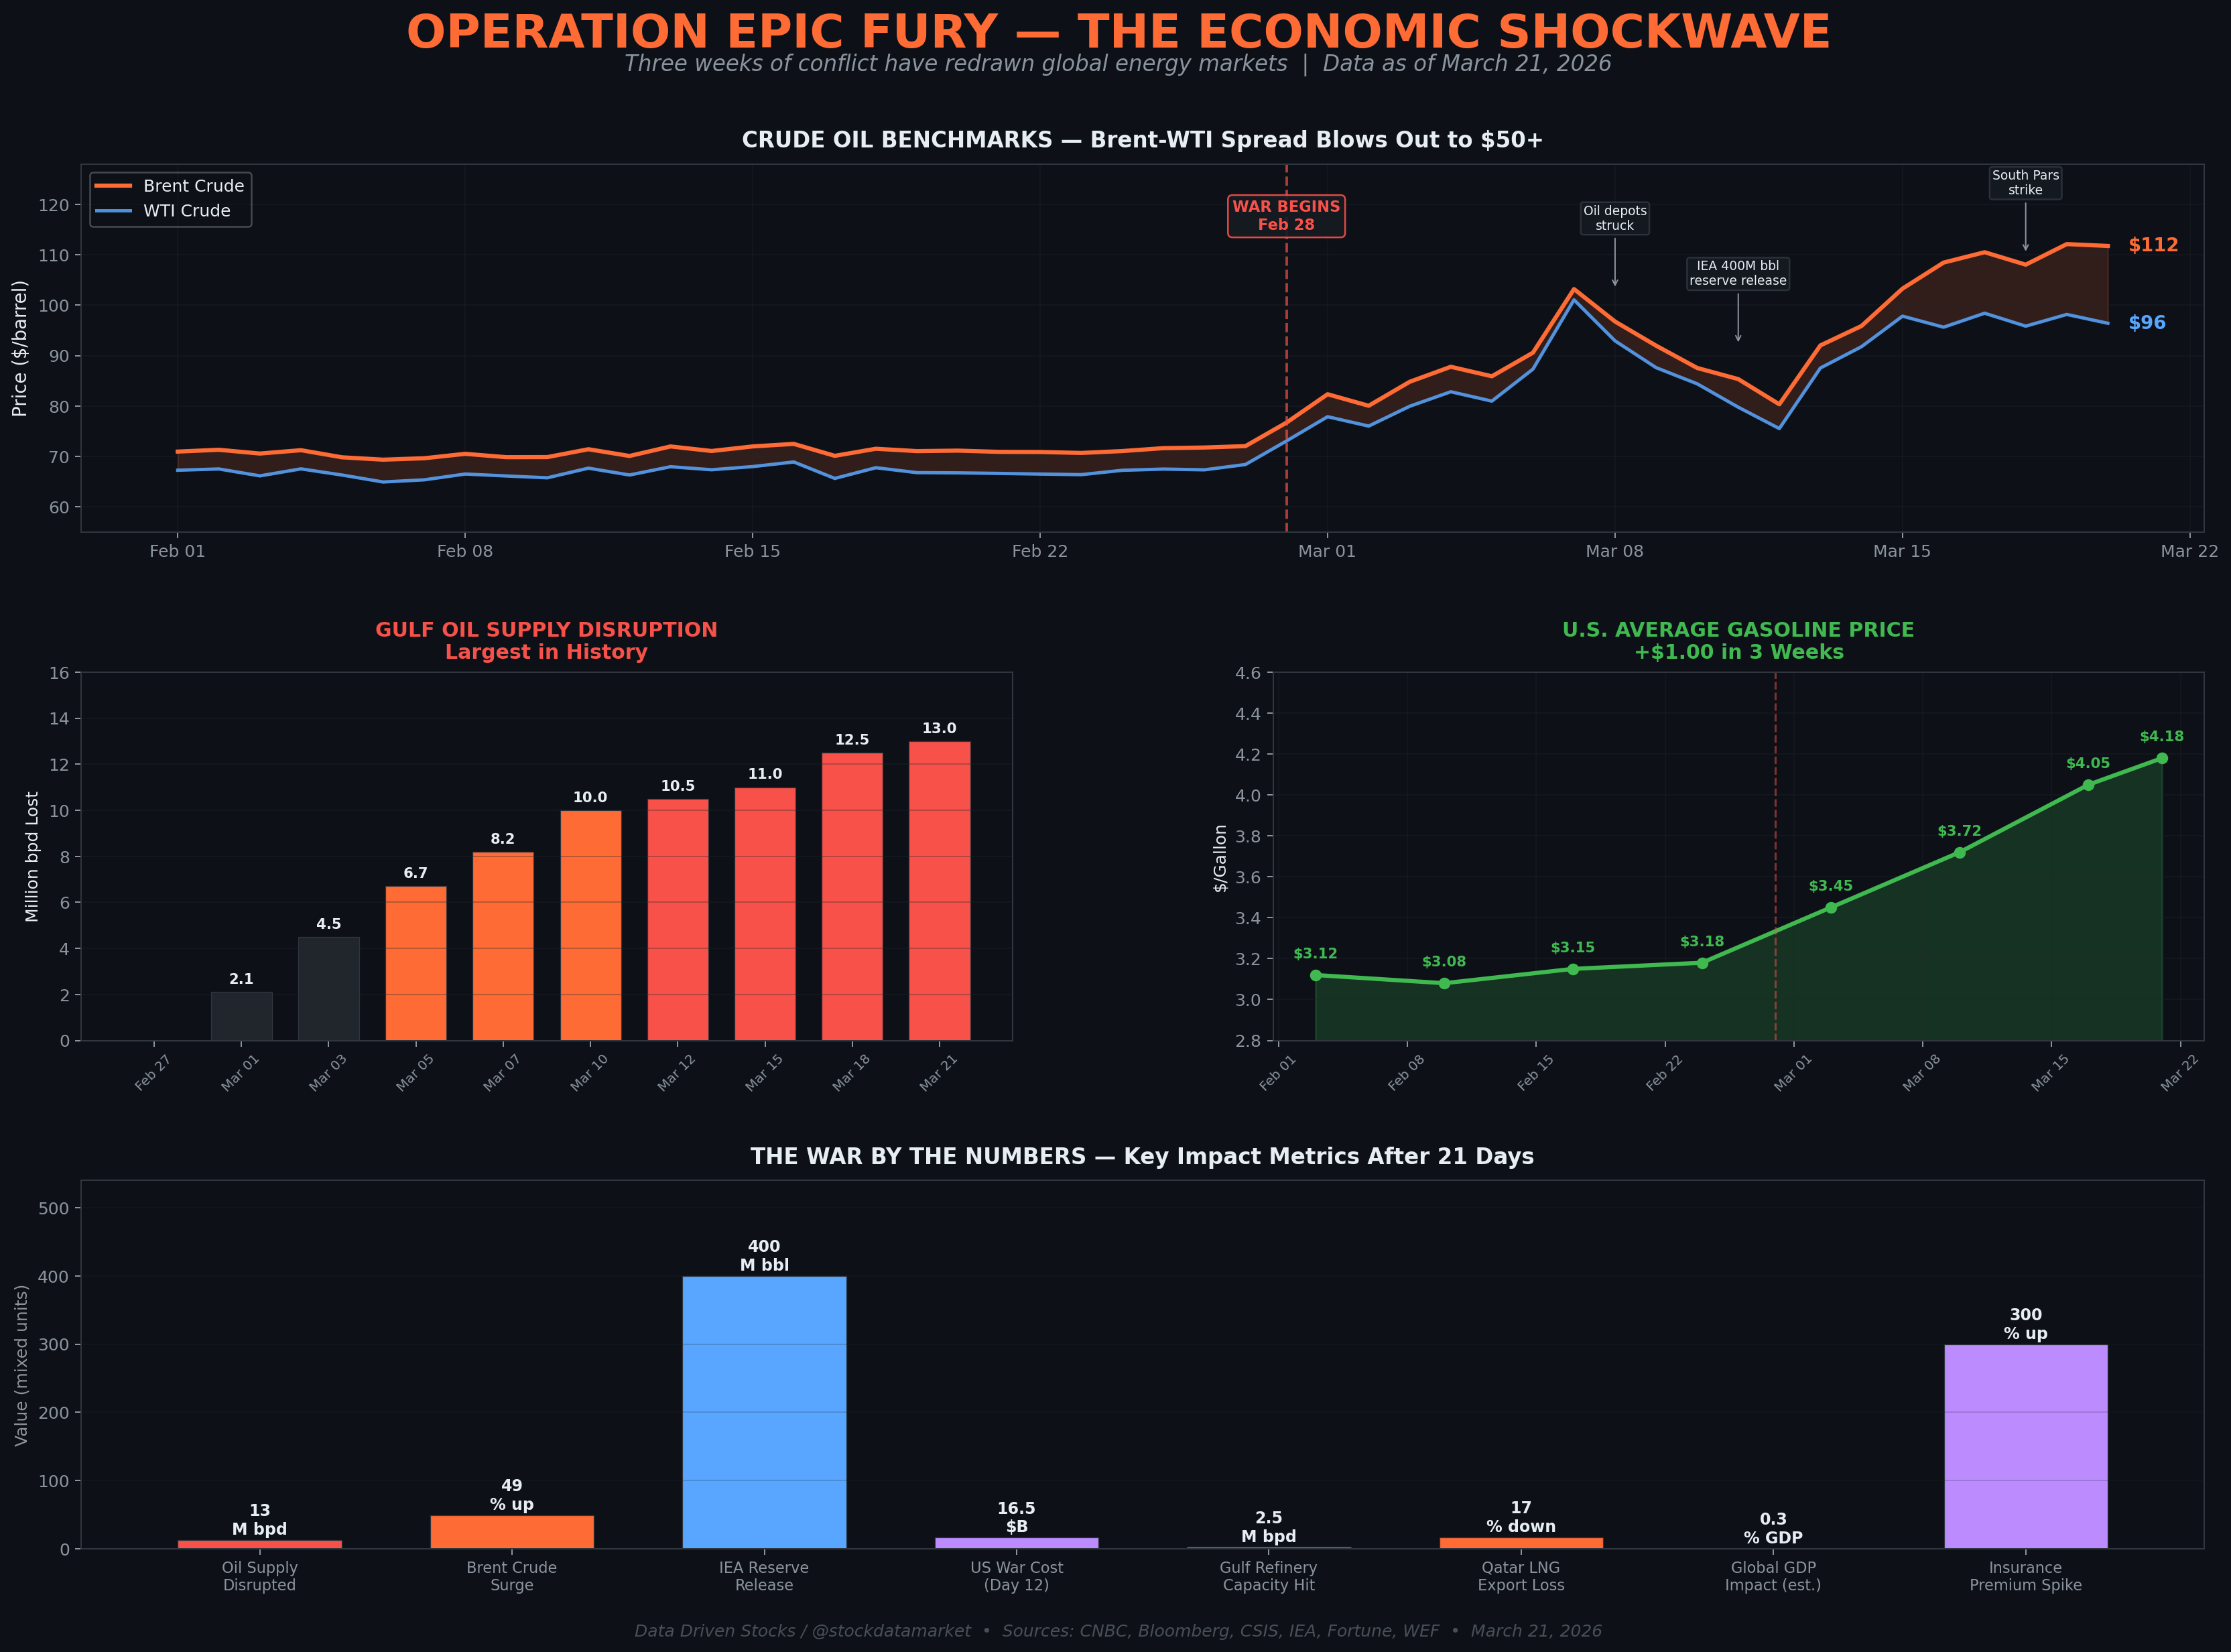
If the War in Iran Ends Tomorrow — Are We Going Back to Normal?
The damage is already done. Here’s why the world economy won’t snap back even if the bombs stop falling tonight.

There’s a comforting fantasy making the rounds on financial Twitter right now. It goes something like this: the ceasefire comes, the Strait of Hormuz reopens, oil drops back to $70, and we all go on with our lives like the last three weeks were just a bad dream.
That’s not how this works. That’s not how any of this works.
Three weeks into Operation Epic Fury, the US-Israeli military campaign against Iran that began on February 28, 2026, the damage to the global economy has already hardened into something far more durable than a temporary oil price spike. Energy infrastructure across the Persian Gulf has been struck, burned, and in some cases rendered inoperable for years. Nuclear facilities in Iran have been systematically degraded. The Strait of Hormuz — through which roughly 20% of the world’s daily oil and a fifth of global LNG trade flows — is functionally closed. Insurance markets have repriced the entire region. And the downstream effects — on inflation, on food, on semiconductors, on central bank policy — are only beginning to ripple outward.
Even the IEA’s director has called this the “greatest global energy security challenge in history.” That’s not hyperbole. The numbers back it up.
Let’s walk through the wreckage.
The Scale of What Happened
The 2026 Iran conflict didn’t creep up on anyone. Massive protests in January 2026 saw the Islamic Revolutionary Guard Corps crack down hard, killing thousands of demonstrators across more than a hundred Iranian cities. By late February, Trump was calling for regime change. On February 28, the bombs started falling.
In the first 100 hours alone, CSIS estimated the U.S. spent approximately $3.7 billion — most of it unbudgeted, most of it on munitions and interceptors. By day six, the Pentagon briefed Congress that costs had hit $11.3 billion. By day twelve, that figure reached $16.5 billion. The war cost tracker maintained by independent analysts now estimates roughly $1 billion per day in ongoing operational spending.
But the U.S. budgetary cost, as staggering as it is, barely scratches the surface of the total economic damage. This war’s real price tag is measured in destroyed refineries, shattered gas fields, grounded airlines, stranded tankers, and repriced risk across the entire global economy.
The Damage Ledger: What’s Already Broken

Let’s start with Iran itself, because the devastation there is on a different scale from everything else. U.S. and Israeli strikes have systematically targeted Iran’s military apparatus — its navy, air force, air defenses, missile production facilities, and command infrastructure. Netanyahu claimed this week that Iran’s navy is “lying at the bottom of the sea” and its air force is “nearly destroyed.” That’s political rhetoric, but the satellite imagery broadly supports it. Iran’s conventional military deterrent has been degraded to a degree that will take a decade or more to reconstitute.
The nuclear infrastructure is arguably the most consequential damage. Natanz, Fordow, and Isfahan have all been struck, some with American bunker-busters. The IAEA has acknowledged “enormous degradation” of physical facilities, though its director general has cautioned that enrichment knowledge and materials likely survive. The Arms Control Association noted that Iran entered 2026 with enough near-weapons-grade uranium for potentially ten nuclear weapons. The facilities to process it are now largely rubble, but the expertise and some materials remain — a dangerous combination for the post-war period.
Then there’s the energy infrastructure. Israel struck Iran’s Shahr Rey refinery in Tehran, causing massive fires. Oil storage depots around the capital were hit. Most critically, the South Pars gas field — which provides roughly 80% of Iran’s natural gas and is the backbone of the country’s electricity generation — was struck by Israeli forces on March 18. With natural gas powering most of Iran’s domestic energy, this attack alone threatens to make daily life in Iran dramatically worse for years.
But Iran’s strategy of “internationalizing the costs,” as the World Economic Forum put it, means the damage isn’t confined within its borders. Iranian retaliatory strikes have hit energy infrastructure across the Gulf: Ras Laffan in Qatar (the world’s largest LNG export facility, with 17% of export capacity knocked out), the Mina Al-Ahmadi refinery in Kuwait (the country’s largest), oil facilities in Fujairah and Abu Dhabi in the UAE, and the Shaybah oil field in Saudi Arabia. Dubai International Airport sustained damage from Iranian strikes. Planes in Kuwait were grounded after airport attacks.
The environmental monitoring organization CEOBS had identified over 300 distinct strike incidents across twelve countries as of March 10, with pollution risks ranging from fuel contamination to heavy metals to PFAS and dioxins from burning military sites.
The Strait of Hormuz: The Wound That Won’t Close Quickly
The Strait of Hormuz story is the single biggest reason the damage from this war can’t simply be undone by a ceasefire. Roughly 20 million barrels per day of crude oil and petroleum products, plus about a fifth of global LNG trade, transited the strait in 2025. Since the opening strikes on February 28, commercial traffic has been nearly halted. Iran mined parts of the strait, attacked commercial vessels, and made credible threats against any tanker attempting passage.
The U.S. Navy sank several Iranian minelaying vessels, and there have been claims of escorted passage, but as of this writing the strait remains functionally impaired for commercial shipping. Saudi Arabia, the UAE, Kuwait, and Iraq have all been forced to cut oil production because there is simply nowhere for the oil to go — storage is filling up, and export routes are blocked.
Even in the most optimistic scenario — a ceasefire followed by active mine-clearing and naval patrols — reopening the strait to full commercial traffic would take at minimum one to three months. The complexity of demining alone is enormous. And the insurance markets, which have repriced Gulf shipping risk by as much as 300%, won’t normalize for a year or more. Shipowners and insurers have learned a lesson in the last three weeks, and they won’t forget it quickly.
The Oil Market: Largest Supply Shock in History

The numbers here are almost hard to believe. At peak disruption, the combined oil production cut across Kuwait, Iraq, Saudi Arabia, and the UAE reached at least 10 million barrels per day by March 12 — and has since climbed further to an estimated 13 million bpd. That is the largest supply disruption in the history of the global oil market, full stop. The 1973 Arab embargo removed about 4.3 million bpd. The 1979 Iranian Revolution disrupted about 5.6 million. This war has more than doubled those figures.
Brent crude has surged roughly 50% from pre-war levels of around $72 to over $112 per barrel as of March 21. But as Bloomberg reported today, the headline Brent number actually understates the pain. Physical crude in Asia — where most Gulf oil was headed — is trading at levels far above paper futures. Dubai crude hit an all-time high above $150. Oman crude settled above $152. The Brent-WTI spread, which normally sits around $5-8, has blown out to over $50 — an unprecedented divergence that reflects the fact that this is primarily an Eastern Hemisphere supply crisis.
The IEA responded with the largest emergency reserve release in its history: 400 million barrels from member countries, with the U.S. committing 172 million barrels from the Strategic Petroleum Reserve over 120 days. So far, the reserves have done little to contain prices, because the problem isn’t a temporary shortage of stored oil — it’s that the physical pipeline of daily production and transit has been severed.
Goldman Sachs warned this week that Brent could exceed its 2008 all-time high of $147.50 if depressed flows through the strait persist for 60 days or more. Saudi officials reportedly told the Wall Street Journal they expect prices could reach $180 if disruptions last through late April. Citi raised its near-term Brent forecast to $120, with a bull case of $150.
How the Oil Shock Hits Your Wallet — And How Fast

Here’s where the research becomes particularly valuable for understanding what comes next. The pass-through from crude oil benchmarks to retail gasoline prices follows well-studied empirical patterns, and those patterns tell us something important: even if crude drops tomorrow, pump prices will stay elevated for weeks.
In the United States, the classic empirical finding by Borenstein and Cameron shows that nearly all of a crude oil increase passes through to the pump within about four weeks. The downward adjustment, however, takes roughly eight weeks — a well-documented asymmetry. That means the pain arrives fast and lingers. Right now, U.S. average gasoline has already climbed nearly a dollar in three weeks, according to AAA, representing the fastest weekly increase since Russia’s invasion of Ukraine. And it hasn’t finished absorbing the shock.
In Europe, the picture is more complex because of tax structures. The IMF has shown formally that countries with higher per-unit fuel excise taxes see a mechanically dampened crude-oil pass-through to retail prices — because so much of the pump price is fixed tax rather than variable crude cost. France’s research-grade data (millions of daily station-level observations analyzed by the Banque de France) shows full wholesale-to-retail pass-through in about three weeks, with roughly 80% of the wholesale change reflected at the pump. Germany takes longer — six to eight weeks — due to different market structures and lag dynamics.
The practical implication? Even in a best-case ceasefire scenario where Brent drops back to $85, European consumers won’t see relief at the pump until late April or May. For consumers in developing nations that rely heavily on imported refined products, the situation is even more dire.
The GDP Hit: Scenario Modeling

The macroeconomic damage breaks down along two distinct scenarios, and the gap between them is enormous.
In the short war scenario — a ceasefire by early April, oil averaging around $85 for the year — Capital Group estimates U.S. GDP growth could remain near 2.25% for 2026, with purchasing power declining by about 0.6%. Chatham House’s analysis is similar: under a quick resolution, the impact on global GDP would be “minimal,” with European inflation running only about 0.5 percentage points above pre-conflict forecasts. Painful but survivable.
The prolonged war scenario looks nothing like this. Capital Group’s Jared Franz warned that U.S. oil at $120 per barrel would cut GDP growth by 1.5 percentage points, bringing it to around 1% or less. Al Jazeera reported that economists now forecast eurozone growth collapsing to just 0.5% year-on-year, Chinese growth falling below 3%, and inflation peaking above 4% in the eurozone and 3% in the U.S. Oxford Economics identified $140 per barrel as the threshold at which the global economy tips into outright recession, with world GDP falling by 0.7% by year-end and pushing the UK, Eurozone, and Japan into contraction.
Moody’s has been even more direct. Their AI-based recession probability model had already put U.S. recession odds at 49% before the war — and their chief economist, Mark Zandi, warned that the oil shock would likely push that number above 50%. Every U.S. recession since World War II, apart from the pandemic, was preceded by a spike in oil prices. We’re living through that spike right now.
The WTO estimated this week that sustained high energy prices could trim 0.3% from global GDP for 2026. The IMF’s managing director, Kristalina Georgieva, stated that every 10% increase in oil prices, if sustained, pushes up global inflation by 0.4% and reduces worldwide output by up to 0.2%.
For emerging markets, the calculus is grimmer. India, heavily reliant on Middle Eastern crude with thinner strategic reserves, is already seeing the rupee weaken and inflation accelerate. Ethiopia, which sources most of its refined petroleum from the UAE, Saudi Arabia, and Kuwait, faces catastrophic price shocks. Debt-laden Global South countries may face a sovereign debt crisis if Global North central banks hike rates to combat energy-driven inflation.
The Semi-Permanent Damage: What Won’t Snap Back

This is the part of the analysis that matters most, and it’s the part that the “everything will be fine after a ceasefire” crowd is ignoring. Some of the damage from this war is effectively permanent on any human planning horizon. The rest ranges from months to decades.
Energy infrastructure repair timelines are measured in years, not weeks. Refineries are not light switches. A major refinery that has suffered blast damage, fire, and structural compromise cannot simply be restarted — it needs engineering assessment, component replacement, safety certification, and in many cases reconstruction. The Mina Al-Ahmadi refinery in Kuwait, the Gulf’s largest, suffered fires across multiple operational units. Ras Laffan in Qatar saw “extensive damage” from Iranian missiles, with 17% of the country’s LNG export capacity knocked out. Iran’s own Shahr Rey refinery was left burning. Each of these facilities represents months to years of repair work, during which time the global supply of refined products remains tighter than it was on February 27.
Iran’s South Pars gas field damage is potentially a multi-year reconstruction project. South Pars supplies roughly 80% of Iran’s natural gas, which in turn generates about 80% of the country’s electricity. The Israeli strike on the Asaluyeh gas processing complex damaged four processing plants. Full restoration of this capacity, even under peacetime conditions, would take two to five years given the specialized equipment, engineering, and investment required — and Iran’s access to international engineering firms and capital is severely constrained by sanctions.
Nuclear facility reconstruction could take five to ten years. The Natanz underground enrichment halls, Fordow, and Isfahan have all been struck. While Iran retains the intellectual capital and some materials, the physical infrastructure — centrifuge cascades, power systems, workshops, containment facilities — will take years and tens of billions of dollars to rebuild, assuming Iran even attempts it under post-war conditions.
The Strait of Hormuz will carry a risk premium for years. Even after demining and the resumption of commercial traffic, the insurance markets, shipping companies, and energy traders who price risk have learned something fundamental: this waterway can be shut down. That lesson will be embedded in every shipping insurance premium, every LNG long-term contract, and every strategic petroleum reserve calculation for the foreseeable future. Some analysts believe the war has permanently accelerated the diversification away from Hormuz-dependent energy routes — a structural shift that will reshape trade flows for a generation.
The “Gulf as safe haven” narrative is over. Dubai, Abu Dhabi, and Qatar spent decades and hundreds of billions of dollars building themselves into global financial, tourism, and logistics hubs. The pitch to expats, multinational corporations, and sovereign wealth funds was stability. That narrative has taken a direct hit. DW reported that the Gulf is unlikely to sustain pre-war investment spending levels during or after the conflict. Hotel bookings have plummeted. Major sporting events — the Bahrain Grand Prix, the Saudi Grand Prix, Dubai World Cup Night participants — have been canceled or disrupted. Rebuilding this confidence will take years of demonstrated stability.
Hidden chokepoints are now revealed. The WEF noted that Qatar produces around 40% of the world’s helium, which is essential for semiconductor manufacturing. Sulfur from Gulf petrochemical operations is a key input for fertilizer. These supply chains, previously invisible to most market participants, have been disrupted and will take time to reroute or rebuild. As the Chatham House analysis noted, crises like this have a way of revealing chokepoints that were previously hidden.
The Global Cascade: Beyond Oil
The economic damage from this war extends well beyond the direct energy shock. As the Deloitte analysis documented, Dutch TTF natural gas futures have risen 59% since the conflict began. Middle East granular urea futures — a key fertilizer input — have increased 34%. Wheat prices have moved higher on supply concerns. These are the ingredients of a classic cost-push inflation spiral that hits the world’s poorest and most food-insecure populations hardest.
Aviation has been hammered. Gulf airspaces are either shut or operating under severe restrictions, and the region’s biggest carriers are still struggling to restore pre-war flight volumes. The rerouting of flights away from Gulf airspace has added hours and fuel costs to routes connecting Europe and Asia, pushing ticket prices sharply higher on some routes. Jet fuel prices are spiking globally.
Financial markets are reflecting all of this. South Korea’s KOSPI suffered its biggest crash since 2008, dropping up to 12% in a single day and triggering circuit breakers. Pakistan’s KSE 100 saw its largest-ever single-day decline. Japan’s Nikkei dropped over 2%. Ten-year U.S. Treasury yields have risen 31 basis points since the conflict began, reflecting both inflation expectations and risk repricing. The U.S. federal deficit, already at 5.4% of GDP, faces further pressure from unbudgeted war spending that CSIS estimates in the tens of billions.
Central banks globally face an impossible choice: raise rates to fight energy-driven inflation (and risk tipping already fragile economies into recession) or hold rates and watch inflation erode purchasing power. Economists from Chile to Poland have already scaled back expectations for rate cuts. The European Central Bank may be forced to raise rates. The Bank of Japan is tightening.
So... Are We Going Back to Normal?
No. Not for a long time. And the definition of “normal” itself has shifted.
Even in the most optimistic scenario — a ceasefire within the next two weeks, a rapid (by historical standards) reopening of the Strait of Hormuz, and oil prices gradually declining toward the $70-80 range by year-end — the world economy in 2026 will look meaningfully different from what was forecast in January.
Global GDP growth will be lower. Inflation will be higher. Central banks will be more cautious. Insurance premiums on Gulf shipping will remain elevated for years. Investment in Gulf-based infrastructure will slow. Energy diversification — toward renewables, toward non-Hormuz-dependent supply routes, toward larger strategic reserves — will accelerate as a matter of national security policy, not just climate policy.
For Iran specifically, the damage is generational. Infrastructure that Iranian officials themselves valued at over $500 billion in needed repairs before this war has suffered tens of billions in additional destruction. The nuclear program has been set back years. The military has been degraded to a level that will take a decade to rebuild. The civilian population faces electricity shortages, gas shortages, and an economy in freefall.
For the Gulf states, the war has exposed a vulnerability that decades of diversification and defense spending failed to fully address: proximity to Iran means proximity to Iranian retaliation. That geographic fact won’t change with a ceasefire.
And for everyone else — from a commuter in Montpellier paying more at the pump, to a factory worker in Shenzhen facing higher input costs, to a farmer in Ethiopia unable to afford fertilizer — the damage from these three weeks will echo through the economy for months and years to come.
The bombs may stop. The damage won’t.
Data Driven Stocks / @stockdatamarket
Sources
Wikipedia, “Economic impact of the 2026 Iran war,” accessed March 21, 2026.
CSIS, Mark F. Cancian and Chris H. Park, “$3.7 Billion: Estimated Cost of Epic Fury’s First 100 Hours,” February 20, 2026.
CSIS, “Iran War Cost Estimate Update: $11.3 Billion at Day 6, $16.5 Billion at Day 12,” March 2026.
Fortune, “Oil prices hit nearly $110 as Iran vows to escalate,” March 18, 2026.
CNBC, “Crude prices close higher as market weighs threats to tankers against IEA oil stockpile release,” March 11, 2026.
CNBC, “Oil tops $112 after Iraq declares force majeure due to Iran war,” March 20, 2026.
CNBC, “Oil prices: Analysts raise the alarm as crude soars over Iran war,” March 9, 2026.
CNBC, “Brent oil prices could surge past record high if Iran war disruption persists, Goldman says,” March 20, 2026.
Bloomberg, “Iran War: Brent Benchmark Surges While Real-World Oil Costs Climb Even Higher,” March 21, 2026.
World Economic Forum, “The global price tag of war in the Middle East,” March 2026.
Chatham House, “How will the Iran war affect the global economy?,” March 2026.
Al Jazeera, “How badly has the Iran war hit the global economy? The tell-tale signs,” March 16, 2026.
Deloitte Insights, “Iran and Middle East conflict impacts global economy,” March 2026.
Capital Group, “How the Iran war changes the economic outlook,” March 2026.
Euronews, “Moody’s says a US recession is increasingly ‘hard to avoid’ amid Iran war,” March 18, 2026.
Council on Foreign Relations, “The Iran War’s Global Economic Impact,” March 2026.
NPR, “Trump says he mulls ‘winding down’ the Iran war,” March 20, 2026.
PBS, “Iran intensifies attacks on Gulf energy sites after Israel struck its key gas field,” March 19, 2026.
Arms Control Association, “The U.S. War on Iran: New and Lingering Nuclear Risks,” March 2026.
CEOBS, “Operation Epic Fury: emerging environmental harm and risks in Iran and the region,” March 2026.
AP / News-Herald, “The targeting of key Gulf energy infrastructure raises the risk of long-term disruption,” March 19, 2026.
The Conversation, “Targeting of energy facilities turned Iran war into worst-case scenario for Gulf states,” March 2026.
Al Jazeera, “The US-Israeli strategy against Iran is working. Here is why,” March 16, 2026.
CNN, “Oil surges and stock futures sink as war in Iran threatens crude supply,” March 1, 2026.
Wikipedia, “Economic impact of the Iran-Israel proxy conflict,” accessed March 21, 2026.
Iran War Cost Tracker (iran-cost-ticker.com), accessed March 21, 2026.
WarCosts.org, “Iran War (2026) — Cost, Casualties & Analysis,” accessed March 21, 2026.
EIA, STEO Petroleum Product Price Module methodology documentation.
Borenstein & Cameron, empirical pass-through estimates
Banque de France, French station-level price pass-through research (2007-2018).
IMF, fuel excise tax and oil-price pass-through analysis.
IMF World Economic Outlook, January 2026 Update.

