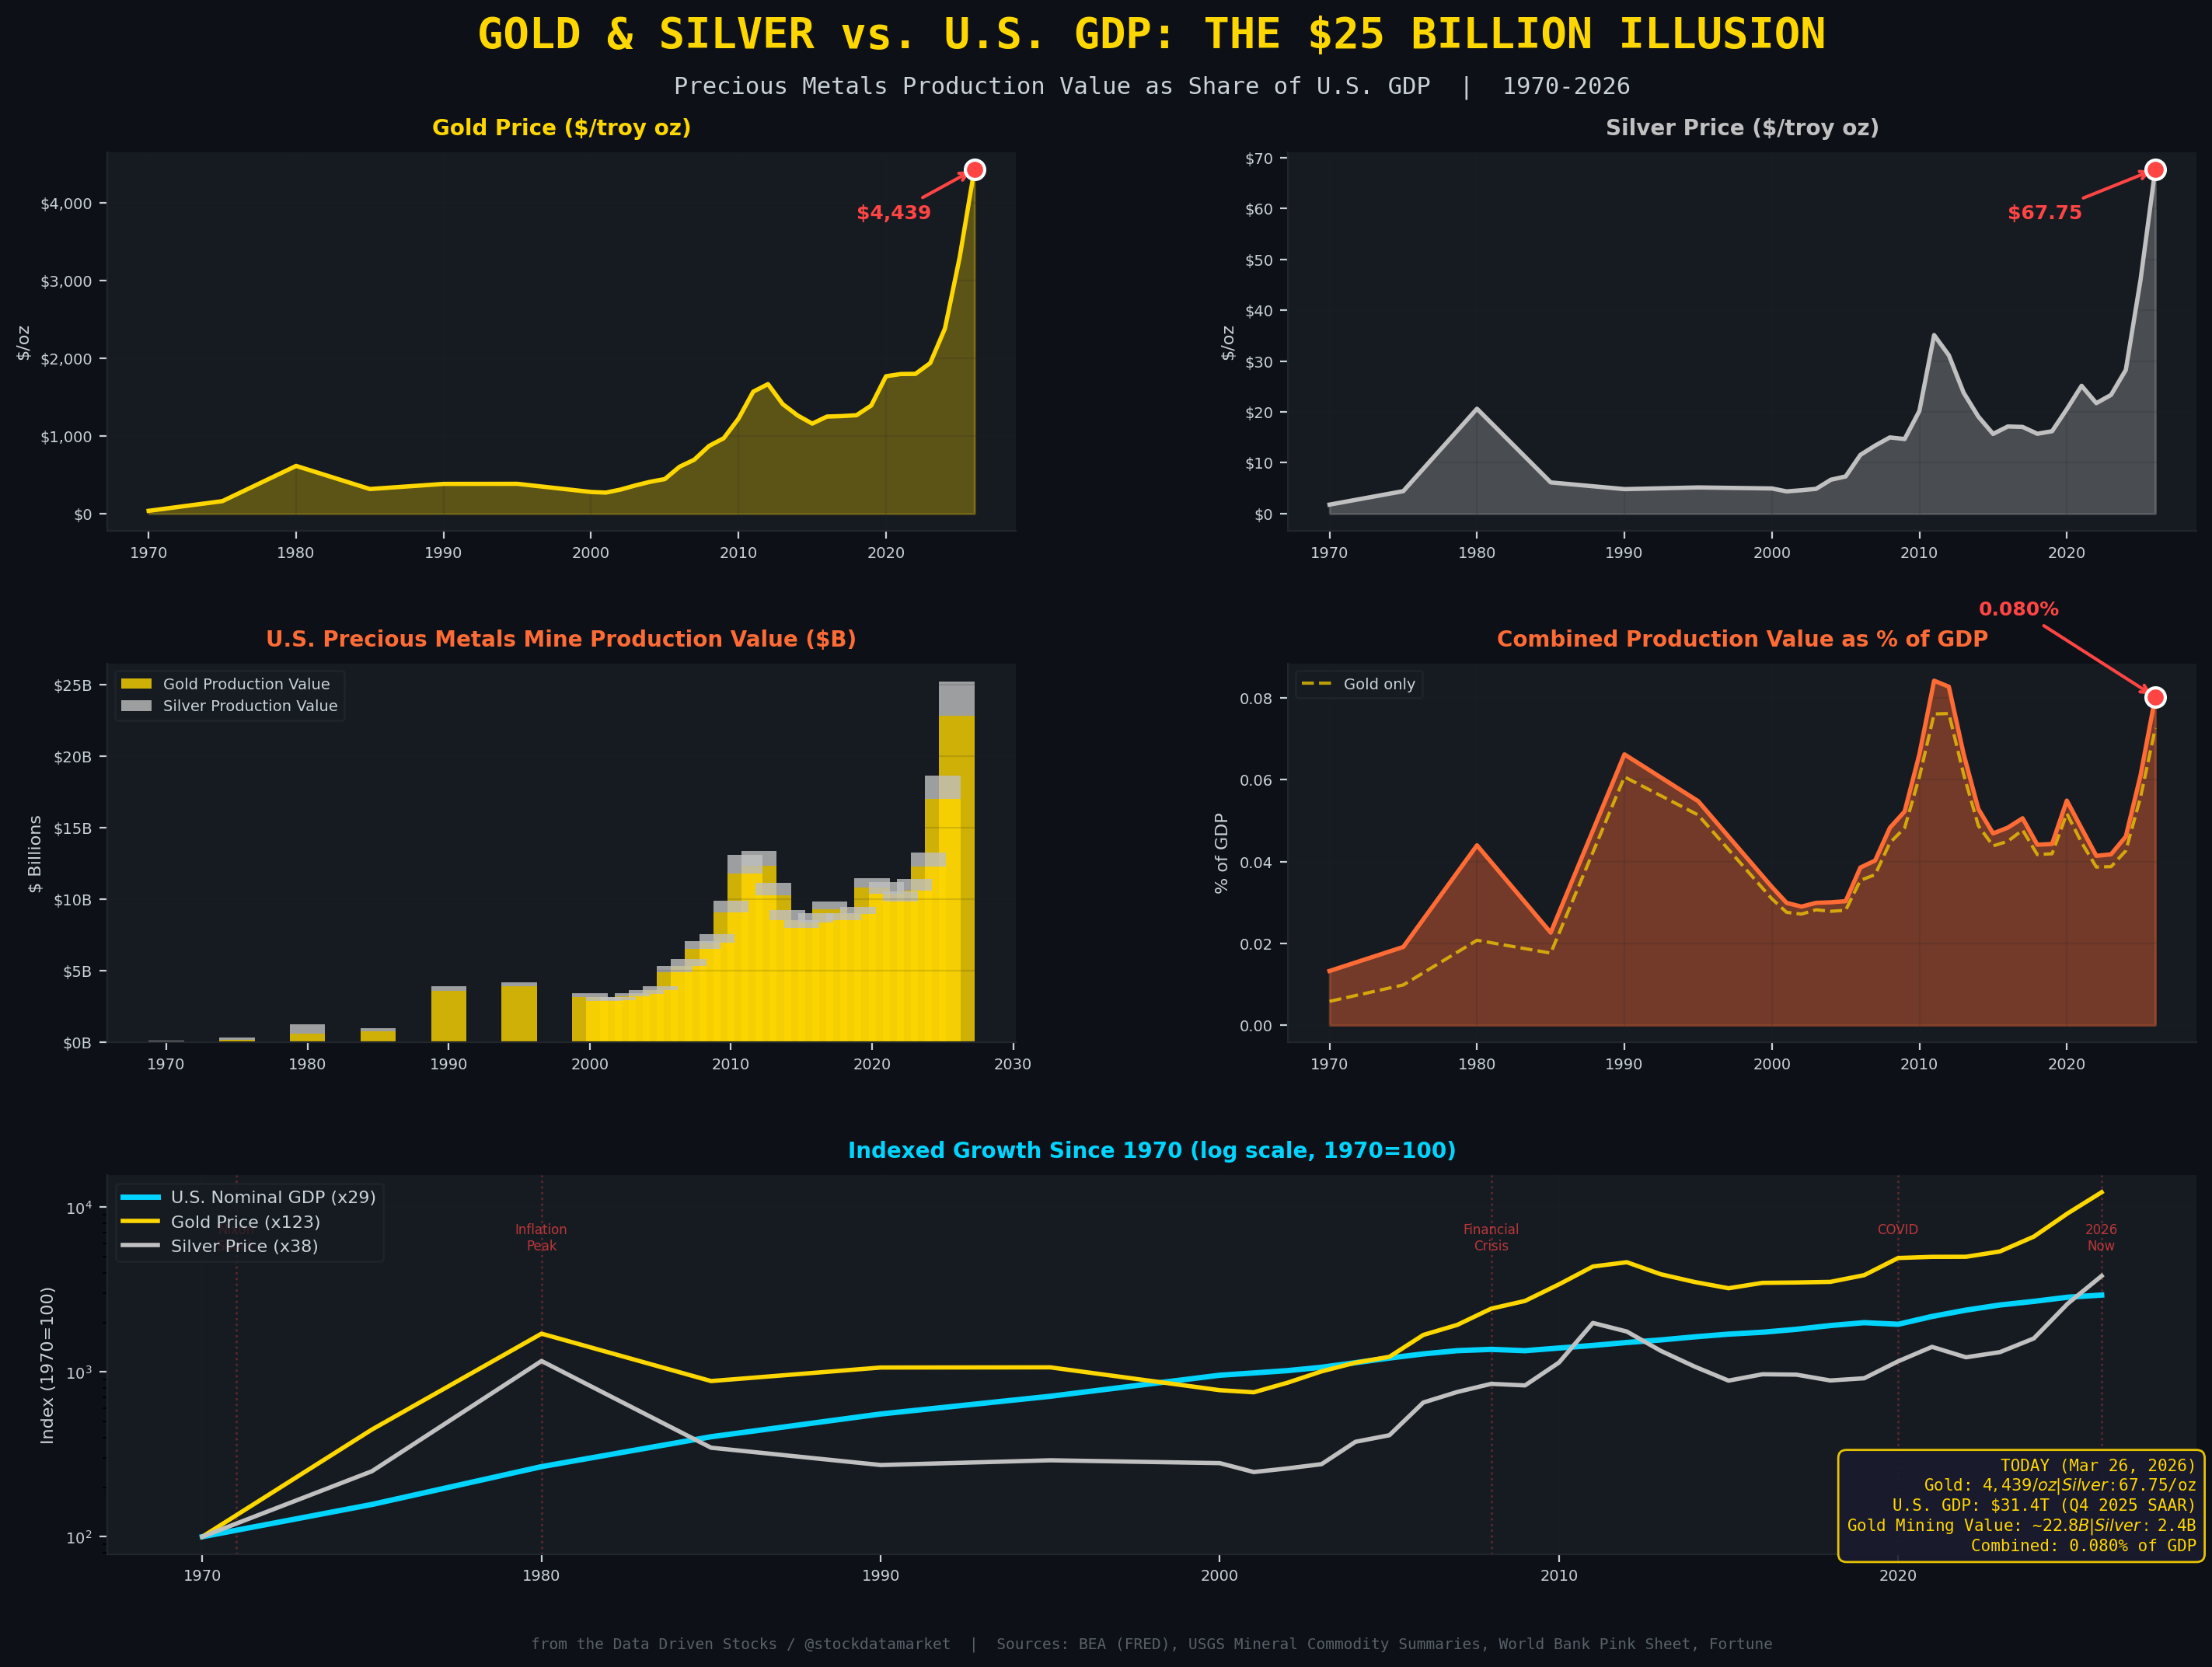
Gold at $4,400 and Silver at $68: Why Precious Metals Still Barely Move the Needle on U.S. GDP in 2026
The $25 billion illusion - how record-high gold and silver prices translate to less than 0.08% of America’s $31.4 trillion economy, and why that number is important than you think

Gold just cracked $4,400 an ounce. Silver is trading at $67.75. If you scroll through financial Twitter right now, you will find no shortage of people screaming about the precious metals rally and what it means for the U.S. economy. But here is the thing nobody wants to hear: even at these absolutely historic price levels, the combined value of all gold and silver mined in the United States contributes roughly 0.08% to GDP. That is eight hundredths of one percent. Not eight percent. Not even one percent. Zero point zero eight.
Let that sink in.
We are living through the most aggressive gold rally in modern history, with prices up roughly 45% year-over-year, silver having more than doubled from its early 2025 levels after briefly surging past 150% gains earlier in March, and yet the direct economic footprint of these metals in the U.S. economy is smaller than what Americans spend on pet grooming in a year.
This article breaks down exactly how gold and silver interact with U.S. GDP, why the relationship is far more nuanced than a simple “price goes up, economy benefits” story, and what the 2026 numbers look like compared to every major crisis and rally since 1970.
The Numbers Right Now
As of March 26, 2026, gold is trading at $4,439 per ounce according to Fortune’s daily price tracker, down $126 from yesterday’s $4,565 but still up roughly $1,383 over the past twelve months. Silver sits at $67.75 per ounce, having pulled back sharply from its early March highs above $80. The gold-to-silver ratio has compressed to about 65:1, which is right around its historical average after spending most of the last decade above 70:1.
U.S. nominal GDP, per the Bureau of Economic Analysis second estimate released on March 13, 2026, stands at $31.44 trillion on a seasonally adjusted annual rate basis as of Q4 2025. Real GDP growth decelerated sharply to just 0.7% annualized in Q4 2025 - down from 4.4% in Q3 - dragged lower by the October-November government shutdown, weakening exports, and cooling consumer momentum. Goldman Sachs still projects full-year 2026 GDP growth of 2.8%, while Morgan Stanley is more cautious at 2.4%, citing the Strait of Hormuz disruption and $100-plus oil as persistent headwinds.
So where do gold and silver fit into this $31.4 trillion machine?
The Direct Channel: Mining Value Added
The most straightforward way precious metals enter GDP is through mining. When a company like Barrick Gold or Newmont extracts ore from the ground in Nevada, refines it, and sells it, that production creates economic value: wages for miners, profits for shareholders, taxes to state and local governments, and payments for energy, equipment, and processing services.
According to the USGS Mineral Commodity Summaries for 2026, U.S. gold mine production in 2025 was approximately 160 metric tons, with an estimated value of roughly $17 billion at 2025 average prices. At today’s spot price of $4,439, that same production volume translates to a gross value of roughly $22.8 billion. Nevada accounts for about 64% of domestic gold output, with Alaska contributing around 22%. The top 26 operations produce approximately 97% of all mined gold in the country, and commercial-grade gold flows through roughly 15 refineries.
Silver is a considerably smaller story in dollar terms. U.S. mine production runs at roughly 1,100 metric tons per year (2024 USGS estimate), and at today’s $67.75 per ounce that translates to about $2.4 billion in gross production value - up from the USGS’s 2024 valuation of about $960 million at that year’s lower average prices. Much of U.S. silver comes as a byproduct of copper and other base-metal mining rather than from dedicated silver operations.

Combined, that is roughly $25.2 billion in gross production value. Sounds like real money, right? Except GDP does not count gross production value. It counts value added - which is gross output minus intermediate inputs like energy, chemicals, equipment depreciation, and purchased services. The actual value added from precious metals mining is substantially lower than $25 billion, probably somewhere in the $10-15 billion range once you strip out all those intermediate costs.
For context, the entire U.S. mining sector (including oil, gas, coal, and every other mineral) contributes about 1.2% of GDP according to the BEA’s Value Added by Industry series on FRED. Metal ore mining is a subset of that at roughly 0.12%. Gold and silver mining is a subset of that subset. We are talking about an economic contribution so small that the BEA does not even break it out into its own line item in most published tables.
The Accounting Trick: Why Gold Is Not Like Other Commodities
Here is where it gets interesting, and where most people analyzing gold’s GDP impact go wrong. The Bureau of Economic Analysis treats gold differently from virtually every other commodity when it comes to trade accounting in the National Income and Product Accounts.

Most commodities flow through GDP via a simple path: if the U.S. exports more soybeans than it imports, net exports go up and GDP benefits. If we import more oil than we export, the trade deficit widens and that subtracts from GDP. Straightforward.
Gold does not work this way. The BEA explicitly treats many nonmonetary gold cross-border flows as financial-asset transactions rather than trade in newly produced goods and services. In the GDP calculation, the BEA replaces the International Transactions Account exports and imports of nonmonetary gold with an adjustment equal to domestic production of gold minus gold used for industrial purposes. The difference between the ITA gold flows and the GDP adjustment gets recorded in the statistical discrepancy.
Why does this matter? Because without this adjustment, a single large bullion shipment from London to New York could spike U.S. GDP by billions of dollars in a quarter, and a reverse shipment could crash it, even though no new economic value was actually created. The BEA built this firewall specifically to prevent gold’s unique nature as both a commodity and a financial asset from creating false volatility in GDP measurement.
Silver, notably, does not receive this special treatment. It behaves like a normal traded good in the accounts, though the U.S. is a significant net importer with import reliance around 64% of apparent consumption in 2024 according to USGS data.
The Financial Services Channel: Fees, Not Gains
The third way gold and silver prices affect GDP is through financial services. When the SPDR Gold Trust (GLD) manages $70-plus billion in assets at a 0.40% expense ratio, that generates real service revenue that counts as GDP. When brokers execute precious metals trades, when vaults store bullion, when the U.S. Mint strikes American Eagle coins - all of that economic activity contributes to GDP.
But here is the critical distinction that trips up most casual analysts: the appreciation in the value of gold holdings is NOT GDP. If you bought gold at $2,000 and it went to $4,400, that $2,400 per ounce gain is a capital gain on an asset transaction. GDP measures the production of goods and services, not asset price appreciation. The fee that your broker charged you to buy the gold? That is GDP. The profit that the mining company earned extracting it? GDP. The gain in your portfolio? Not GDP.
This is why people who argue that the gold rally is “adding hundreds of billions to the economy” are fundamentally confusing asset revaluation with economic production. The U.S. holds approximately 8,134 metric tons of gold in official reserves. At $4,400 an ounce, that gold is worth roughly $1.16 trillion. But none of that appreciation flows through GDP unless it generates actual economic services activity.
The Indexed Growth Divergence: 123x vs. 29x

One of the most visually striking things about the gold story since 1970 is the sheer divergence in growth rates. Since Nixon closed the gold window in August 1971, ending the Bretton Woods era of dollar-gold convertibility at $35 per ounce, the price of gold has multiplied roughly 123 times. Silver has grown about 38x over the same period. U.S. nominal GDP, meanwhile, expanded about 29x, from $1.07 trillion to $31.4 trillion.
So gold has outpaced GDP by more than four to one in price terms. That sounds like it should be economically significant. But the key variable most people miss is production volume. In 1990, the U.S. was producing around 294 metric tons of gold per year, near its all-time peak as Nevada’s Carlin Trend reached maximum output. By 2026, that number has fallen to 160 metric tons. American gold production has roughly halved over 35 years even as the price per ounce rose more than tenfold.
The result is that the gross dollar value of U.S. gold production has increased enormously, from about $3.5 billion in 1990 to $22.8 billion in 2026, but as a share of the much-larger economy, the needle has barely moved. In the early 1990s, gold and silver mining contributed roughly 0.05% of GDP. Today, at record prices, it is about 0.08%. That is a 60% increase in share, sure, but 60% of almost nothing is still almost nothing.
2026 vs. Every Past Crisis and Rally

The data reveals something counterintuitive when you line up 2026 against every major gold episode since 1970.
During the 1980 inflation peak, when gold hit $615 per ounce (which felt astronomical at the time), the combined gold and silver production value was about 0.044% of GDP. In 2008, during the financial crisis, the ratio was roughly 0.048%. During the 2011 eurozone debt crisis, when gold breached $1,572, combined production hit 0.084% of GDP - slightly higher than today’s 0.080%. Despite the fact that gold is now nearly three times its 2011 price, the GDP share is essentially flat because the denominator - the U.S. economy itself - has doubled from $15.5 trillion to $31.4 trillion.
In other words, gold and precious metals are running as fast as they can just to maintain the same microscopic share of economic output. The economy is growing so large that even a $4,400 gold price cannot materially change the ratio.
J.P. Morgan Global Research forecasts silver to average $81 per ounce across 2026, roughly double its 2025 average. Even if that forecast plays out and gold holds above $4,000, the combined precious metals mining contribution to GDP would still be less than one-tenth of one percent.
The Gold-to-Silver Ratio and What It Tells Us

The gold-to-silver ratio sits at roughly 65:1 in late March 2026, meaning it takes 65 ounces of silver to buy one ounce of gold. This is near the historical average of about 64:1 dating back to 1970, but it represents a significant compression from the extreme levels above 85:1 seen during COVID in 2020.
Silver’s outperformance of gold over the past year - more than doubling while gold gained roughly 45% - reflects what J.P. Morgan’s Greg Shearer calls the “sister metals” dynamic amplified by tariff uncertainty. Earlier in March, silver was up over 150% year-over-year before the recent pullback compressed those gains. The initial Section 232 investigation on silver imports did not result in tariffs, but the optionality of future tariffs drove physical metal into U.S. vaults, tightening liquidity abroad and creating an outsized price move. Silver’s dual nature as both a precious metal and an industrial input (solar panels, electronics, electric vehicles) gives it additional demand vectors that gold lacks.
But even with silver’s remarkable rally, its mine production value remains a rounding error. At $2.4 billion, it is roughly equivalent to the annual revenue of a mid-cap regional bank. For comparison, Apple’s revenue alone is about $391 billion, or roughly 15 times the combined value of all gold and silver mined in the United States.
The Indirect Channel: Gold as Economic Thermometer
If the direct channels are small, why do economists pay any attention to gold at all?
Because the real significance of gold prices is not what they add to GDP but what they signal about the macro environment. Research from the Federal Reserve Bank of Chicago argues that the post-2001 rise in real gold prices is better explained by unusually low long-term real interest rates and growing pessimism about future economic activity than by changes in inflation expectations alone. Gold, in this framework, functions primarily as a barometer of financial stress and monetary conditions, not as an engine of production.
This interpretation makes intuitive sense in 2026. Gold’s surge from around $2,600 in early 2025 to a record above $5,500 in January 2026 - before correcting to current levels around $4,400 - coincides with a period of extraordinary macro uncertainty: the October-November 2025 government shutdown, the Strait of Hormuz disruption pushing oil above $100, Q4 2025 GDP collapsing to 0.7% growth, mounting “stagflation” concerns, and persistent tariff-related trade volatility. Gold is not causing any of these economic headwinds. It is reflecting them.
IMF research on metals price shocks using production-network models and local projections finds that metals price increases can have significant and persistent inflation effects depending on a country’s input-output exposure. But this work focuses primarily on industrial metals with broad supply-chain linkages, not gold, which sits largely outside the production network as a financial asset. Silver, with its industrial applications, has somewhat more input-output relevance, but its share of production costs in electronics, solar, and other downstream industries is still tiny.
The Bottom Line
Gold is at record highs. Silver is having a generational rally. Precious metals are dominating financial media headlines and retail investor conversations. And yet their direct contribution to U.S. economic output remains almost imperceptibly small.
The entire U.S. precious metals mining sector generates roughly $25 billion in gross production value, maybe $10-15 billion in GDP-counted value added, out of a $31.4 trillion economy. That is less than 0.08% of GDP. The BEA’s special accounting treatment for nonmonetary gold prevents bullion flows from distorting the numbers further. And the appreciation in the value of gold holdings - the thing that actually excites investors - does not count as GDP at all.
None of this means gold and silver are economically irrelevant. Their price movements carry important information about real interest rates, financial stress, inflation expectations, and geopolitical risk. The mining sector supports thousands of direct jobs across Nevada, Alaska, and other producing states, and generates meaningful tax revenue in those communities. The financial services ecosystem built around precious metals (ETFs, futures exchanges, custody, refining) represents a significant, if niche, services industry.
But the next time someone tells you that $4,400 gold is “transforming the U.S. economy,” ask them a simple question: 0.08% of what?
This analysis uses gross production value as an upper bound. Actual GDP value added (which subtracts intermediate inputs) is lower. Mining sector value added data from BEA is available at the “mining” aggregate level but is not broken out specifically for gold and silver in published quarterly tables.
Citations:
U.S. Bureau of Economic Analysis, “GDP (Second Estimate), 4th Quarter and Year 2025,” released March 13, 2026. FRED Series GDP, Q4 2025: $31,442.483 billion SAAR.
U.S. Bureau of Economic Analysis, “Value Added by Industry: Mining as a Percentage of GDP” (FRED series VAPGDPM), Q3 2025: 1.2%.
U.S. Geological Survey, Mineral Commodity Summaries 2026, Gold chapter. U.S. gold mine production ~160 metric tons, estimated value ~$17 billion (at 2025 average prices), Nevada ~64%, Alaska ~22%.
U.S. Geological Survey, Mineral Commodity Summaries 2025, Silver chapter. U.S. silver mine production ~1,100 metric tons, net import reliance ~64%.
Fortune, “Current price of gold: March 26, 2026.” Gold at $4,439/oz as of 9:10 a.m. ET.
Fortune, “Current price of silver: March 26, 2026.” Silver at $67.75/oz as of 8:45 a.m. ET.
U.S. Bureau of Economic Analysis, NIPA Methodology: “Treatment of Gold in the National Income and Product Accounts.” BEA replaces ITA nonmonetary gold exports/imports with domestic production minus industrial use adjustment.
World Bank Prospects Group, Commodity Price Data (”Pink Sheet”), Historical Monthly and Annual series.
J.P. Morgan Global Research, “How Will Silver Prices Fare in 2026?” Silver price forecast averaging $81/oz for 2026.
Federal Reserve Bank of Chicago, Chicago Fed Letter on gold prices and real interest rates, analysis of post-2001 gold price dynamics.
IMF Research, Commodities Unit, Primary Commodity Prices technical documentation and production-network research on metals price shock transmission.
SPDR Gold Trust (GLD) Prospectus, gross expense ratio of 0.40%.
U.S. Geological Survey, Historical Statistics for Mineral and Material Commodities (Data Series 140), gold and silver long-run production series.

