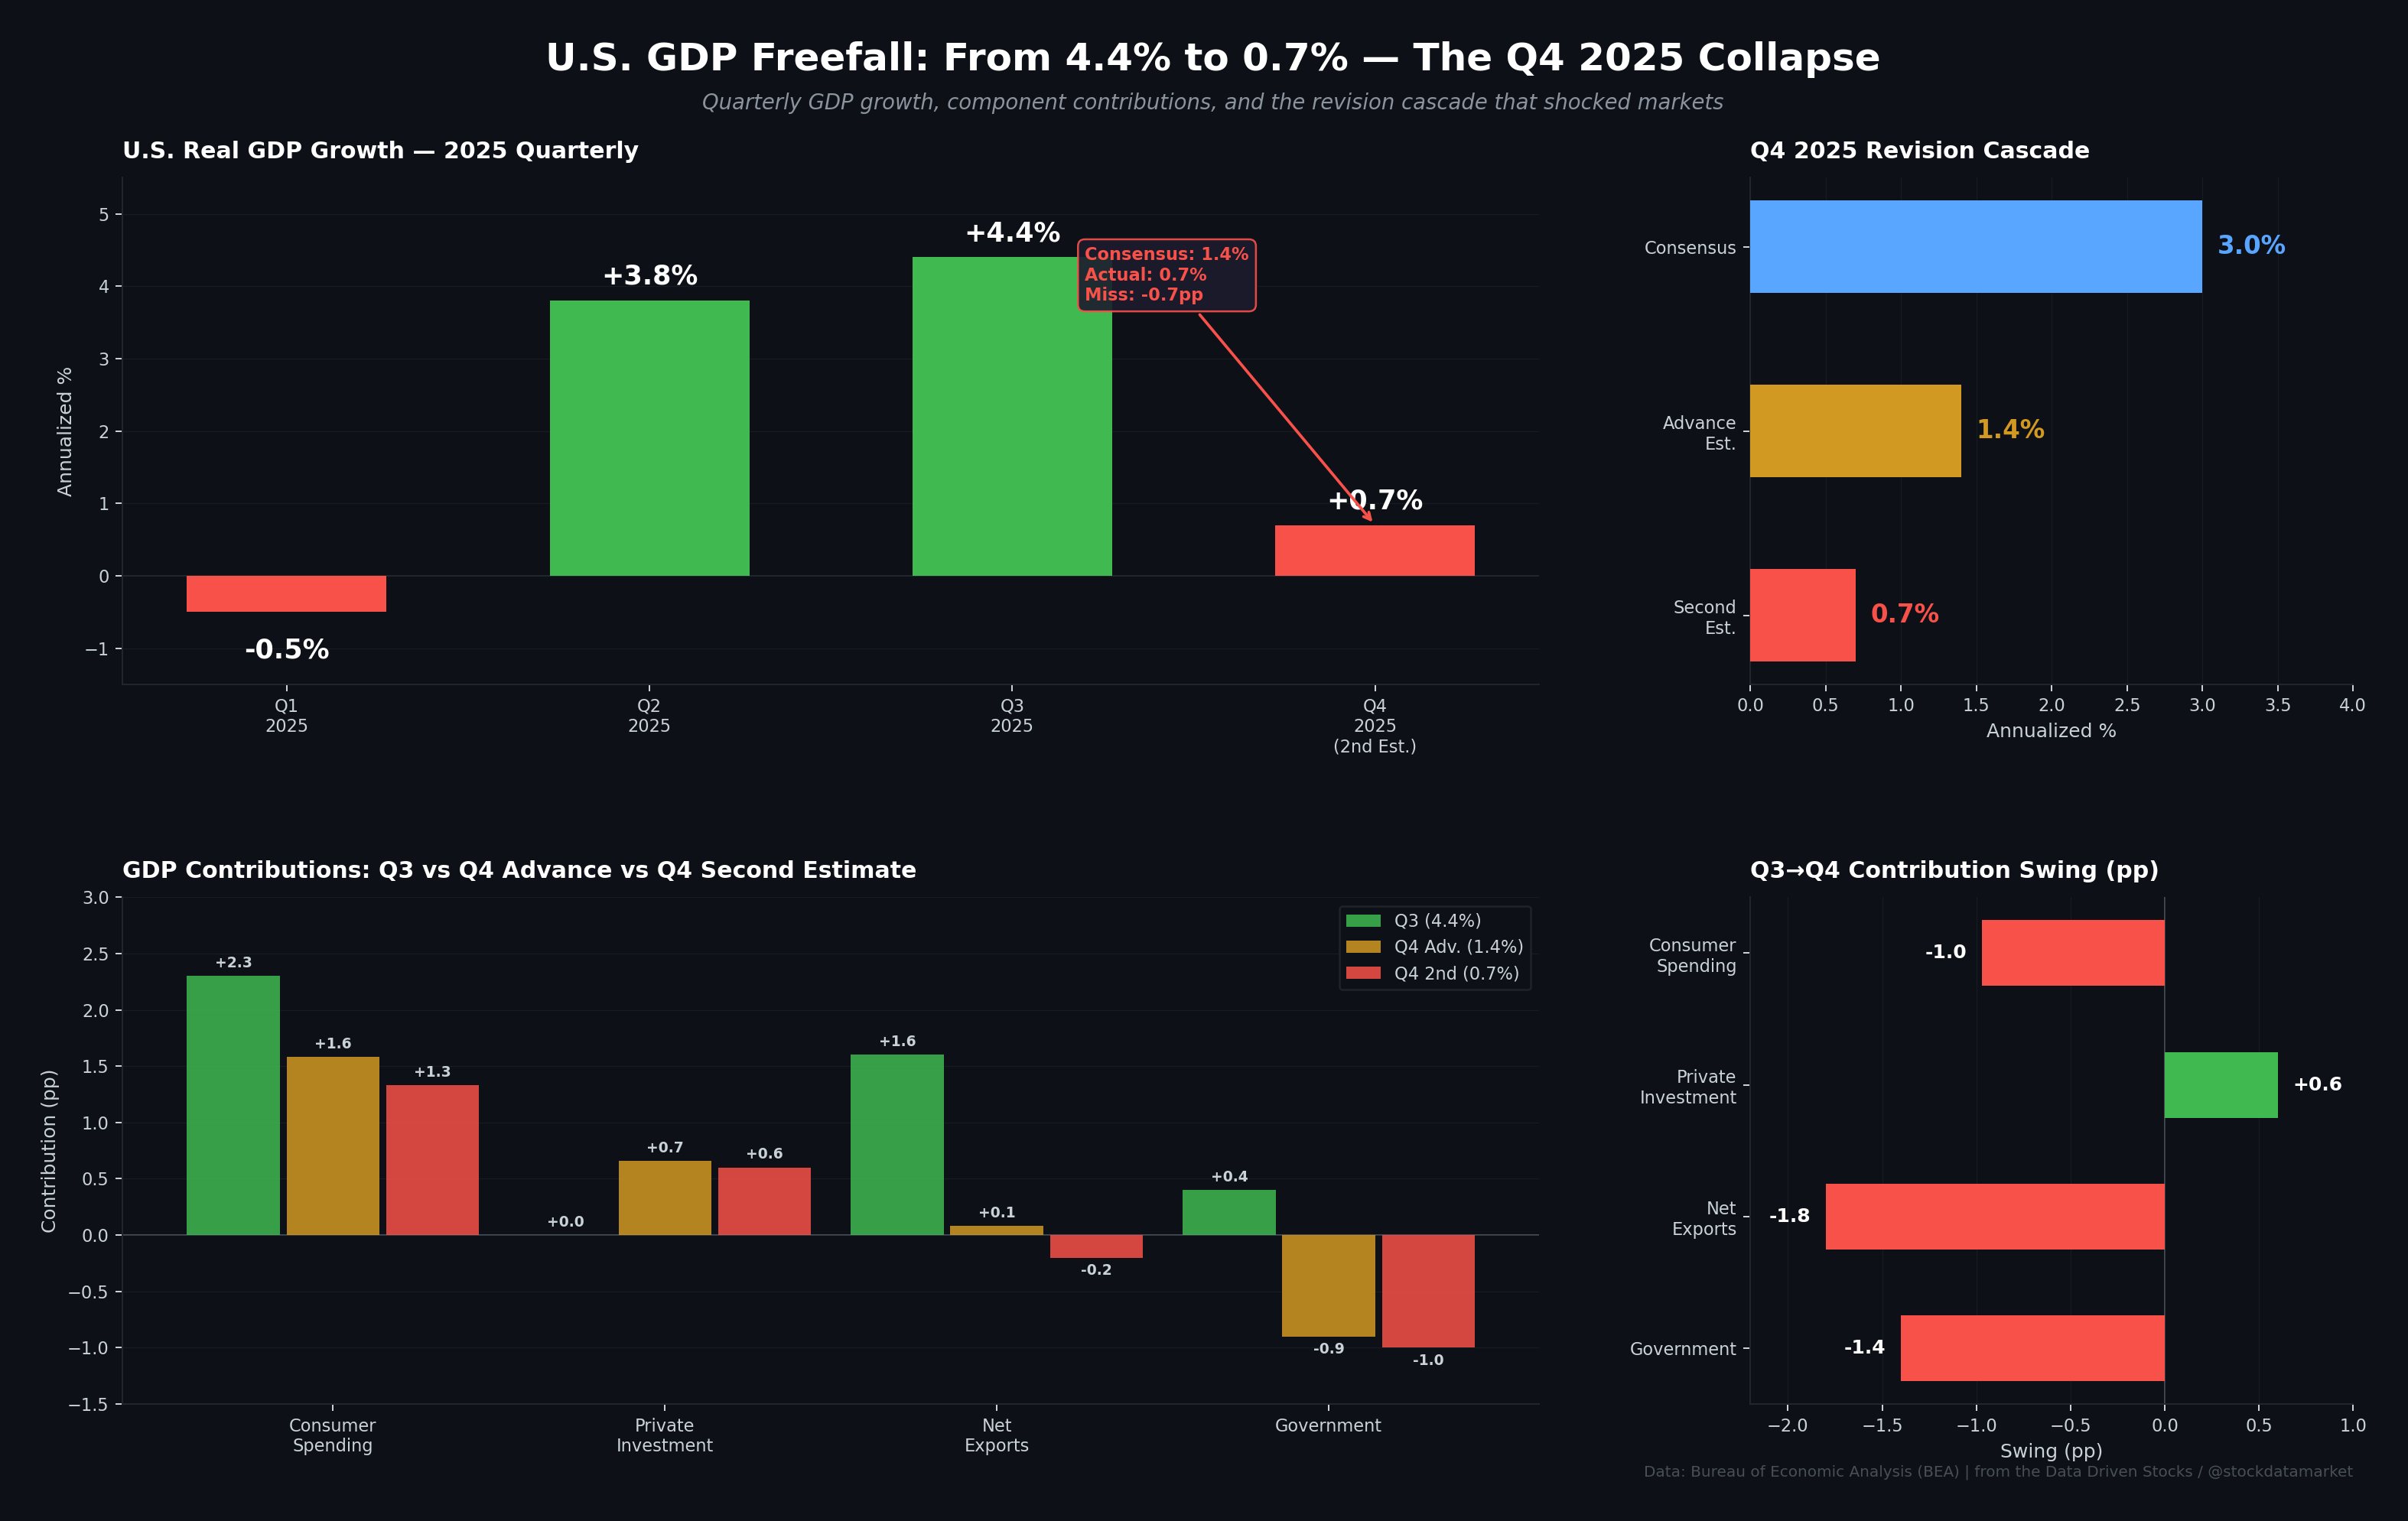
GDP Freefall: From 4.4% to 0.7% — Dissecting America’s Sharpest Economic Deceleration in Years
The U.S. economy went from its best quarter in two years to teetering on the edge of stagnation in just 90 days. Here’s the data behind the collapse.

On March 13, 2026, the Bureau of Economic Analysis dropped a number that sent a chill through financial markets. The second estimate for Q4 2025 real GDP growth came in at just 0.7% annualized — exactly half of the already-disappointing 1.4% advance estimate from February 20, and a staggering 3.7 percentage points below the blazing 4.4% pace printed in Q3. For context, the Wall Street consensus heading into the Q4 advance estimate was 3.0%. They didn’t just miss — they missed by a mile, twice.
This isn’t just a statistical curiosity. The trajectory from Q3’s strongest growth in two years to Q4’s weakest print since the contractionary first quarter tells a story about an economy that is far more fragile than the headline numbers suggested during the summer of 2025. The full-year 2025 GDP growth rate was revised down to 2.1%, a clear step down from 2024’s 2.8% and 2023’s 2.9%.
Let’s rip the data apart.
The Q3 Illusion: Why 4.4% Was Never as Strong as It Looked
The third quarter of 2025 was the economic equivalent of a sugar high. On the surface, 4.4% annualized growth — revised up from an initial 4.3% — looked phenomenal. Consumer spending contributed a hefty 2.3 percentage points, with services alone adding 1.7 pp and goods kicking in another 0.64 pp. The American consumer appeared unstoppable.
But the real story was lurking in the trade data. Net exports contributed an outsized 1.6 percentage points to Q3 growth — a massive tailwind that had no business being treated as sustainable. Exports surged at a 9.6% annualized rate, driven by temporary global inventory restocking cycles and favorable dollar dynamics that boosted competitiveness of American goods abroad. This was a one-time sugar rush, not a structural shift in America’s trade position.
Government spending added a modest 0.4 pp, with federal operations humming along at full capacity. Private investment was essentially flat at 0.0 pp — nonresidential fixed investment added 0.4 pp but was completely offset by a drag from residential investment (-0.3 pp) and inventory drawdowns (-0.1 pp).
The tell was in the alternative metrics. “Core GDP” — stripping out volatile trade, government, and inventories — grew at just 2.9%. Real Gross Domestic Income, a theoretically equivalent measure that tracks the income side, grew at only 2.4%. The gap between the 4.4% GDP and 2.4% GDI was screaming that the headline was inflated by transient factors. Economists who were treating Q3 as proof of a “soft landing” were reading a mirage built on temporary trade flows and statistical noise.
The First Shock: 1.4% Advance Estimate (February 20, 2026)
When the BEA finally released its Q4 advance estimate — delayed from January 29 to February 20 due to the 43-day federal government shutdown that ran from October 1 through November 12, 2025 — the number landed like a punch to the gut. At 1.4%, it was less than half of the 3.0% consensus.
What went wrong? Three things simultaneously blew up.
The federal government shutdown was the most visible culprit. Government spending swung from contributing +0.4 pp in Q3 to subtracting -0.9 pp in Q4 — a 1.3 percentage point negative swing. Federal spending alone cratered at a -16.6% annualized rate. The BEA estimated that the reduction in federal employee services alone knocked roughly 1.0 percentage point off GDP. This was entirely self-inflicted fiscal destruction. Hundreds of thousands of furloughed workers, frozen procurement contracts, shuttered national parks, and halted infrastructure disbursements cascaded through the economy in ways that consensus models had catastrophically underpriced.
The trade fairy tale ended abruptly. Net exports went from contributing +1.6 pp in Q3 to a near-neutral +0.08 pp in Q4 — a 1.5 pp swing. Exports flipped from +1.0 pp to -0.1 pp as the global restocking cycle concluded and the BEA removed an anomalous increase in silver bar exports from the calculation. The silver bars, classified as “valuables” rather than productive economic investment under national accounting rules, had been artificially inflating the export line.
Consumer spending cooled from 3.5% growth to 2.4%, with goods spending actually contracting by 0.1%. The contribution dropped from +2.3 pp to +1.58 pp. Services continued doing the heavy lifting at +3.4% growth, driven by healthcare and international travel. The only bright spot was private investment, which accelerated to contribute +0.66 pp, driven by corporate AI infrastructure spending and intellectual property investment surging at 7.4%.
The Second Shock: 0.7% Revised Estimate (March 13, 2026)
If the advance estimate was a punch, the second estimate was a knockout. The BEA slashed Q4 growth in half — from 1.4% to 0.7%. This wasn’t a rounding-error revision. It was a comprehensive downgrade across nearly every component: exports, consumer spending, government spending, and investment all came in weaker than initially estimated, while imports declined less than previously thought, removing a prior positive offset.

The consumer spending contribution was revised down from +1.58 pp to +1.33 pp. Services spending, initially pegged at 3.4% growth, was cut to 2.7% — a significant downgrade driven by weaker-than-expected healthcare spending as updated hospital and outpatient data from the Census Bureau came in. Goods spending was actually revised slightly upward, but nowhere near enough to offset the services miss.
Exports got hammered even harder. The initial -0.9% contraction was revised to a brutal -3.3% — a 12.9 percentage point swing from Q3’s +9.6%. This represented the worst export performance since mid-2023. The downward revision was driven by updated international transactions data from BEA’s own accounts, particularly for services exports like charges related to intellectual property usage.
The government drag deepened further, with federal spending now showing a catastrophic -16.7% annualized plunge. The total government contribution settled at -1.0 pp. The fixed investment story also soured — growth was cut from the advance estimate’s 2.6% to just 1.6%, dragged down by a 7.1% contraction in nonresidential structures as the commercial real estate sector, laboring under structurally higher interest rates and tightened regional bank credit conditions, essentially froze new development.
Real final sales to private domestic purchasers — the purest measure of underlying demand that strips out volatile government, trade, and inventory components — was revised down a full 0.5 pp from the advance estimate to just 1.9%, compared to 3.0% in Q3. This is where the real alarm bells start ringing, because it suggests the weakness extends well beyond the government shutdown distortion into the foundational private economy.
The Anatomy of the Collapse: What Swung -3.7 Percentage Points

When you line up the contributions side by side, the math becomes brutally clear.
Net exports delivered the single largest swing at -1.8 percentage points, moving from a +1.6 pp contribution in Q3 to -0.2 pp in Q4. This wasn’t just a normalization — it was a reversal. Exports collapsed as global demand dried up, the strong dollar bit hard, and the BEA’s removal of statistical anomalies further depressed the numbers. The 12.9 percentage point swing in the export growth rate alone — from +9.6% to -3.3% — was an unprecedented level of volatility in the external sector.
Government spending was the second-largest negative swing at -1.4 pp, moving from +0.4 pp to -1.0 pp. The 43-day shutdown was unlike any previous government closure in its macroeconomic transmission. It didn’t just furlough workers — it froze federal procurement contracts, halted infrastructure disbursements, and drained liquidity from private contractors dependent on government outlays. The BEA confirmed this alone subtracted about 1.0 pp from growth, but the cascading multiplier effects through the private contractor ecosystem likely amplified the damage beyond what can be separately identified in the source data.
Consumer spending subtracted another -1.0 pp from the swing, falling from +2.3 pp to +1.3 pp. The story here is increasingly uncomfortable: goods spending went from contributing +0.64 pp to essentially zero, while the entire consumer pillar now rests on services spending — particularly inelastic categories like healthcare and essential services. Durable goods contracted as high borrowing costs priced out middle-income households from auto and appliance purchases.
The only partial offset came from private investment, which swung +0.6 pp to the positive side. Inventories flipped from a -0.1 pp drag to a +0.3 pp contributor, and residential investment stopped being such a heavy drag. Corporate capital expenditure on AI infrastructure and intellectual property held up, suggesting the tech sector was the only genuine area of structural strength in the entire economy.

Growth Rate Implosion: Component by Component

The growth rate comparison makes the magnitude of the collapse visceral. Federal spending went from growing at +2.7% annualized to cratering at -16.7% — a nearly 20 percentage point swing that dwarfs anything else in the data. Exports reversed from +9.6% to -3.3%, a 12.9 point swing that underscores how artificial the Q3 trade boom truly was.
Consumer spending decelerated from 3.5% to 2.0%, with goods spending barely positive at +0.4% after being cut from an initial contraction estimate. Services spending was revised down significantly from 3.4% to 2.7%. The only acceleration visible anywhere in the private economy was in fixed investment, which moved from 0.8% to 1.6% — driven almost entirely by intellectual property products (software and AI R&D at +5.7%) and equipment (+3.9%), while nonresidential structures contracted at -7.1%.
The residential housing sector continued to struggle, contracting -1.5% in Q4 after a brutal -7.1% in Q3. Elevated mortgage rates kept the housing market frozen, though the rate of decline did moderate. State and local government spending remained a consistent, modest positive at +2.4%, providing one of the few stable contributions to economic activity across both quarters.
The Stagflation Paradox
Perhaps the most troubling element of the Q4 data isn’t the growth number itself — it’s what happened to prices alongside it. The PCE price index came in at 2.9% for Q4, while PCE excluding food and energy sat at 2.7% — well above the Fed’s 2.0% target. The broader gross domestic purchases price index hit 3.8%, revised up 0.1 pp from the advance estimate. For the full year 2025, PCE inflation averaged 2.6% and core PCE hit 2.8%.
In other words, the economy nearly stalled and inflation stayed stubbornly above target simultaneously. This is the classic stagflationary setup that keeps Fed officials up at night. Cut rates to rescue a 0.7% economy, and you risk reigniting inflation that’s already running hot. Hold rates to crush the remaining price pressures, and you risk tipping a fragile economy into outright contraction.
Fed Governor Christopher Waller tried to thread the needle in a February 23 speech, emphasizing that private domestic final demand still grew at 2.4% (in the advance estimate) and that much of the Q4 weakness would reverse in Q1 2026 as shutdown-related spending catches up. But with the revised second estimate now showing private demand at just 1.9%, that argument is considerably harder to make with a straight face.
Fitch Ratings’ head of U.S. economics, Olu Sonola, framed it more charitably: strip out the shutdown drag and growth looks closer to 2.5%, with the U.S. consumer still carrying the load and AI-linked investment doing real work. The problem is that “strip out the bad things” doesn’t help when the bad things keep accumulating.
What Comes Next: No Buffer Left
The architecture of the 0.7% print leaves the U.S. economy with essentially zero margin for error heading into 2026. Consumer spending is decelerating, with goods already barely above the flatline and the entire load resting on healthcare and essential services. The labor market added just 181,000 jobs across all of 2025 — a “jobless growth” environment driven by productivity gains and AI-driven automation rather than broad-based hiring. Export markets are seizing up. Commercial real estate structures contracted by 7.1%. And companies executed 92,000 job cuts in a single month as the new year began.
Now layer on emerging geopolitical crises. The military escalation involving Iran in late February 2026 has spiked oil prices, with Brent crude hovering near $100 per barrel. University of Michigan consumer sentiment data showed that any improvement in outlook from the shutdown ending was entirely erased by the conflict. Higher energy costs act as a regressive tax on exactly the kind of services spending that’s currently the only thing keeping GDP above zero — gasoline and energy goods were already a -0.05 pp drag on Q4 consumer spending before oil prices spiked.
The full-year 2025 growth of 2.1% looks respectable in isolation. But the quarterly trajectory — from -0.5% in Q1 to 3.8% in Q2 to 4.4% in Q3 to 0.7% in Q4 — tells a story of wild volatility masking an underlying downward trend. Strip out the Q3 sugar high from trade, and the deceleration has been building all along.
The third GDP estimate arrives April 9, 2026, along with corporate profits data that could shift the picture further. Most forecasters, including the IMF and S&P Global, now project 2026 growth at a tepid 1.8% to 2.0%. For now, the data is unambiguous: the U.S. economy ended 2025 barely growing, with inflation still hot, oil spiking, and risks piling up on every front.
Welcome to the hard part.
Citations
Bureau of Economic Analysis, “GDP (Second Estimate), 4th Quarter and Year 2025,” BEA 26-15, released March 13, 2026. https://www.bea.gov/news/2026/gdp-second-estimate-4th-quarter-and-year-2025
Bureau of Economic Analysis, “GDP (Advance Estimate), 4th Quarter and Year 2025,” released February 20, 2026. https://www.bea.gov/news/2026/gdp-advance-estimate-4th-quarter-and-year-2025
Bureau of Economic Analysis, “Gross Domestic Product, 3rd Quarter 2025 (Updated Estimate),” released January 22, 2026. https://www.bea.gov/news/2026/gross-domestic-product-3rd-quarter-2025-updated-estimate-gdp-industry-and-corporate
Federal Reserve Economic Data (FRED), Table 1.1.2: Contributions to Percent Change in Real GDP. https://fred.stlouisfed.org/release/tables?eid=12914&rid=53
Federal Reserve Economic Data (FRED), Table 1.5.2: Contributions to Percent Change in Real GDP, Expanded Detail. https://fred.stlouisfed.org/release/tables?eid=13562&rid=53
Federal Reserve Governor Christopher Waller, Speech, February 23, 2026. https://www.federalreserve.gov/newsevents/speech/waller20260223a.htm
Advisor Perspectives, “An Inside Look at the Q4 2025 GDP Second Estimate,” March 13, 2026. https://www.advisorperspectives.com/dshort/updates/2026/03/13/an-inside-look-at-the-q4-2025-gdp-second-estimate
Fox Business, “US economic growth revised lower in fourth quarter,” March 13, 2026. https://www.foxbusiness.com/economy/us-economy-gdp-q4-2025-second-estimate
PBS NewsHour, “U.S. economy expands slowly at 0.7% in fourth quarter,” March 13, 2026. https://www.pbs.org/newshour/economy/u-s-economy-expands-slowly-at-0-7-in-fourth-quarter-downgrading-from-initial-government-estimate
Neil Sethi, “GDP – Q4 2025 second estimate,” Substack, March 13, 2026. https://neilsethi.substack.com/p/gdp-q4-2025-second-estimate
First Trust, “Real GDP Growth in Q3 Was Revised Higher to a 4.4% Annual Rate,” January 22, 2026. https://www.ftportfolios.com/blogs/EconBlog/2026/1/22/real-gdp-growth-in-q3-was-revised-higher-to-a-4.4percent-annual-rate
U.S. Congress Joint Economic Committee, “GDP Update.” https://www.jec.senate.gov/public/index.cfm/republicans/gdp-update
Trading Economics, “United States GDP Growth Rate.” https://tradingeconomics.com/united-states/gdp-growth
EY, “US GDP (Q4 2025 – first estimate).” https://www.ey.com/en_us/insights/strategy/macroeconomics/us-gdp
Times of India / Xinhua, “US GDP rises 0.7% in Q4 after sharp downgrade; full-year 2025 pace revised to 2.1%.” https://timesofindia.indiatimes.com/business/international-business/us-gdp-rises-0-7-in-q4-after-sharp-downgrade-full-year-2025-pace-revised-to-2-1/articleshow/129554268.cms
Quartz, “GDP growth revised down to 0.7% for Q4 2025 as U.S. economy slowed.” https://qz.com/q4-2025-gdp-revision-bea-economy
AP News, “Cracks emerged in a resilient US economy before war in Iran.” https://apnews.com/article/economy-gdp-consumer-spending-trump-government-shutdown-3172b6d0023717644c173cee94d44a79


From 1.4% to 0.7%. that is a brutal revision. Thanks for the update!