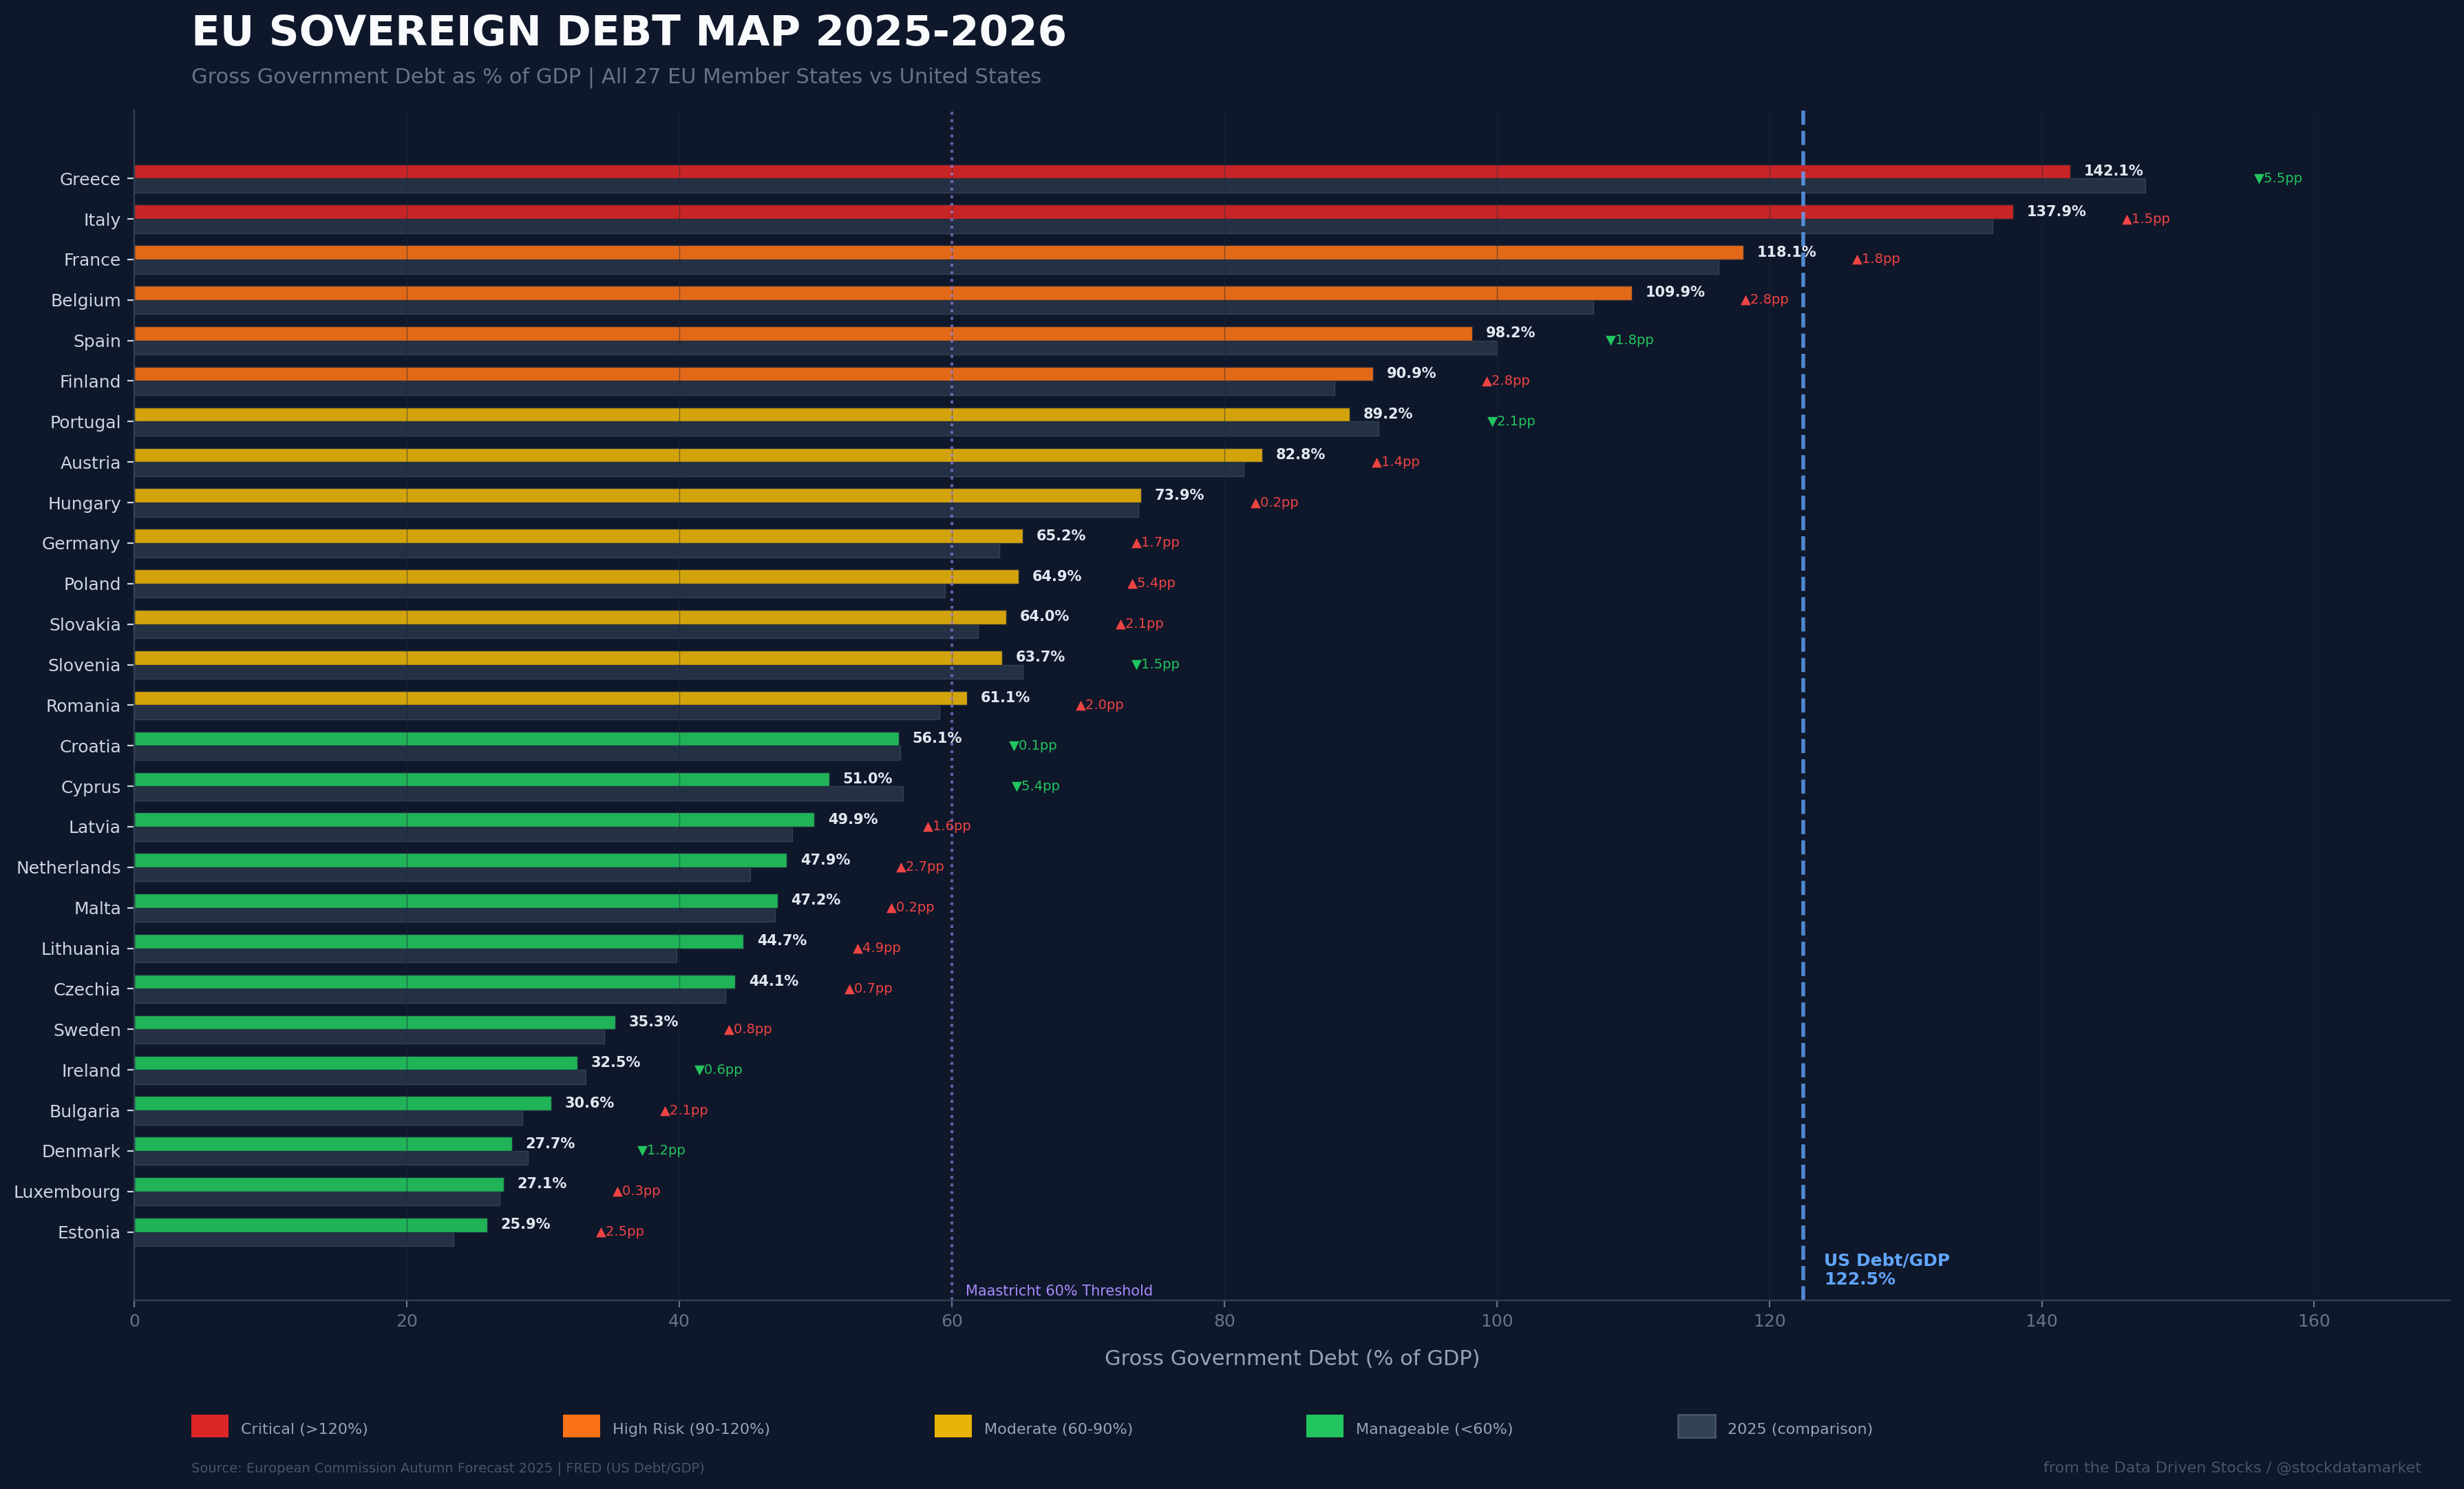
Europe’s $14 Trillion Debt Bomb Is Ticking - And the Iran War Just Lit the Fuse
The EU carries more debt than ever before, bond yields are spiking, and a full-blown energy shock just slammed into the continent.

Let’s cut straight to it. Europe is sitting on a mountain of sovereign debt that would have been unthinkable a generation ago. The euro area’s gross government debt is projected to hit 91% of GDP by 2027, up from 88% in 2024, according to the European Commission’s Autumn 2025 Forecast. Greece is hovering around 142% of GDP. Italy is at 138%. France has breached 118%. And Belgium is approaching 110%.
These are not normal numbers. They are the kind of figures that, in another era, would have triggered panic selling in bond markets, IMF bailouts, and midnight emergency summits in Brussels. Yet here we are in March 2026, and the story is more nuanced than the headline numbers suggest.
Because while Europe’s debt has ballooned to record levels, the conditions surrounding it have changed dramatically - for better and for worse. And the Iran war that erupted in late February has just introduced a brand new variable into an already fragile equation.
The Numbers That Should Keep Finance Ministers Up at Night
Take a look at the full EU debt picture. Of the 27 member states, only a handful sit comfortably below the Maastricht Treaty’s 60% of GDP threshold - the theoretical ceiling that EU countries pledged to respect when they joined the monetary union. Denmark, Luxembourg, Estonia, Bulgaria, Ireland, and Sweden are the virtuous few. Everyone else? Above the line and climbing.
The big movers are concerning. Poland’s debt is projected to jump 5.4 percentage points from 2025 to 2026, reaching 64.9% of GDP. Lithuania is adding 4.9 points. Finland is swelling from 88.1% to 90.9%. France keeps drifting higher, adding another 1.8 points to an already eye-watering 118.1%. And Belgium, which has been a slow-motion fiscal disaster for years, is pushing toward 110%.
There are bright spots, though. Greece - yes, that Greece - is actually bringing its ratio down by 5.5 percentage points as its economy grows and austerity-era reforms bear fruit. Spain is shaving 1.8 points off its debt. Portugal continues its remarkable post-crisis turnaround, dropping from 91.3% to 89.2%. Cyprus is the standout improver, cutting from 56.4% to 51.0%.
But the aggregate picture is undeniable: EU sovereign debt is at record highs in absolute terms, and the ratio is trending in the wrong direction for most countries.
The Yield Puzzle - Lower Than 2012, But Rising Fast
Here is where the story gets interesting and where the comparison with past crises becomes essential.

In February 2026, Italy’s 10-year bond yield sits at roughly 3.39%. France is at 3.40%. Spain at 3.18%. Greece at 3.39%. These numbers might sound high if you have been conditioned by the near-zero-rate world of 2015-2021, but they are remarkably low by historical standards.
During the 2011-2012 euro debt crisis, Italy’s 10-year yield touched 7.1%. Spain hit 7.6%. Portugal reached a staggering 13.8%. Greece was completely off the charts at 29.2% - essentially shut out of bond markets. Ireland spiked to 14%.
The spread over German Bunds tells the real story of risk perception. In 2026, Italy trades at roughly 59 basis points above Germany. At the peak of the 2011-2012 crisis, that spread blew out to over 500 basis points. France currently sits at 60 basis points over Bunds, compared with about 150 basis points during the worst of the crisis panic. Hungary at 368 basis points and Poland at 219 basis points stand out as the outliers on the eastern flank, but even these are manageable by emerging market standards.
The bond market, in short, is not panicking about European sovereign debt the way it did in 2012. Not even close. And there are good structural reasons for that, which we will get to. But first, let’s talk about what is pushing yields higher right now.
The Iran War: A Perfect Storm for European Bonds

On February 28, 2026, the United States and Israel launched strikes on Iran, and everything changed. The Strait of Hormuz - through which roughly 20% of the world’s oil supply and 20% of global LNG trade passes - went from a theoretical chokepoint to an actual one. Tanker traffic ground to a near-standstill. The International Energy Agency called it the largest supply disruption in the history of the global oil market.
Brent crude spiked to nearly $120 per barrel. European natural gas prices surged 20-30%, with the Dutch TTF benchmark hitting a three-year high. And this hit a continent that started 2026 with gas storage at just 46 billion cubic meters, compared with 60 bcm in 2025 and 77 bcm in 2024. Europe was already walking into the conflict on a thinner energy cushion than it had during the 2022 Russia-Ukraine shock.
The bond market reaction was immediate and punishing. As Euronews reported in late March 2026, government bond yields surged across Europe in a classic “bear flattening” pattern - short-term yields jumped faster than long-term yields as markets priced in the expectation that central banks would need to tighten policy again to fight energy-driven inflation. BCA Research’s Chief Fixed Income Strategist Robert Timper described it as a “hawkish monetary policy repricing in response to inflation fears stemming from the Iran war.”
The European Central Bank held rates steady at its March meeting, but the market has shifted its expectations dramatically. Instead of the rate cuts that were widely anticipated entering 2026, traders are now pricing in the possibility of rate hikes later in the year. Goldman Sachs Asset Management’s Simon Dangoor suggested a hike is “possible later in 2026,” noting that the ECB “stands ready to act sooner if the situation deteriorates.”
For sovereign debt dynamics, this is the worst possible combination: higher borrowing costs arriving precisely when governments need to refinance enormous volumes of maturing bonds.
The Snowball Effect - When r > g, Debt Eats Itself

There is a simple but devastating formula at the heart of sovereign debt dynamics. When the interest rate a government pays on its debt (r) exceeds the growth rate of the economy (g), the debt-to-GDP ratio rises automatically even if the government runs a balanced budget. This is what economists call the “snowball effect,” and the European Commission’s Debt Sustainability Monitor has flagged it as an increasingly serious concern heading into 2026-2027.
The math is brutal. If a country has 100% debt-to-GDP, grows at 1.5% per year, and refinances its debt at 3.5%, the adverse interest-growth differential alone pushes the ratio up by roughly 2 percentage points annually before you even account for new deficit spending. Layer on a primary deficit of 2-3% of GDP - which is where most EU countries currently sit - and the debt ratio accelerates upward fast.
This is exactly the scenario unfolding across much of the EU right now. Growth forecasts for the eurozone have been cut repeatedly. Germany’s economy has been stagnating with output barely growing at 0.3%. France is limping along at roughly 0.7%. Only Spain, with growth projected at 2.6-2.9%, has managed to outperform expectations convincingly among the big four economies. Meanwhile, yields have climbed from their 2020-era lows to the 3-4% range across most of the continent.
The ECB has acknowledged the problem. Its Financial Stability Review notes that the normalization of the central bank’s balance sheet has forced larger amounts of sovereign bonds onto private markets, while the Commission’s own stress tests show that a sustained 1 percentage point rise in yields would measurably worsen debt trajectories for high-debt countries.
The Refinancing Wall - Who’s Most Exposed?

This is where the maturity profile of European sovereign debt becomes critical. The OECD’s Global Debt Report 2026 notes that sovereign bond issuance and outstanding volumes reached record highs across the OECD area in 2025, with refinancing requirements accounting for most of the gross borrowing.
The rollover wall - the chunk of debt maturing over the next few years - varies enormously by country. S&P Global estimates France’s refinancing needs at 12.3% of GDP for 2025, up from 11% the prior year, while Germany needs to roll over under 7% of GDP thanks to its lower debt stock. Italy, Portugal, and Belgium face the highest rollover ratios in Europe given their elevated debt levels combined with significant near-term redemptions, though precise percentages vary by methodology. The UK benefits from a 12-year average maturity on its debt.
Here is the key dynamic: countries that issued a lot of short-dated debt during the zero-rate era are now facing the consequences. Many Eastern European sovereigns carry shorter average maturities, meaning higher rates transmit faster into actual interest payments. Even in Western Europe, the trend toward shorter-duration issuance has picked up. The OECD notes that in 2025, the ratio of fixed-rate bonds with maturities of 30+ years compared to those with 1-5 year maturities hit its lowest level since at least 2008. Governments are choosing to pay less now by issuing shorter bonds, but they are storing up rollover risk for 2026-2030.
The math is simple: for a country like France that needs to refinance roughly 12% of GDP worth of debt every year, a 100 basis point rise in the average refinancing cost translates into an extra 0.12% of GDP in annual interest payments. For Italy, with even higher rollover volumes, the sensitivity is greater. Compound that across multiple years of elevated rates, and you are looking at a meaningful fiscal squeeze.
The 2010s Crisis vs 2026 - Is This Really a Crisis?

This is the chart that should reframe the entire conversation. Look at the two panels side by side.
On the left: debt levels. Italy is at 138% of GDP in 2026 compared with 127% at the crisis peak. France is at 118% versus 91%. Spain at 98% versus 86%. Belgium at 110% versus 104%. In four of the EU’s eight largest economies, debt is substantially higher today than it was during the worst sovereign debt crisis in Europe’s modern history.
On the right: yields. And this is where the picture flips completely. Italy’s 10-year yield was 7.1% at the 2012 peak. Today it is 3.4%. Greece was at 29.2% and is now at 3.4%. Ireland was at 14% and is now at 3.0%. The yields are not even in the same universe.
So what explains this massive disconnect between higher debt and lower yields?
Three things have fundamentally changed since 2012. First, the institutional architecture of the eurozone is dramatically stronger. The European Stability Mechanism exists as a backstop. The ECB has demonstrated its willingness and ability to intervene in bond markets through programs like OMT and PEPP. Mario Draghi’s “whatever it takes” speech in 2012 created a credibility floor under European sovereign bonds that still holds today.
Second, debt maturity profiles are longer. As the OMFIF noted in its January 2026 outlook, euro area sovereign bonds have converged in a way that recalls the pre-2008 period, but under fundamentally different conditions - longer debt maturities, a larger share of fixed-rate issuance, and institutional frameworks that anchor medium-term inflation expectations. Italy’s debt maturity is long, refinancing risk is contained, and interest expenditure remains manageable in the near term.
Third, real borrowing costs remain compressed by historical standards. While nominal yields have risen, real borrowing costs (adjusted for inflation) hover around zero on average across the euro area. Between 2000 and 2008, real long-term rates averaged 1.5-2%. Today they are significantly lower, which provides a genuine cushion for debt dynamics.
Where Europe Actually Beats America

Here is the elephant in the room that rarely gets discussed: the United States is in worse shape on several metrics that matter.
US total public debt stands at roughly 122.5% of GDP as of Q4 2025, and the trajectory is relentlessly upward. The Congressional Budget Office projects debt will hit 118% of GDP (using debt held by the public) by 2035, and the NBER estimates it could reach 233% by 2054 under certain interest rate scenarios. Moody’s downgraded the US from AAA to Aa1 in May 2025 - making the US the last of the big three credit agencies to strip America of its top rating.
The interest burden is staggering. The US paid roughly $952 billion in net interest on its national debt in fiscal year 2025, approaching the $1 trillion mark for the first time. In the first nine weeks of fiscal year 2026 alone, the Treasury spent $104 billion in interest - more than $11 billion per week, representing 15% of all federal spending.
Compare that with the EU. The euro area’s aggregate debt-to-GDP ratio is projected at around 90% for 2026 versus America’s roughly 124% on a total public debt basis. That is a gap of approximately 34 percentage points, and it has been widening. While the US deficit runs at roughly 6-7% of GDP with no credible consolidation plan, most EU countries are constrained by the reactivated Stability and Growth Pact and are making at least modest efforts to narrow their deficits toward the 3% Maastricht ceiling.
The EU also has one structural advantage that the US does not: the euro area does not carry the “exorbitant privilege” burden of being the world’s reserve currency issuer, which sounds like a benefit but in practice enables unlimited deficit spending without market discipline. Europe’s fiscal rules, however imperfect, impose constraints that force periodic adjustment.
That said, Europe has vulnerabilities that the US does not. The EU’s fragmented fiscal architecture means there is no single eurozone Treasury to coordinate a unified response. Individual countries can face market pressure in a way that US states cannot. And the ECB, unlike the Fed, operates under a more restrictive mandate and political structure that can make crisis responses slower and more contentious.
What Happens Next?
The honest answer is: it depends on the Iran war.
Chatham House’s analysis lays out two scenarios. If the conflict is resolved quickly and oil prices fall back, inflation in Europe would run only about 0.5 percentage points above pre-conflict forecasts, central bank strategies would remain largely unchanged, and the hit to growth would be minimal.
If the conflict persists for several months, oil could hit $130 per barrel, the eurozone economy would likely contract in Q2 and flatline for the rest of the year, and the entire fiscal and monetary calculus would need to be reworked. Higher energy prices would feed inflation, force the ECB into a hiking cycle it does not want, and push bond yields higher precisely when governments are trying to refinance record volumes of maturing debt.
CNBC’s reporting suggests the ECB’s next move would likely be a hike in the prolonged scenario, with Goldman Sachs Asset Management describing such a move as “possible later in 2026” if the situation deteriorates. Nicholas Brooks of ICG pushed back, arguing that oil would need to remain above $100 per barrel for an extended period before the ECB considered hiking, and noted that “gilts and bunds are pricing in a much longer conflict than other markets.”
The critical point is this: European sovereign debt is high but structurally more resilient than it was in 2012. The institutional safety nets are in place. The maturity profiles provide a buffer. Yields are elevated but not crisis-level. The real risk is not a sudden 2012-style blowup but rather a slow erosion of fiscal space as the snowball effect grinds debt ratios higher, year after year, in a world where interest rates can no longer go to zero.
For investors, the takeaway is that European sovereign bonds are not facing an existential crisis - but they are facing a painful adjustment to a world of structurally higher rates. Countries like Italy, France, and Belgium are the ones to watch most closely. Their combination of high debt, significant refinancing needs, and limited growth prospects makes them the most sensitive to any further yield increases.
And if the Iran war drags on? Then all bets are off.
This analysis represents the views of Data Driven Stocks and is for informational purposes only. It does not constitute investment advice.
Sources:
European Commission, “Autumn 2025 Economic Forecast” (November 2025) - Gross government debt projections for all EU member states 2025-2027.
FRED (Federal Reserve Bank of St. Louis), “Federal Debt: Total Public Debt as Percent of Gross Domestic Product” (GFDEGDQ188S), updated March 2026.
OECD/FRED, “Long-Term Government Bond Yields” - 10-year bond yield series for EU countries (IRLTLT01FRM156N for France, IRLTLT01ITM156N for Italy, and equivalent series).
Congressional Budget Office (CBO), “The Budget and Economic Outlook: 2025 to 2035” (January 2025).
Euronews, “Bond yields surge as Iran war stirs inflation fears almost a month into the conflict” (March 26, 2026).
CNBC, “Government bonds face ‘perfect storm’ as Iran war rattles Europe’s central banks” (March 19, 2026).
CNBC, “The Iran war is pushing up European energy prices” (March 12, 2026).
Bruegel, “How will the Iran conflict hit European energy markets?” (March 2, 2026).
Chatham House, “How will the Iran war affect the global economy?” (March 2026).
Morgan Stanley, “Iran Conflict: Oil Price Impacts and Inflation” (March 2026).
World Economic Forum, “The global price tag of war in the Middle East” (March 2026).
OMFIF, “Outlook 2026: Convergence and readjustment in euro area sovereign bond markets” (January 13, 2026).
OECD, “Sovereign Borrowing Outlook: Global Debt Report 2026.”
S&P Global Ratings, “Sovereign Debt 2025: Developed European Governments To Borrow About $1.8 Trillion” (March 4, 2025).
European Stability Mechanism (ESM), “Higher interest rates attract investors to euro area sovereign debt but pose challenges for public finances.”
European Parliament Briefing, “Management of debt liabilities in the EU budget under the post-2027 MFF” (2024).
European Commission, “Debt Sustainability Monitor” (annual publication) - interest-growth differential analysis and stress test methodology.
ECB, “Financial Stability Review” (November 2025).
Wikipedia, “Economic impact of the 2026 Iran war” (compiled from IEA, Reuters, Goldman Sachs, and other primary sources).
U.S. Joint Economic Committee, “FY2025 Debt Increased by $2.2 Trillion, Stands at Over $37.6 Trillion” (October 2025).
Moody’s Investors Service, “Global sovereign and emerging markets outlooks 2026 executive summary” (November 2025).
NBER Working Paper 34455, Auerbach & Gale, “Then and Now: A Look Back and Ahead at the Federal Budget” (2025).
U.S. GAO, “America’s Fiscal Future” (February 2025).
Al Jazeera, “Why the oil and gas price shock from the Iran war won’t just fade away” (March 23, 2026).

