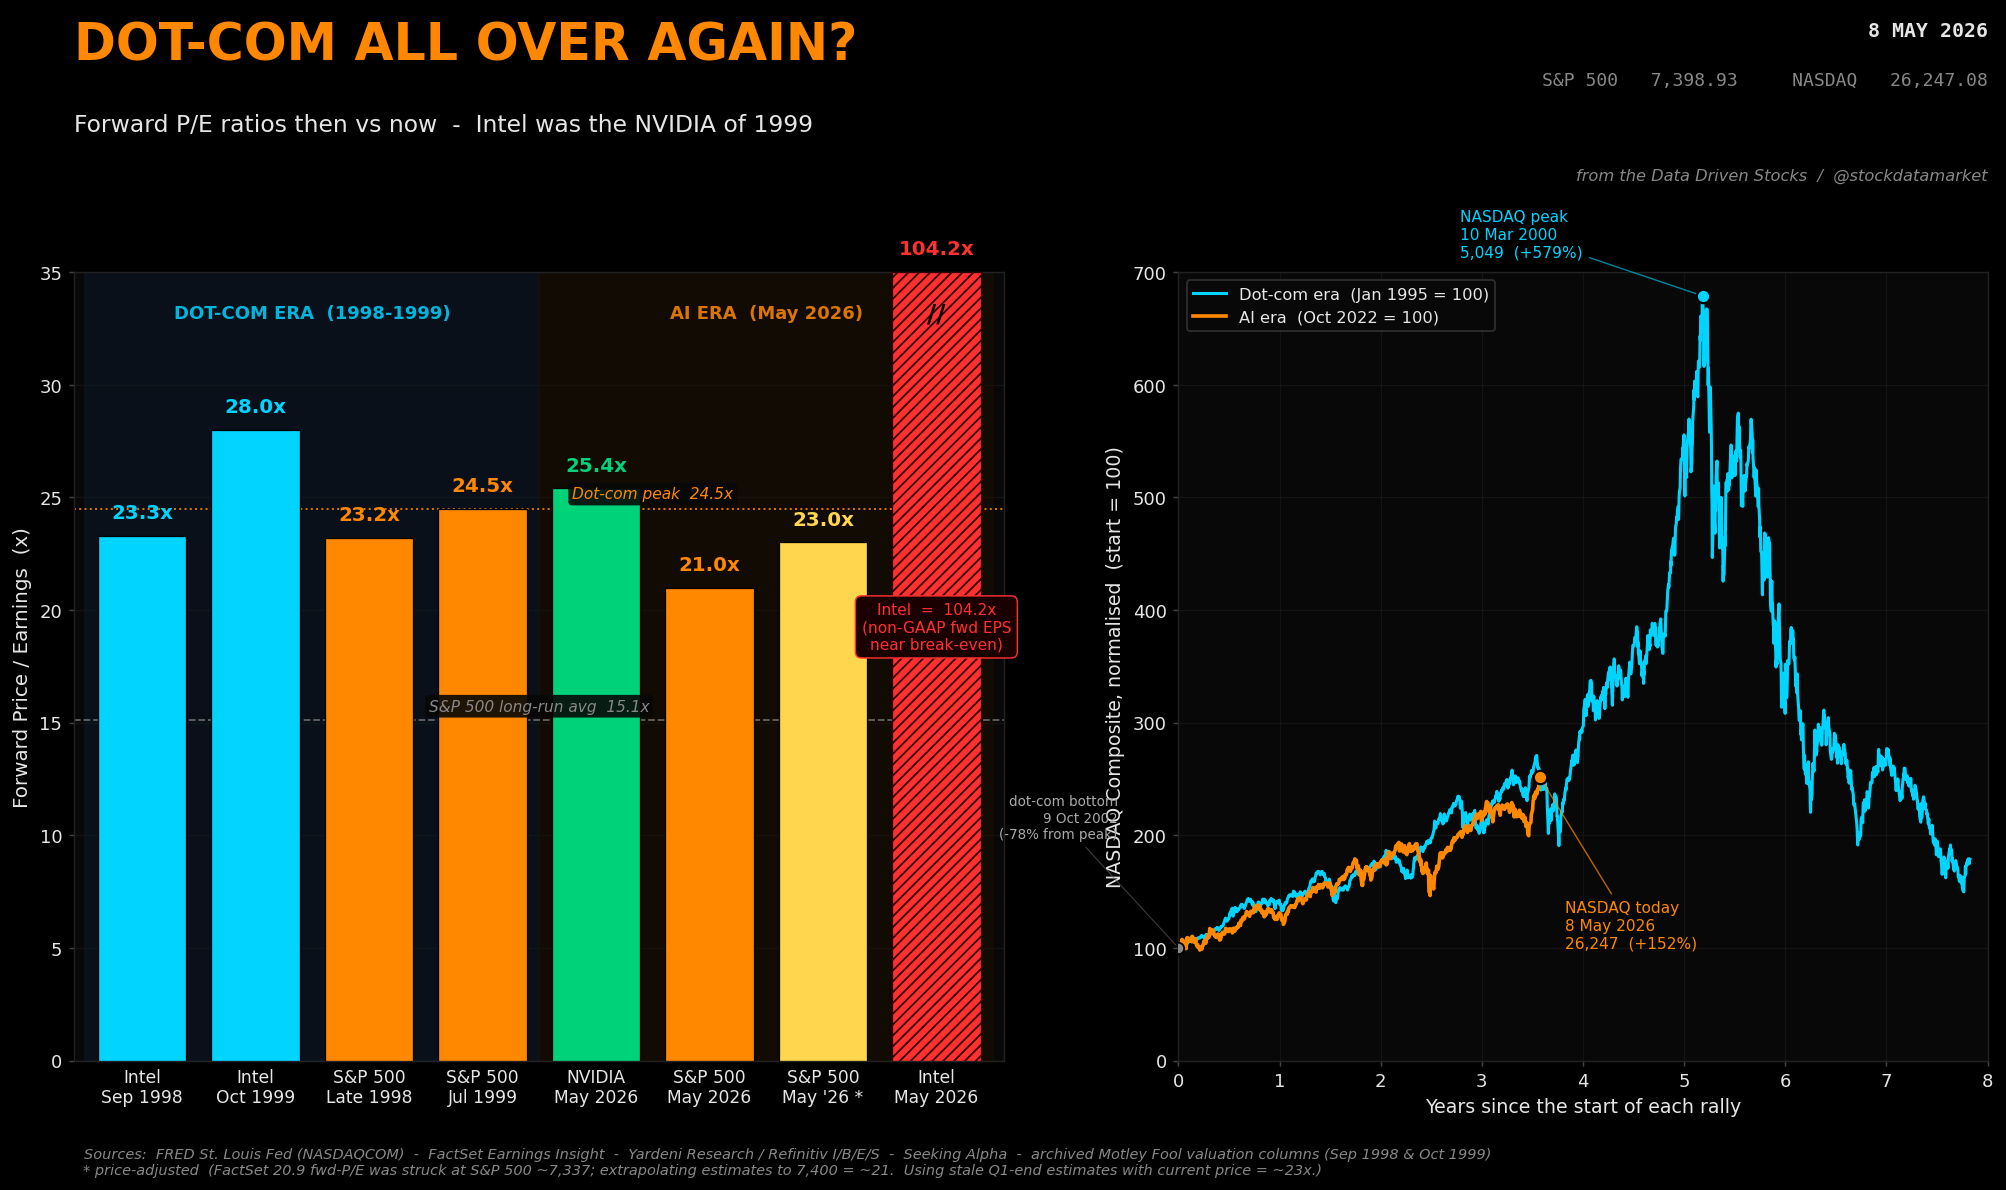
Dot-Com 2.0? The Forward P/E Receipts From 1999 vs The 2026 Semiconductor Mania
Why NVIDIA at 25x looks suspiciously like Intel at 28x - and why Intel today at 104x means something completely different.

On April 24, 2026, NVIDIA crossed $5 trillion in market cap. First company in history. The same trading session Intel printed +24%, its single best day since 1987. AMD added 14%. The Philadelphia Semiconductor Index hit a fresh all-time high. Two weeks later, on May 8, the S&P 500 closed at 7,398.93 and the NASDAQ Composite at 26,247.08.
The question wrote itself. Are we doing 1999 again?
Let’s run the numbers honestly. Not the vibes. Not the YouTube thumbnails. The actual forward P/E receipts.
What the 2026 semi rally actually looks like
NVIDIA is up roughly fourteenfold since the end of 2022. One stock has added more than $4.5 trillion in market value over forty months. The company that started life selling graphics cards to gamers is now the single most important piece of compute infrastructure on the planet. Full stop.
The hyperscalers are the buyers. At the start of 2026, the four big AI hyperscalers guided to roughly $650 billion in combined capex for the year, up across the board from late-2025 plans. Microsoft alone raised its 2026 capex by 24% to $190 billion. A large fraction of that flows to NVIDIA. The rest goes to AMD, Broadcom, Marvell, and the memory and advanced-packaging supply chain. The rally is broad. It is also vertical. And here is where the dot-com question starts.
A short history of the dot-com timeline
The dot-com bubble didn’t start in 1999. It started in 1995 with the launch of Netscape Navigator. Over five years, the NASDAQ Composite climbed from 743 to 5,049, a +579% run that ended on March 10, 2000. The index then lost 78% over the next two-and-a-half years, hitting bottom on October 9, 2002.
The current AI rally has been running since the late-2022 NASDAQ bear-market low. ChatGPT was released on November 30, 2022; the index turned around in October. From that low to May 8, 2026, the NASDAQ is up 152%.
Now look at the two rallies side by side.

This is the chart that makes people uncomfortable. The dot-com NASDAQ then went on to triple again over the next eighteen months before crashing. That is the part the chart cannot tell you whether to expect.
The honest read of this overlay is uncomfortable in both directions. If you believe the parallel holds, today is the equivalent of May 1998 - meaning the most violent gains in the rally are still ahead, and so is the eventual crash. If you believe the parallel breaks, you have to articulate why the underlying compute cycle now is different from the underlying compute cycle then. Both arguments are coherent. Neither is obvious.
Intel was the NVIDIA of 1999
The single most useful frame for the current setup is not “NASDAQ vs NASDAQ.” It is “dominant chipmaker vs dominant chipmaker.” In 1999 that chipmaker was Intel. The Pentium franchise commanded close to 90% of x86 CPU shipments. Every PC built between 1995 and 2000 had Intel inside. The company briefly became the most valuable in the United States by market capitalisation. Sound familiar?

The pattern is close enough that it stops feeling like coincidence. Intel’s forward P/E in September 1998 was 23.3x, anchored on 1999 EPS estimates of $3.77 a share. By October 12, 1999, with the stock at $76, that forward multiple had crept to 28x against year-2000 estimates. In August 2000 the company touched its market-cap high. Then it lost roughly 80% of its value over the next two years.
NVIDIA’s forward P/E on May 8, 2026 is 25.4x. Different decade. Same neighborhood. Same role in the market’s psychology.
The forward P/E receipts
Here is the comparison that matters. All seven anchor points on one chart, in chronological order.

Three things jump out.
First, NVIDIA’s 25.4x in May 2026 is essentially the same number as the S&P 500’s all-time forward-earnings peak of 24.5x in July 1999. That peak was set during the most concentrated tech rally in modern American history. We are now watching one stock trade where the entire S&P 500 traded at the maximum of dot-com euphoria. That is the apples-to-apples comparison most worth taking seriously.
Second, Intel’s progression in the dot-com era - 23.3x in September 1998, then 28.0x by October 1999 - shows what the multiple expansion of a chip king looks like in real time. The market does not argue about whether the rerating is “justified.” It just keeps paying up. Until it doesn’t.
Third, the broad market today is expensive but not yet euphoric. The S&P 500 sits at roughly 21x forward earnings on the current FactSet read, comfortably above the post-1982 average of 15.1x, above its own five-year average of 19.9x, and above its ten-year average of 18.9x. But still below the 24.5x record from July 1999.
A methodological wrinkle worth knowing
There is a subtlety embedded in that 21x number. FactSet’s most recent published reading was 20.9x as of May 1, 2026, struck at an S&P 500 level of 7,337. Since the index has rallied to 7,398.93 on May 8, the multiple at the new price level using the same denominator is approximately 21x. Consensus EPS forecasts moved up alongside Q1 earnings beats, so the ratio held roughly steady even as the price rose.
But here is the wrinkle. Many published forward P/E series lag the actual earnings revision cycle. If you compute the multiple using estimates from before the Q1 beats - the March-31 vintage forecast - against today’s price, the ratio comes out closer to 22 to 23x. That is the “stale-denominator-with-current-price” lens, and it argues today’s broad-market valuation is sitting closer to the dot-com peak than the FactSet headline number suggests.
Either way, you are looking at an S&P 500 valuation that is well above every historical norm except 1999 and the post-COVID 2021 peak. That fact does not depend on which methodology you prefer.
The plot twist: Intel today is the anti-NVIDIA
Now for the strangest data point in the entire comparison. Intel’s forward P/E on May 7, 2026 was 104.2x on a non-GAAP basis, with the GAAP forward P/E flagged as not-meaningful.
If you only saw that number, you would conclude Intel had become a hyper-growth stock. It has not. The denominator is just very small.

NVIDIA at 25.4x has a real, large, fast-growing earnings stream behind it. The company’s fiscal-2026 revenue grew 65% to $215.9 billion. Data center alone did $193.7 billion. That is not a bubble-math artifact. It is an expensive growth stock with the receipts to back the multiple.
Intel at 104.2x is something completely different. A struggling foundry whose earnings are temporarily compressed. Tiny denominators make ratios vendor-dependent and unstable. Comparing the two as if they belong on the same scale is the kind of mistake that ends careers.
The clean comparison is Intel 1999’s 28x against NVIDIA 2026’s 25.4x. Intel had healthy earnings growth in 1999 too. The market still paid 28x for them. Three years later the stock had lost 80% of its value, and not primarily because the earnings collapsed. Earnings did eventually fall. The multiple compressed first.
What rhymes and what doesn’t
The rhymes are obvious once you see them. A dominant US chipmaker becomes the avatar of a transformative compute cycle. A new generation of investors treats the chart as one-way. The forward P/E of the broad market climbs into expensive territory. The narrative gets repeated often enough that it starts to sound like fact.
The differences are also real. NVIDIA’s earnings are massive and still accelerating. Hyperscaler capex commitments give the next twelve to twenty-four months a visible floor that the dot-coms of 1999 did not have. Many of the top-ten “internet” stocks of late-1999 had no earnings at all - that is not the case here. NVIDIA is generating tens of billions in free cash flow.
The dot-com peak’s S&P 500 information-technology sector forward P/E hit 48.3x in March 2000. NVIDIA at 25.4x is roughly half of that. The mania-stage multiple expansion that defined the actual top of the bubble has not happened to NVIDIA yet.
But that is also exactly what makes the May 1998 / May 2026 alignment in the NASDAQ overlay sobering. In May 1998, the dot-com NASDAQ was up 158%. The same chart through that point looked perfectly rational too. The blow-off top was still twenty-two months away.
The verdict
Today’s broad market is expensive by every long-run measure but is not yet at the late-1999 extreme. NVIDIA at 25.4x forward earnings sits exactly where the entire S&P 500 sat at the all-time peak of dot-com euphoria - that is the comparison most worth taking seriously. Intel today at 104x is a denominator artifact, not a valuation signal.
The honest answer to “are we doing 1999 again?” has three parts.
By the structural pattern of a dominant chipmaker driving the index, yes. By the headline broad-market multiple, not yet at the most extreme reading - but uncomfortably close, and closer still if you adjust for the price-rally lag in the consensus EPS denominator. By the breadth and earnings backing of who is rallying, the AI cycle is more concentrated and more earnings-backed than the dot-com era was at its peak. Some of that is reassuring. Some of it makes the concentration risk worse, not better.
History does not repeat. But the forward P/E ratios published by Seeking Alpha in May 2026 do, as a matter of arithmetic, rhyme with the forward P/E ratios published by Motley Fool columnists in October 1999. That is not nothing.
The move that matters next is whether the market keeps paying for the rerating, or whether something orthogonal - capex digestion, a faster competitor, a recession, a geopolitical shock - makes the price column collapse before the EPS column catches up.
That is exactly the question Intel’s shareholders faced in October 1999. They had no idea what was about to come. Now we have, and we may end up earlier.
Sources
[1] NASDAQ Composite Index, daily 1971-2026, FRED St. Louis Fed series NASDAQCOM. https://fred.stlouisfed.org/series/NASDAQCOM
[2] S&P 500 Index, daily 2016-2026, FRED St. Louis Fed series SP500. https://fred.stlouisfed.org/series/SP500
[3] FactSet Earnings Insight, “S&P 500 Earnings Season Update: May 1, 2026” - reported S&P 500 forward 12-month P/E of 20.9x at index price 7,337.11, above the five-year average of 19.9x and the ten-year average of 18.9x. https://insight.factset.com/sp-500-earnings-season-update-may-1-2026
[4] Yardeni Research / Refinitiv I/B/E/S - S&P 500 forward P/E peaked at a record 24.5x during July 1999, with the S&P 500 Information Technology sector hitting a record high of 48.3x in March 2000. https://yardeni.com/charts/stock-market-p-e-ratios/
[5] Seeking Alpha - NVIDIA Corporation valuation page, May 8, 2026, “2027 Estimated, using the consensus earnings estimate: 25.36.” https://seekingalpha.com/symbol/NVDA/valuation
[6] Seeking Alpha - Intel Corporation valuation page, May 7, 2026: P/E Non-GAAP (Forward) = 104.24, P/E GAAP (Forward) = NM, share price $113.86. https://seekingalpha.com/symbol/INTC/valuation
[7] Motley Fool archived column citing Intel valued at 23.3 times 1999 EPS estimates of $3.77 per share on September 25, 1998. https://www.fool.com/
[8] Motley Fool archived column dated October 12, 1999, stating: “At $76, Intel trades at 28 times year 2000 estimates.” https://www.fool.com/
[9] CNBC, “Nvidia stock closes at record, pushing market cap past $5 trillion,” April 24, 2026. Confirms NVIDIA closed at $208.27 (+4.3%), Intel jumped 24% (best day since 1987), AMD +14%, Philadelphia Semiconductor Index at all-time high. https://www.cnbc.com/2026/04/24/nvidia-stock-closes-at-record-pushing-market-cap-past-5-trillion.html
[10] Bank of America hyperscaler capex tally as reported by CNBC, May 6, 2026: 2026 guidance Alphabet $185B (+4%), Amazon $200B (+1%), Meta $135B (+8%), Microsoft $190B (+24%); combined approximately $650B. https://www.cnbc.com/2026/05/06/nvidia-is-falling-behind-as-semiconductors-surge-heres-what-analysts-say-is-going-on.html
[11] TradingKey, “NVIDIA Stock: Breaking Down Its Key Risk and Why It’s Still a Compelling Buy in 2026,” confirming NVIDIA fiscal-year 2026 revenue of $215.9 billion (+65% YoY), with data center segment of $193.7 billion. https://www.tradingkey.com/analysis/stocks/us-stocks/261841725-us-stock-nvidia-nvda-gpu-2026-ai-tpu-nasdaq-tradingkey
[12] Capital.com market data, May 7, 2026: NVIDIA market capitalisation $5.05 trillion. https://capital.com/en-int/markets/shares/nvidia-corp-share-price/market-cap
Article written by Data Driven Stocks. Follow @stockdatamarket on X for more data-driven market analysis.

