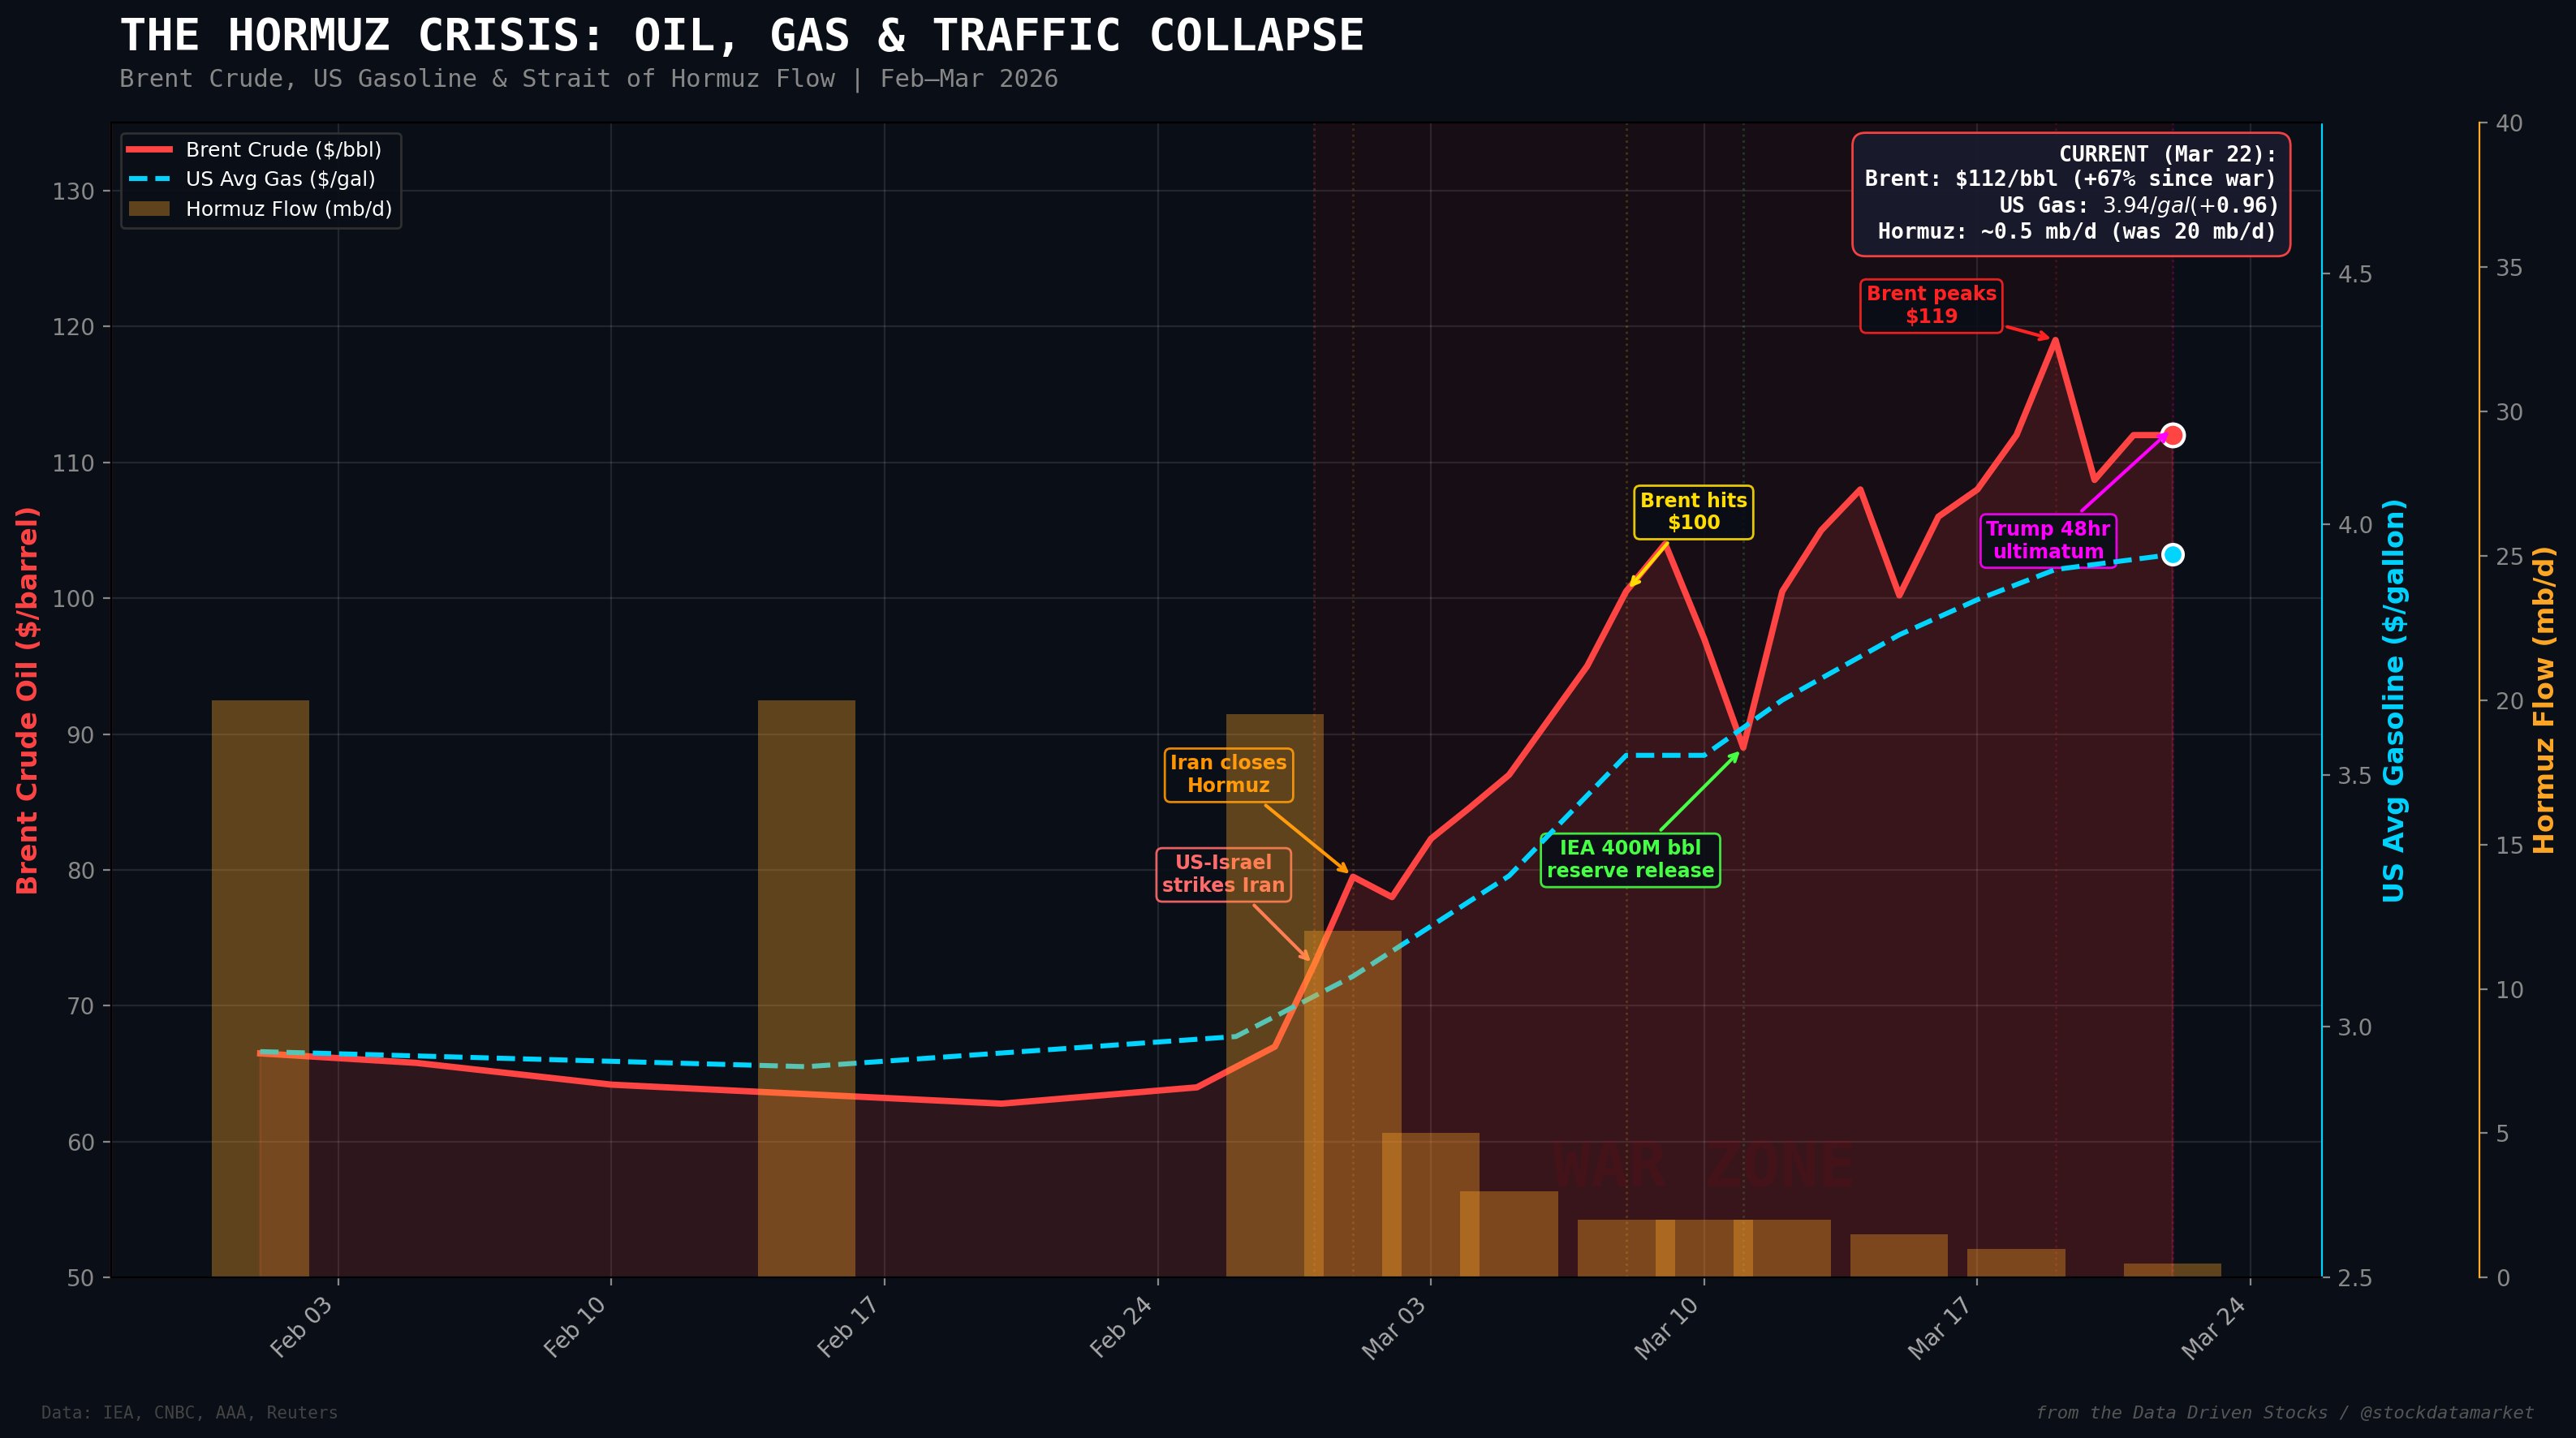
Dark Ages 2.0: What Happens if Iran Nukes the Gulf’s Infrastructure and Permanently Closes Hormuz
The 48-hour ultimatum, Iran’s "nuclear" response, and the modeling of the worst oil shock in human history

On Saturday night, March 22, 2026, Donald Trump posted what might be the most consequential Truth Social message in the platform’s history. In all caps, naturally. “If Iran doesn’t FULLY OPEN, WITHOUT THREAT, the Strait of Hormuz, within 48 HOURS from this exact point in time, the United States of America will hit and obliterate their various POWER PLANTS, STARTING WITH THE BIGGEST ONE FIRST.”
Iran didn’t flinch. Within hours, the Iranian military responded with a threat so sweeping it made the original ultimatum sound polite. Tehran vowed to permanently close the Strait of Hormuz, destroy all IT, energy, and water desalination infrastructure across the Middle East, and target the power plants of every regional country hosting US bases. Iran’s Parliament Speaker Mohammad Baqer Qalibaf said the quiet part loud: critical infrastructure and energy facilities across the region would be “irreversibly destroyed.” Iran’s semi-official Mehr News agency published a map of Gulf power plants with the caption: “Say goodbye to electricity.”
In short, Iran is threatening to send Saudi Arabia, the UAE, Qatar, and the rest of the Gulf Cooperation Council back to the Dark Ages. Not metaphorically. Literally.
So let’s do what the markets are scrambling to do right now: model what actually happens to the global economy if Iran follows through.
The Strait That Holds the World Hostage
To understand why this matters, you need to understand one narrow body of water. The Strait of Hormuz is just 21 miles wide at its narrowest point, a sliver of sea between Iran and Oman. In peacetime, roughly 20 million barrels of oil pass through it every single day. That is approximately 20% of the world’s entire oil supply. Qatar’s massive LNG operations — accounting for roughly 19% of global liquefied natural gas trade, or about 80 million tons per annum — also flow through this chokepoint. The IEA’s head described what has happened since February 28 as the “greatest global energy security challenge in history.” That is not hyperbole. The numbers confirm it.

Since the US and Israel launched strikes on Iran on February 28, the Strait has gone from carrying 20 million barrels per day to essentially zero. The IEA’s March 2026 Oil Market Report laid it out plainly: crude and oil product flows through Hormuz have plunged from around 20 mb/d to “a trickle,” and Gulf countries have been forced to cut total oil production by at least 10 mb/d. That makes it not just the biggest disruption this year, or this decade, but the largest supply disruption in the entire history of the global oil market.
The bypass options are woefully inadequate. Saudi Arabia has its East-West pipeline, which can handle roughly 5 mb/d, and the UAE has the Habshan-Fujairah pipeline at about 1.8 mb/d. Together, they cover less than 9 mb/d against a 20 mb/d gap. Ships are rerouting via the Suez Canal or around the Cape of Good Hope, adding 7 to 10 days to transit times and massively inflating costs. Container lines including Maersk, Hapag-Lloyd, and CMA CGM have announced diversions. But rerouting is not replacing. The physical barrels simply are not there.
The Price Shock: $67 to $119 in Three Weeks
Before the war started, Brent crude sat at around $67 per barrel. By March 8, it crossed $100 for the first time since August 2022. On March 19, it briefly touched $119. As of this writing, it hovers around $112. Goldman Sachs has warned that if depressed flows persist, Brent could exceed its 2008 all-time high of $147.50.
The Goldman Sachs research team estimates that the market has priced in a risk premium of roughly $14 per barrel above the estimated fair value of $65. But that premium assumes a relatively short disruption. If the Strait stays closed for 60 days and Middle East production falls by 2 mb/d for an extended period afterward, Goldman sees Brent surging an additional $42 per barrel through the end of 2027. Their Q4 2026 forecast was raised from $66 to $71, but the current spot price sits more than $40 above that number, which tells you the market thinks this is far from over.
For American consumers, the translation is already painful. Gas prices hit $3.94 per gallon on March 22 according to AAA, up from $2.98 the day before the war started. That’s a 32% surge in just over three weeks. Diesel is approaching $5 per gallon, up $1.34 from a month ago. And those are national averages — California already crossed $5 per gallon the second week of March.

The ripple effect goes far beyond the pump. Asian jet fuel prices have surged roughly 85%. European diesel has essentially doubled. Asian naphtha — the feedstock for plastics manufacturing — is up about 45%, and Asian petrochemical crackers have already declared force majeure. LNG spot prices in Asia jumped 40 to 60%. And then there’s shipping insurance: marine war-risk premiums have exploded from about 0.25% of vessel value to roughly 3%, a tenfold increase that translates to millions of dollars per voyage. The IEA released 400 million barrels of emergency reserves — the largest such release in history — and the market basically shrugged. As ING strategists noted, the only thing that will sustainably bring prices down is oil actually flowing through Hormuz again.
The Cascade: How Gulf Destruction Infects the Global Economy
This is where things get genuinely scary. Iran’s threat is not just to close a waterway. It’s to destroy the physical infrastructure that makes the modern Gulf economy function: power plants, water desalination (which Gulf states depend on for a vast majority of their drinking water), IT systems, and energy production facilities. If Iran follows through, the shock propagates through six distinct layers.

The first layer is the immediate supply shock. Oil and LNG production across the Gulf simply ceases. We are talking about 8 to 12 million barrels per day vanishing from global supply, plus 80 million tons per annum of LNG. There is no spare capacity on Earth that can replace this overnight.
The second layer is the price spike. Brent would likely surge to $130 to $150+ per barrel in a catastrophic scenario. Shipping reroutes add a week or more to every voyage. Insurance becomes either unpayable or unavailable. War exclusions kick in across the Lloyd’s market.
The third layer is sector-by-sector contagion. Petrochemical manufacturing seizes up because roughly 60% of Asia’s naphtha comes from the Middle East. Aviation hubs like Dubai, Abu Dhabi, and Doha — which handle over 1,200 daily flights globally — shut down or operate at minimal capacity. Gulf aluminum smelters (about 20% of global capacity) go dark. Auto manufacturers, already suffering chip shortages, now face raw material shortages too.
The fourth layer is the financial system. S&P estimates that up to $307 billion in deposits could flee Gulf banks if the war worsens. AWS cloud data centers in the UAE and Bahrain have already been physically attacked, causing outages. Cyber insurers are tightening war exclusions. US equities fell roughly 5.5% in the first weeks of the conflict, and the Dow entered negative territory for 2026.
The fifth layer is the macroeconomic fallout: inflation surges, GDP contracts, and central banks are trapped between fighting inflation and preventing recession. Goldman Sachs estimates the war will reduce global GDP growth by 0.3% and boost headline inflation by 0.5 to 0.6 percentage points. But that assumes the conflict remains contained. It is not contained.
Modeling the GDP Damage: Who Gets Hit Hardest
The IMF’s rule of thumb is straightforward but terrifying at scale: every 10% increase in oil prices, if persistent, adds roughly 0.4 percentage points to global inflation and shaves 0.1 to 0.2% off global GDP. Brent has already risen about 67% from pre-war levels. Do the math.

The damage is strikingly uneven across economies. The United States, which is a net energy exporter and sources only about 5% of its oil via Hormuz, would feel a GDP drag of roughly 0.2% in a baseline scenario and up to 1.0% in a catastrophic one. The pain for Americans is mostly at the pump and in downstream inflation on goods and services. The Eurozone faces a deeper hit — anywhere from 0.3% to 1.5% GDP loss — because Europe remains heavily dependent on energy imports and still sources roughly 14% of its LNG from Qatar.
China presents an interesting case. About a third of China’s oil arrives via Hormuz, but Beijing has been aggressively securing alternative supply from Russia and building its strategic reserves (roughly a billion barrels). GDP impact ranges from 0.1% in a baseline to 0.6% in the worst case. China will absorb this better than most, but even a 0.3% hit on the world’s second-largest economy sends tremors everywhere.
India, though, is the most exposed major economy on the planet. Roughly 70% of India’s LNG and 40% of its oil imports transit the Strait of Hormuz. A severe conflict could add 1 to 2 percentage points to Indian inflation, and GDP could contract by as much as 2.5% in a catastrophic scenario. Japan is in a similar bind — about 60% of its crude oil imports come via Hormuz, and Japanese refiners have already asked the government to release stockpiled oil.

Pakistan and Bangladesh, already struggling with debt and inflation, face something closer to economic catastrophe. Pakistan sources about 60% of its oil and 80% of its LNG through the Strait. Islamabad has already officially requested that Saudi Arabia reroute oil supplies through the Red Sea port of Yanbu — a sign of how desperate the situation has become.
The $147 Myth: Why the 2008 “Record” Is a Dangerous Mirage
Here is the thing nobody on financial TV is telling you. Everyone keeps citing the 2008 all-time high of $147.50 per barrel as the ceiling. Goldman Sachs warns Brent could “exceed its 2008 all-time high.” Traders watch the $147 level like a red line. But that number is a mirage, because it is not adjusted for inflation.
In 2026 dollars, the July 2008 peak of $147.30 is worth approximately $211 per barrel. That is the real ceiling. Euronews ran this calculation explicitly in a March 12 analysis, and inflationdata.com’s CPI-adjusted historical charts confirm it: the 2008 monthly peak, when adjusted for cumulative consumer price inflation, lands at roughly $189 to $211 depending on the exact month and index used. The point is stark: at today’s $112 per barrel, Brent is not “approaching the record.” It is roughly $100 below the real record. There is a staggering amount of room to run.

This matters enormously for scenario modeling. When analysts like Bob McNally of Rapidan Energy Group say “nobody knows what the demand destruction level is, but it may well be above previous nominal highs,” he is implicitly acknowledging that the real price ceiling could be far higher than $147. Former IMF economist Oliver Blanchard has stated that the supply deficit combined with oil’s very low demand elasticity suggests prices “should be closer to $150 or $200 per barrel, or even higher.” Wood Mackenzie says $200 is “not outside the realms of possibility.” Deutsche Bank’s Michael Hsueh says Brent would “surge toward $200” if Iran enforces a full Hormuz closure with mines and anti-ship missiles. The Middle Eastern physical benchmark has already touched $150, according to Onyx Capital Group’s Greg Newman.
Oxford Economics has identified $140 as the threshold where the global economy tips into a mild recession, cutting world GDP by 0.7% by year-end. That level is just $28 above current prices.
The Scenarios: Four Oil Price Paths for 2026 (Including the Extreme)

Capital Economics projects that a 3-month conflict could spike Brent to $150 in Q2 and then collapse to $65 by year-end, while a prolonged war keeps it around $130 well into 2026. Goldman Sachs raised its Q4 2026 Brent forecast to $71 (from $66), but that number assumes gradual flow recovery — an assumption that looks increasingly optimistic with each passing day.
In the baseline scenario (quick resolution within 1 to 3 months), Brent would spike and then fall back to the $70s by Q4 as reserves are drawn down and alternative routes come online. GDP damage is manageable, if painful. The global economy takes a hit but doesn’t enter recession.
In the severe scenario (prolonged 3 to 12 months), oil stays between $100 and $120 for most of the year. Central banks are forced to tighten monetary policy even as growth stalls. Trade volumes drop 2 to 5%. A mild global recession of –0.5 to –1% growth becomes likely. Emerging markets with current-account deficits (Turkey, Egypt, Pakistan) face serious balance-of-payments crises.
In the catastrophic scenario (years-long conflict with permanent infrastructure damage), Brent stays above $125 for the foreseeable future. Goldman has warned it could exceed the 2008 nominal high of $147.50. Global GDP losses of 1 to 3% materialize across G7 economies. India could see outright economic contraction. Trade realigns permanently as countries frantically diversify away from Gulf supply.
And then there is the extreme scenario, the one Iran is explicitly threatening right now: full destruction of Gulf infrastructure, permanent Hormuz closure, and targeting of desalination, IT, and energy systems across the entire region. In this scenario, modeled using the Deutsche Bank and Wood Mackenzie frameworks, Brent surges toward $185 to $200 per barrel by mid-2026 before demand destruction begins to cap prices. At $200, US gasoline would approach $6.50 per gallon. Global GDP would contract by 1.5 to 3%. And here is the kicker: even at $200, Brent would still be below the inflation-adjusted 2008 peak of $211. The real ceiling may be higher than anyone on Wall Street is publicly admitting.
The Human Cost: 10 Million Workers in Limbo
The economic modeling tends to obscure a staggering human dimension. Roughly 8 to 10 million South Asian workers — from India, Pakistan, Bangladesh, the Philippines, and beyond — live and work in the Gulf states. If Iran destroys the infrastructure that supports these economies, the 1990 Gulf War provides a grim preview. During that conflict, approximately 500,000 Filipino workers had to be evacuated from Kuwait and Saudi Arabia, costing the Philippines between $1 and $3 billion in lost remittances.
Scale that to today’s numbers. The Gulf is the largest remittance-sending region in the world. If those flows stop, the Philippines loses roughly 3% of GDP. Pakistan and Bangladesh face similar jolts. The World Bank has warned repeatedly that conflict-driven shocks can sharply contract consumption and spill over into broader financial turmoil.
And this ignores the genuine refugee crisis that could emerge. UNHCR data already shows over 600,000 displaced Iranians as of mid-March 2026. If the conflict spreads to involve proxy forces in Lebanon, Yemen, or Iraq — all entirely plausible — the humanitarian displacement could dwarf current crises.
What the Policy Toolbox Looks Like (and Why It’s Not Enough)
Governments are not sitting idle. The IEA’s 400 million barrel emergency release was the largest in history. The US released 172 million barrels from the Strategic Petroleum Reserve. The Trump administration temporarily waived sanctions on Iranian oil (in the middle of a war against Iran — yes, really) and eased some restrictions on Russian crude. OPEC+ pledged to add 206,000 barrels per day. The Jones Act was lifted to ease domestic shipping. Countries from the Philippines to Slovenia adjusted fuel regulations.
But here is the fundamental problem: none of these measures can replace 10 million barrels per day that used to flow through a single chokepoint. Strategic reserves are a finite buffer — the US SPR was already at historically low levels before this began. Alternative routes add cost and time, not capacity. And OPEC+’s promised increase of 206,000 bpd is roughly 2% of what was lost. As one IEA analyst put it, “the market runs on barrels moving, not announced barrels.”
Goldman Sachs has modeled a scenario where governments release 254 million barrels from strategic reserves alongside 31 million barrels of additional Russian supply. Even that ambitious response would only close about half the gap in commercial inventories.
The Bottom Line
Iran’s threat to destroy Gulf infrastructure and permanently close Hormuz is not just posturing. The war is entering its fourth week. Brent is at $112. US gas is at $3.94 and climbing. Goldman Sachs says triple-digit oil could persist into 2027. The IEA says this is the largest supply disruption in the history of the global oil market. And the 48-hour clock is ticking.
If Iran follows through on its threat, we are looking at the most severe energy shock since the 1973 embargo — except with a far more interconnected, just-in-time, globally integrated economy that has far fewer buffers. The cascade from supply shock to price spike to financial contagion to GDP contraction to humanitarian crisis is not theoretical. Parts of it are already happening.
And the ceiling is far higher than most people realize. The 2008 “record” of $147.50 is worth $211 in today’s money. At $112, Brent is barely halfway to the real all-time high. Multiple credible analysts — Deutsche Bank, Wood Mackenzie, former IMF economists — are now modeling $150 to $200 scenarios that were considered “tail risk” just three weeks ago. Oxford Economics puts the global recession trigger at $140, which is only $28 from here.
The question is no longer “will this be bad.” It is “how bad, how high, and for how long.”
The world economy is holding its breath. The Strait of Hormuz is 21 miles wide, 10 million barrels per day short, and $100 below the inflation-adjusted ceiling that nobody is talking about.
This article is for informational and analytical purposes only. It does not constitute investment or financial advice.
Sources
Al Jazeera, “Trump issues 48-hour Hormuz Strait ultimatum, threatens Iran’s power plants,” March 22, 2026.
CNN, “Iran vows to ‘irreversibly’ destroy infrastructure after Trump’s ultimatum on Strait of Hormuz,” March 22, 2026.
CNBC, “Brent oil closes at $100 after Iran’s new supreme leader says Strait of Hormuz must remain closed,” March 12, 2026.
CNBC, “Goldman Sachs: Brent oil prices could surge past record high if Iran war disruption persists,” March 20, 2026.
CNBC, “Oil prices fall as Trump pressures allies to help protect tankers in Strait of Hormuz,” March 15, 2026.
CNBC, “Oil prices fall after Brent briefly touches $119 as Netanyahu says Israel helping to open Strait of Hormuz,” March 19, 2026.
NBC News, “Iran unswayed by Trump’s 48-hour deadline and threats to ‘obliterate’ energy infrastructure,” March 22, 2026.
NBC News, “The Iran war already hit gas prices. What it’s coming for next,” March 21, 2026.
NPR, “Gasoline prices are still rising as the Iran war stretches into its third week,” March 16, 2026.
NPR, “Why it’s so hard for world leaders to bring down oil and gasoline prices,” March 20, 2026.
Time, “From Gas to Groceries, the War in Iran Will Worsen America’s Cost-of-Living Crisis,” March 18, 2026.
IEA, Oil Market Report — March 2026.
Goldman Sachs, “How Will the Iran Conflict Impact Oil Prices?,” March 3, 2026.
Goldman Sachs Research, Q4 2026 oil price revision note, March 12, 2026 (via Reuters).
Fox Business, “Goldman Sachs says Iran war unlikely to trigger COVID-like supply crisis,” March 14, 2026.
Euronews, “Iran threatens to retaliate after Trump gives 48-hour ultimatum to reopen Strait,” March 22, 2026.
Axios, “Trump to Iran: Open Hormuz in 48 hours or U.S. bombs power plants,” March 22, 2026.
UNCTAD, “Strait of Hormuz disruptions: Implications for global trade and development,” March 2026.
Wikipedia, “2026 Strait of Hormuz crisis” and “Economic impact of the 2026 Iran war,” accessed March 22, 2026.
S&P Global, Gulf bank deposit flight estimates (cited via reporting).
IMF, World Economic Outlook guidelines on oil price shock transmission.
Capital Economics, Iran conflict oil price scenario projections (cited via reporting).
AAA, US gasoline and diesel price tracker, accessed March 22, 2026.
CNBC, “Oil prices: Why traders are getting nervous about Iran’s $200 warning,” March 16, 2026.
Al Jazeera, “Could oil hit $200 a barrel? Analysts no longer think it is far-fetched,” March 19, 2026.
Euronews, “Could oil prices really reach $200 as claimed by Iran?,” March 12, 2026.
EBC Financial Group, “Will Oil Prices Reach $200 as Iran Predicts?,” March 19, 2026.
inflationdata.com, “Oil Price History Chart (Inflation-Adjusted) — 1946–Present,” accessed March 22, 2026.
Britannica Money, “Highest Crude Oil Price: WTI Historical Chart, Nominal & Inflation-Adjusted,” accessed March 22, 2026.
Straight Arrow News, “How today’s gas prices compare to a 30-year history of inflation,” March 2026.
Wood Mackenzie, Brent oil price scenario analysis (cited via Al Jazeera and CNBC reporting), March 2026.
Deutsche Bank, Michael Hsueh research note on Hormuz full-closure scenario (cited via CNBC), March 2, 2026.
Oxford Economics, oil price recession threshold analysis (cited via Euronews and EBC), March 2026.
J.P. Morgan Global Research, Oil Price Forecast for 2026, Natasha Kaneva.
devere-group.com, “Will Oil Hit $200? Expert Predictions Amid Middle East Supply Shocks,” March 2026.

