Bond Market Is Eroding, MOVE Index Is Exploding, and the War in Iran Makes It Much Worse
Three weeks into the Iran war, global sovereign debt is repricing at a pace not seen since the 2022 inflation shock. The safe-haven playbook is broken. Here’s what the data says.

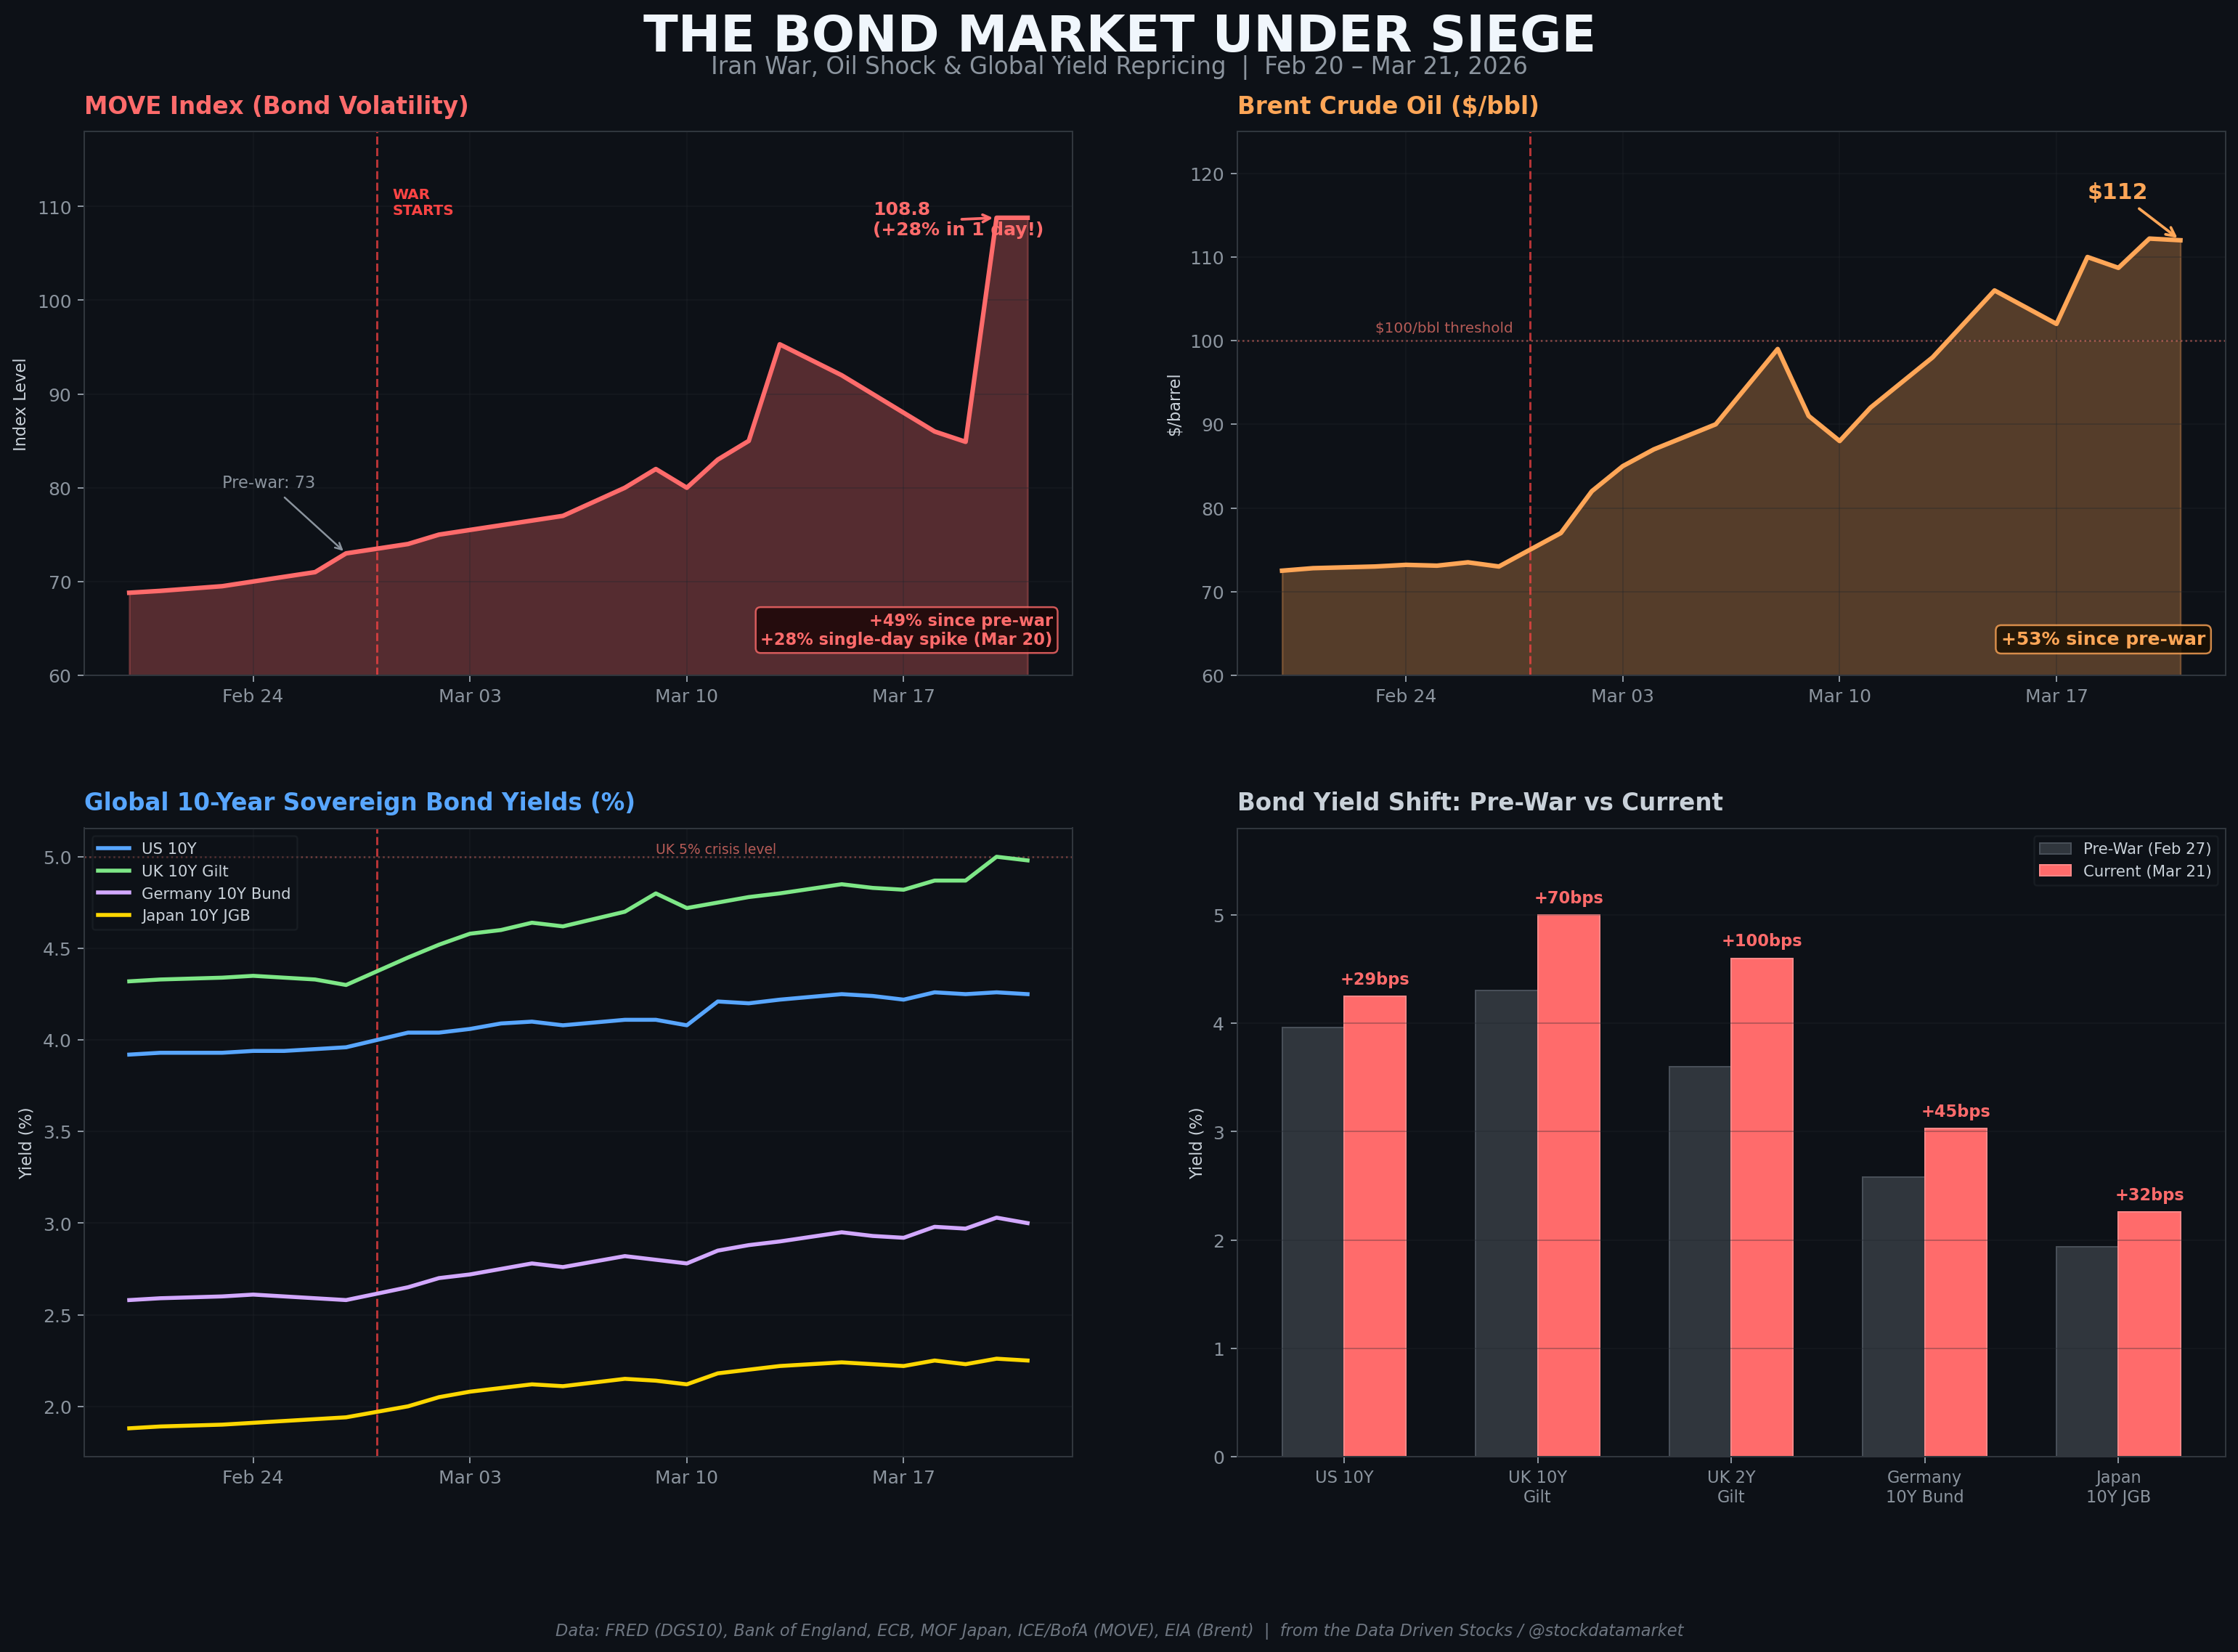
If you’re a bond investor in March 2026, the last three weeks have felt like a slow-motion car crash. Actually, scratch that — it hasn’t been slow at all. Since the United States and Israel launched joint strikes on Iran on February 28, the global sovereign debt market has entered a regime that defies the traditional safe-haven playbook. Yields aren’t falling on geopolitical fear. They’re rising. And rising fast.
The MOVE Index — often called the “VIX for bonds” — was sitting at a sleepy 73 on February 27, just before the first strikes. As of March 21, it stands at 108.8 — a cumulative gain of 49%, including a jaw-dropping 28% single-day spike on March 20 alone, the kind of move that simply does not happen in the bond volatility world. Brent crude, which was drifting around $73 per barrel before the first missiles flew, has ripped through $100 and is now trading around $112 per barrel, with physical crude in Asia hitting astronomical levels above $150. The U.S. 10-year Treasury yield has climbed from 3.96% to 4.25%, UK gilts have breached the psychologically important 5% barrier for the first time since the 2008 financial crisis, and German Bund yields have hit highs not seen since 2011’s eurozone crisis.
This is not your grandfather’s flight to quality. This is an inflation repricing event masquerading as a geopolitical shock. And the bond market is telling you — loudly — that the rules have changed.
The Trigger: February 28 and the Strait of Hormuz
The sequence of events that brought us here is by now well-documented, but the speed at which the situation escalated caught nearly everyone off guard. On February 28, 2026, the United States and Israel launched coordinated air strikes on Iran, killing Supreme Leader Ayatollah Ali Khamenei and targeting nuclear and military infrastructure. Iran retaliated immediately with strikes against U.S. and Israeli assets across the region, and within days, Tehran had effectively closed the Strait of Hormuz to commercial shipping.
That last point is the one that matters most for bond markets. The Strait of Hormuz is the single most important chokepoint in global energy. According to the U.S. Energy Information Administration, roughly 20% of the world’s oil supply and a significant share of global LNG transits through this narrow waterway. The IEA’s March 2026 Oil Market Report described the situation as the largest supply disruption in the history of the global oil market, with crude and product flows plunging from around 20 million barrels per day to a trickle.

Gulf Arab states — Saudi Arabia, the UAE, Kuwait, Iraq — have been forced to slash production because they’re literally running out of storage. Ships won’t transit the Strait. Iran’s new Supreme Leader Mojtaba Khamenei declared the closure should continue as a “tool to pressure the enemy.” Iraq declared force majeure at all oilfields operated by foreign companies because it cannot ship crude. Drones struck refineries in Kuwait. Israel attacked Iran’s South Pars gas field — the world’s largest natural gas reserve — prompting Tehran to issue a list of energy targets it plans to hit in Saudi Arabia, the UAE, and Qatar.
The oil market has responded accordingly. Brent briefly touched $119.50 on March 8 before Trump’s comments about the war being “very complete” briefly dragged prices below $90. But every dip has been bought. As of Friday March 21, Brent closed at $112.19 per barrel after Iraq’s force majeure declaration. Goldman Sachs has warned that Brent could exceed its 2008 all-time high of $147.50 if disrupted flows persist for 60 days. Saudi officials reportedly expect prices could reach $180 if disruptions last through late April.
“The oil market challenges we are facing are unprecedented in scale.” — International Energy Agency, March 2026 Oil Market Report
Why Bonds Are Selling Off Instead of Rallying
Here’s where it gets interesting — and counterintuitive. In the textbook geopolitical shock, investors flee to the safety of government bonds, pushing prices up and yields down. We saw this during the Gulf War, after 9/11, and in the early days of the Russia-Ukraine conflict. But this time, the opposite is happening. Yields are surging across the developed world, meaning investors are selling government bonds into a war.
The reason is simple but profound: this is an inflation shock first and a geopolitical shock second. When oil prices rocket from $73 to $112 in three weeks, the bond market doesn’t care about flight-to-quality — it cares about what $112 oil means for the consumer price index six months from now. Luke Hickmore at Aberdeen Investments captured it perfectly when he noted that government bonds had “defied safe haven status” because the shock is coming through energy prices and inflation, not through a collapse in demand. When inflation is the problem, bonds do not provide shelter.

Mohamed El-Erian, chief economic adviser at Allianz, summed it up on the first trading day after the strikes: “The bond market has said, ‘I’m more worried about inflation than I am about growth, than I am about flight to quality.’” He pointed to the surge in oil prices combined with the ISM Manufacturing prices-paid component — which soared 11.5 points to 70.5 in February — as evidence that inflation pressures were building even before the war’s full impact hit consumer prices.
The transmission chain works like this: war disrupts oil supply, oil prices spike, energy costs feed through to transportation, manufacturing, and consumer prices, inflation expectations rise, bond investors demand higher yields to compensate for the loss of purchasing power on their fixed-income payments, and central banks are forced to hold rates higher for longer — or even contemplate hikes — rather than cutting as the market had expected just weeks ago.
Key Numbers — Since Pre-War (Feb 27):
Brent Crude: $73 → $112/bbl (+53%) · US 10-Year: 3.96% → 4.25% (+29 bps)
UK 10-Year Gilt: 4.30% → 5.00% (+70 bps) · UK 2-Year Gilt: 3.60% → 4.60% (+100 bps)
Germany 10Y Bund: 2.58% → 3.03% (+45 bps) ·
Japan 10Y JGB: 1.94% → 2.26% (+32 bps)
MOVE Index: 73 → 108.8 (+49%, including +28% single-day spike on Mar 20)
The MOVE Index: Bond Volatility Is Screaming
The ICE BofA MOVE Index is one of those indicators that doesn’t get enough love in mainstream financial coverage. While everyone obsesses over the VIX (equity volatility), the MOVE index measures implied volatility in U.S. Treasury options across the 2-year, 5-year, 10-year, and 30-year maturities. It’s the single best gauge of how stressed the bond market actually is — and right now, it’s screaming.
What makes the current episode so striking is the pattern. The MOVE was hovering around 60 in late 2025 and early 2026 — firmly in “calm” territory. It crept up to 73 by the eve of the war and then rose gradually through early March as yields drifted higher, reaching the mid-80s to mid-90s range. Then on March 20, something snapped. In a single trading session — the day after both the Bank of England and ECB held rates but issued hawkish warnings about inflation, and as the bond rout deepened across the G7 — the MOVE exploded 28.24% in one day, rocketing from 84.9 to 108.8. A one-day move of that magnitude in an implied volatility index is extraordinary. It signals that the options market suddenly repriced the entire distribution of where rates could go.

For context, the MOVE hit 264 during the 2008 financial crisis, nearly 200 during the SVB banking crisis in March 2023, and 161 during the UK mini-budget debacle in 2022. At 108.8, we’re not at those crisis levels — yet. But what should concern you is the velocity: going from 73 to 108.8 in three weeks, with the bulk of that move happening in a single session, suggests this isn’t a gradual repricing — it’s a market that was building pressure and then violently decompressed. The MOVE had been drifting higher since the January 2026 Japan JGB crisis (where 40-year yields blew out to 4%), and the Iran war acted as the catalyst that broke the dam.
Why does a rising MOVE matter beyond academic curiosity? Because volatility feeds on itself. When the MOVE rises, margin requirements for leveraged bond positions increase. That forces hedge funds and systematic strategies to reduce their positions, which means selling bonds, which pushes yields higher, which increases volatility further. It’s a reflexive feedback loop — the very mechanism that turned the 2022 UK gilt crisis from a wobble into a full-blown pension fund blowup. BIS research has documented how this channel operates: rates volatility spikes can force leveraged investors to reduce risk, pushing yields higher even when the fundamental macro news would imply lower yields. A 28% single-day MOVE spike is exactly the kind of event that triggers those margin cascades.
The U.S. Treasury Market: Inflation Wins, Safety Loses
The U.S. 10-year yield’s journey since February 28 tells the story of a market that tried to play the safe-haven game and quickly gave up. On the Monday after the first strikes, the 10-year yield jumped 8 basis points to 4.044% — the opposite of what you’d expect in a war scenario. By March 11, it had surged to 4.214%, and after the Fed’s March 18 meeting (where rates were held at 3.50%-3.75%), yields pushed to 4.26% by March 20 as the bond rout deepened on the back of escalating strikes and no sign of a ceasefire.
Charles Schwab’s fixed income research team noted that the 10-year yield jumped from a pre-war low of 3.93% to as high as 4.2% intraday on March 9 — while investors were supposed to be hiding in Treasuries. Instead, the market priced in three simultaneous forces: higher inflation expectations (five-year breakeven rates near one-year highs), reduced expectations for Fed rate cuts (markets have now removed basically every cut from 2026 and begun pricing hike odds), and a rising term premium reflecting pure uncertainty about where policy goes from here.
Fed Governor Christopher Waller revealed on March 20 that he had planned to dissent in favor of a rate cut at the March meeting because of weaker-than-expected job growth in February. But the oil shock changed his mind. Rate futures now assign a 32% probability of a Fed hike by November, up from essentially zero before the war. That’s an extraordinary swing in expectations in just three weeks.
UK Gilts: The Perfect Storm Gets Worse
If the U.S. bond market’s reaction has been unsettling, the UK gilt market has been outright brutal. Two-year gilt yields have surged 100 basis points since pre-war levels — from 3.60% to 4.60% — in the largest short-duration selloff since the Liz Truss mini-budget chaos of 2022. Ten-year gilts breached 5% on March 20, the highest since the 2008 financial crisis. And 30-year gilts, which were already trading above 5% before the war, have pushed past 5.35%.

The UK is being punished for three structural vulnerabilities that the Iran war has cruelly exposed. First, the UK is a major energy importer with heavy dependence on natural gas, which means wholesale price increases pass through to households and firms more fully than in the U.S. or even continental Europe. Second, the UK came into this shock with the highest government borrowing costs of any G7 nation — fiscal headroom was already razor-thin. Pantheon Macroeconomics estimates that if current yield levels are sustained, they will cut the Chancellor’s fiscal headroom by £7.1 billion. Third, there’s political risk: betting markets show an almost 50% chance that Prime Minister Keir Starmer won’t be in office by the end of June.
The Bank of England held rates at 3.75% on March 19 but the tone was hawkish. Markets have swung from pricing in multiple rate cuts for 2026 to now pricing in the possibility of hikes — an extraordinary reversal. As one analyst put it, the gilt market went from expecting two rate cuts this year to pricing one rate hike, which he described as “exceptional behaviour from a G7 government bond market.”
Europe and Asia: Nobody Is Safe
The bond rout is truly global. German 10-year Bund yields hit 3.025% on March 20, their highest since the eurozone crisis of 2011. The ECB held rates steady but policymakers warned of growing inflation risks, and brokerages have started penciling in rate hikes from as soon as April. French OATs, Italian BTPs, and peripheral European spreads are all under pressure as the inflation narrative overwhelms any safe-haven bid.
In Asia, the picture is equally uncomfortable. Japan’s 10-year JGB yield rose to 2.26% after the Bank of Japan held rates steady but BOJ board member Hajime Takata dissented for the second consecutive meeting, pushing for a 25-basis-point hike to 1% citing upside inflation risks. Governor Ueda indicated that rate increases remain possible if the Iran conflict’s economic damage proves temporary while core inflation persists. This is notable because Japan is extremely dependent on Middle Eastern oil — the Strait of Hormuz disruption is an existential energy security threat for Tokyo.
Bloomberg reported that bonds from Australia, South Korea, and Indonesia all dropped in the first week of the conflict. The pattern is the same everywhere: inflation fear is dominating safe-haven demand. This is a global supply shock, and because oil is a fungible global commodity, a disruption anywhere affects prices everywhere.
The Macro Dilemma: Stagflation’s Shadow
What makes this episode so dangerous for bonds is that it confronts central banks with the worst possible policy dilemma: a negative supply shock that is simultaneously inflationary (via energy costs) and growth-negative (via real income compression and uncertainty). Dallas Fed research has long emphasized that the critical question with oil shocks is whether “second-round effects” — wage increases and broader price-setting behavior — take hold. If they do, central banks cannot simply “look through” the energy spike and must tighten policy even as the economy weakens.
We’re not there yet, but the conditions are forming. U.S. February CPI showed headline inflation at 2.4%, but the bond market is looking ahead — the oil spike hasn’t yet hit official statistics. The ISM manufacturing prices-paid component jumped to 70.5, suggesting pipeline pressures are building. In the UK, inflation was already at 3% before the war and is now expected to rise further. The FRBSF has published cross-country evidence showing that supply-driven oil shocks propagate into policy rates and nominal yields in ways that demand-driven oil moves do not.
The IMF’s April 2025 Global Financial Stability Report provides an important empirical anchor. After major geopolitical risk events, the median response in advanced-economy yields is actually to decline (flight-to-safety). But averages can be pulled up by outlier events where yields rise and sovereign CDS widens. The Iran war, with its unprecedented oil supply disruption, is shaping up to be precisely such an outlier.
“This is an inflation repricing story. Safe havens do not work in the usual way when bonds have already rallied hard, yields are near their lows, and markets suddenly have to worry about inflation again.” — Craig Veysey, Head of Fixed Income, Guinness Global Investors
What Happens Next: Three Scenarios
The range of outcomes from here is enormous, which is itself part of the problem — uncertainty is what drives term premia higher and keeps the MOVE elevated. Drawing on the scenario framework used by investment banks and the IMF’s geopolitical risk research, there are three broad corridors for how this plays out over the next three months.

In the short war scenario (four to six weeks, ceasefire by mid-April, Brent retreating toward $80), yields could ease modestly from current levels. The rate hike expectations currently priced in would unwind, and some of the 2026 rate cut expectations would return. Goldman Sachs’s base case still sees Brent moderating to the $70s by year-end, which would allow the bond repricing to partially reverse. In this world, the current selloff looks like an opportunity to buy duration.
The prolonged conflict scenario (three to six months, Brent sustained around $120) is where things get genuinely ugly. Rystad Energy’s analysis suggests Brent could reach $135 if the current disruption lasts four months. If oil stays elevated at those levels, central banks in Europe will almost certainly hike, the Fed’s cutting cycle is dead for 2026, and we could see UK 10-year yields push toward 5.5-6.0%. The MOVE would likely push past 120, entering the extreme stress zone. The UK’s fiscal position becomes genuinely precarious at those borrowing costs.
The severe tail scenario (six-plus months, Brent above $150, the conflict widening) is the nightmare: renewed hikes across the G10, disorderly curve steepening, liquidity spirals as leveraged positions unwind, and potential sovereign stress in the most vulnerable energy-importing economies. Saudi officials have reportedly mentioned $180 oil. Gulf Oil’s senior energy advisor warned that if Iran targeted energy infrastructure outside the Persian Gulf — say, a refinery in Rotterdam — “all bets are off and prices could go absolutely apocalyptic.” In that world, the MOVE doesn’t just rise — it could repeat March 2023’s near-200 levels.
What to Watch From Here
The coming weeks will determine which scenario we’re in. The key indicators to monitor, beyond oil prices themselves, are: the pace of Strait of Hormuz reopening (Israel’s Netanyahu claimed on March 19 that Israel is helping reopen the waterway), second-round inflation effects in wage data and corporate pricing surveys, central bank rhetoric on the inflation-growth tradeoff (watch for any shift from “look through” to “respond”), the MOVE index trajectory (a sustained move above 120 would signal extreme stress), and sovereign CDS for vulnerable energy importers.
For bond investors, the uncomfortable truth is that the traditional hedge — holding Treasuries against equity risk — is broken in an inflationary supply shock. As Aberdeen’s Hickmore put it, “In the past, geopolitical shocks often drove yields lower as investors rushed into government debt. This time is different. The shock is coming through energy prices and inflation, not through a collapse in demand. When inflation is the problem, bonds do not provide shelter.”
The bond market is under siege. The MOVE is exploding — 28% in a single day. And until the guns go quiet or the oil starts flowing again, there’s no safe place to hide in fixed income. The only thing that’s certain is that the next few weeks will be some of the most volatile the bond market has seen since 2022 — and possibly since 2008.
Stay data driven.
Sources & References
[1] International Energy Agency (IEA), “Oil Market Report — March 2026,” IEA, Paris, March 2026. https://www.iea.org/reports/oil-market-report-march-2026
[2] U.S. Energy Information Administration (EIA), “The Strait of Hormuz is the world’s most important oil transit chokepoint.” https://www.eia.gov/todayinenergy/
[3] CNBC, “Crude prices close higher as market weighs threats to tankers against IEA oil stockpile release,” March 11, 2026.
[4] CNBC, “10-year Treasury yield tops 4.06% as surging oil prices from Iran conflict raise inflation angst,” March 3, 2026.
[5] CNBC, “Treasury yields climb as bonds sell off and fear grows that Fed rate cuts are off the table,” March 20, 2026.
[6] CNBC, “Government bonds face ‘perfect storm’ as Iran war rattles Europe’s central banks,” March 19, 2026.
[7] CNBC, “UK government borrowing costs hit their highest level since 2008 as inflation fears hit the gilt market,” March 20, 2026.
[8] Reuters, “Global Bond Rout Deepens Amid War-Driven Inflation Concerns,” March 20, 2026, via Global Banking & Finance Review.
[9] Bloomberg, “Iran War: Brent Benchmark Surges While Real-World Oil Costs Climb Even Higher,” March 21, 2026.
[10] Fortune, “Oil prices hit nearly $110 as Iran vows to escalate the war in ‘new ways’,” March 18, 2026.
[11] CNBC, “Oil tops $112 after Iraq declares force majeure due to Iran war,” March 20, 2026.
[12] CNBC, “Brent oil prices could surge past record high if Iran war disruption persists, Goldman says,” March 20, 2026.
[13] Charles Schwab, “What Iran Conflict Could Mean for the Bond Market,” March 13, 2026. https://www.schwab.com/learn/story/what-iran-conflict-could-mean-bond-market
[14] Real Investment Advice, “Treasury Bond Yields Don’t Lie: But Wars Don’t Drive Them,” March 2026.
[15] Morningstar UK, “UK Government Bond Yields Spike as Iran War Upends Interest Rate Outlook,” March 10, 2026.
[16] Morningstar UK, “Where Next for UK Interest Rates and Inflation Amid Iran War?” March 2026.
[17] CNBC, “Bond market’s safe haven status tested as the Iran war drags on,” March 16, 2026.
[18] CNBC, “Bank of Japan keeps rates steady as expected, warns Iran war may push up inflation,” March 19, 2026.
[19] Trading Economics, “Japan Government Bond 10Y” and “Japan 30 Year Bond Yield,” accessed March 22, 2026.
[20] Bloomberg, “Japan Bonds Drop as Inflation Fears Quash Impact of 10-Year Sale,” March 3, 2026.
[21] RSM, “Market Minute: UK gilts more vulnerable than other countries,” March 20, 2026.
[22] ICE/BofA MOVE Index, via TradingView. https://www.tradingview.com/symbols/TVC-MOVE/
[23] IMF, Global Financial Stability Report (GFSR), April 2025 — Chapter on geopolitical risk events and sovereign yield responses.
[24] BIS Working Papers No. 606, “Market volatility, monetary policy and the term premium.”
[25] Federal Reserve Bank of Dallas, research on second-round effects of oil shocks on inflation.
[26] Federal Reserve Economic Data (FRED), Series: DGS10, DCOILBRENTEU, T10YIE. https://fred.stlouisfed.org/
[27] Bank of England, yield curve data and documentation. https://www.bankofengland.co.uk/statistics/yield-curves
[28] Wikipedia, “Economic impact of the 2026 Iran war,” accessed March 22, 2026.
[29] Marketplace.org, “How’s the bond market responding to war in Iran?” March 2, 2026.
[30] LBC, “Government borrowing sees surprise surge amid fears of squeeze from Iran war,” March 20, 2026.


