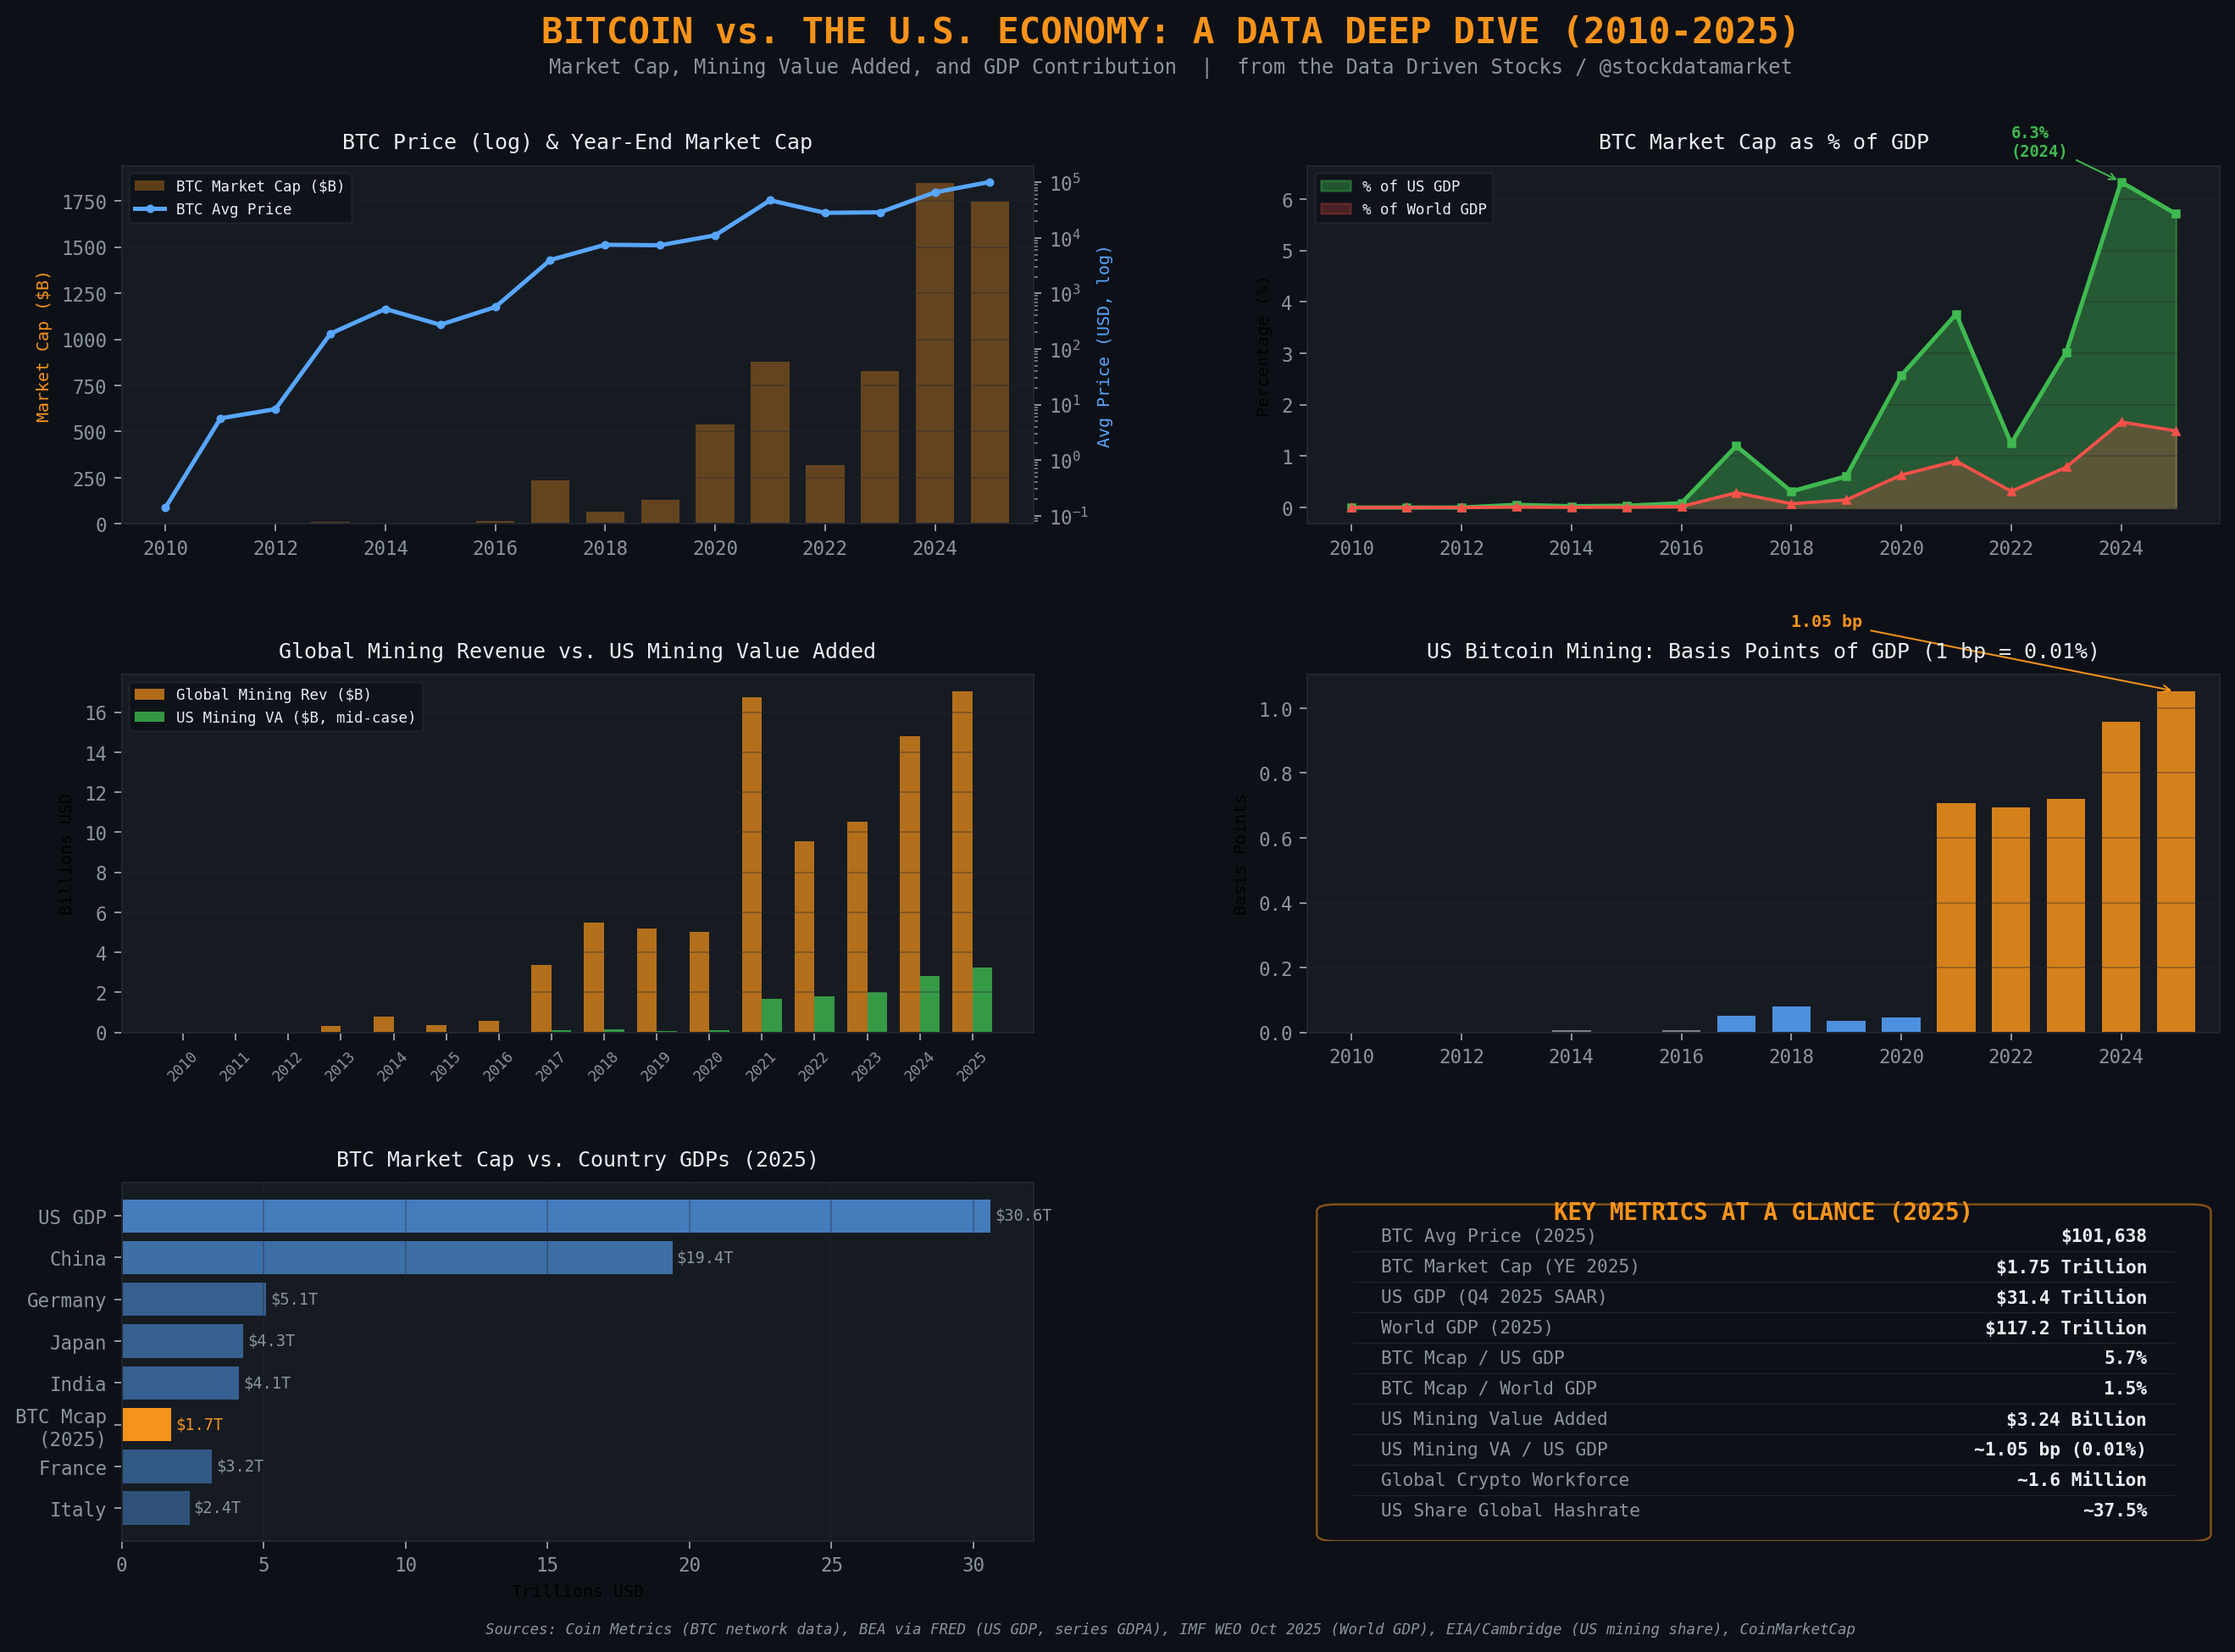
Bitcoin’s $1.75 Trillion Question: Does Crypto Actually Show Up in U.S. GDP - Or Is It All a Mirage?
The data says Bitcoin mining adds just 0.01% or less to America’s $30.6 trillion economy. But the real story is way more complicated.

Bitcoin’s market capitalization sat at roughly $1.75 trillion at the end of 2025. That is a number large enough to rank just below South Korea ($1.86 trillion) and near Australia - around 12th or 13th in the world - if Bitcoin were a sovereign nation. The total crypto market cap, hovering around $2.8 trillion in early 2026, would slot in comfortably between Italy and France on the IMF’s global rankings. Those are staggering comparisons, and they make for viral headlines. But here is the uncomfortable truth that almost nobody in the crypto space wants to talk about: almost none of that shows up in GDP.
Not U.S. GDP. Not world GDP. Not by any standard national accounting measure used by the Bureau of Economic Analysis, the IMF, or any credible statistical agency on the planet.
This article breaks down exactly why that is the case, what Bitcoin actually does contribute to American economic output, and why the gap between perception and reality matters more in 2026 than ever before.
The Trillion-Dollar Disconnect
Let us start with a number that will make most crypto bulls uncomfortable. According to analysis grounded in Coin Metrics network data, EIA and Cambridge hashrate-share estimates, and BEA GDP figures from the FRED database (series GDPA), the estimated U.S. Bitcoin mining value added in 2025 was approximately $3.24 billion under a mid-case scenario. That comes out to about 1.05 basis points of U.S. GDP, or roughly 0.0105%.
Read that again: zero-point-zero-one percent.
The United States produced about $30.6 trillion in nominal GDP in 2025, according to BEA and IMF estimates. Global GDP for the same year reached approximately $117.2 trillion, per the IMF’s World Economic Outlook (October 2025). Bitcoin’s entire measurable, GDP-consistent contribution to the largest economy in human history is smaller than the annual output of many individual counties in rural America.
So where does the disconnect come from? It comes from a fundamental misunderstanding of what GDP actually measures versus what crypto market cap represents.
GDP Is Not Market Cap (And That Matters More Than You Think)
GDP, as defined by the Bureau of Economic Analysis, is the sum of value added across all industries in the economy. Value added equals gross output minus intermediate inputs. When a factory produces $10 million worth of cars but spends $7 million on steel, rubber, electricity, and labor materials, the GDP contribution is $3 million. That is the value added.
Bitcoin’s market capitalization, on the other hand, is just the current price multiplied by the circulating supply. When Bitcoin trades at $70,000 and there are about 20 million coins in circulation, you get a market cap of $1.4 trillion. But that is not production. That is asset valuation. If your house doubles in value overnight, your neighborhood did not suddenly produce more GDP. The same principle applies to Bitcoin.

Bitcoin activities map to GDP through three conceptually distinct channels. The first is proof-of-work mining, which is genuine production. Miners spend electricity, capital, and labor to validate transactions and produce newly minted coins. The gross revenue (block rewards plus transaction fees) can be converted into a value-added estimate by subtracting intermediate inputs like electricity. This is the one channel where a Bitcoin-specific GDP number can be credibly reconstructed.
The second channel is financial services - exchange trading fees, custody fees, ETF expense ratios, and brokerage commissions. These are real GDP-relevant service outputs, but they are recorded inside existing finance and information-sector categories in the national accounts. The BEA does not publish a “Bitcoin services” line item. They get absorbed into the same buckets as stock brokerage and asset management.
The third channel is the one that generates all the headlines: asset appreciation and market cap growth. This is categorically not GDP. When Bitcoin goes from $30,000 to $100,000, that represents a wealth transfer and revaluation, not current production. It matters enormously for portfolios, risk, and financial stability, but it is invisible to the GDP accounts by design.
The Rise of American Mining: From 3% to 38% in Two Years
The story of Bitcoin’s real (if small) footprint in U.S. GDP is inseparable from one of the most dramatic geographic shifts in the history of any industry. In January 2020, the United States accounted for approximately 3.4% of global Bitcoin hashrate, according to Cambridge’s CBECI mining map data cited by the EIA. China dominated, running well over 60% of the world’s mining operations.
Then came the Chinese government’s comprehensive crackdown on crypto mining in mid-2021. Within months, the U.S. share of global hashrate exploded. By August 2021, Cambridge data showed the U.S. at 35.4%. By January 2022, that figure had climbed to 37.84%. Industry estimates for Q1 2026 put it at approximately 37.5%, suggesting the U.S. has held onto its leading position even as other countries like Kazakhstan and Russia expanded their own operations.

This geographic shift is what transformed Bitcoin mining from a rounding error in U.S. economic statistics to something that at least registers on the radar. Before 2021, the U.S. mining value added was essentially negligible, measured in tens of millions of dollars. After the China migration, it jumped to $1.68 billion in 2021, $1.81 billion in 2022, and kept climbing to $3.24 billion in 2025 under mid-case assumptions.
That trajectory is impressive in isolation. The problem is context. Even at $3.24 billion, U.S. Bitcoin mining value added is roughly equivalent to the annual GDP of a small Caribbean nation. It would not crack the top 500 U.S. companies by revenue. And yet, the energy footprint tells a very different story of scale.
The Electricity Question: Small GDP, Big Grid Impact
The EIA’s February 2024 analysis estimated that U.S. Bitcoin mining consumed approximately 25 to 91 terawatt-hours of electricity in 2023, representing somewhere between 0.6% and 2.3% of total U.S. electricity demand. That is an enormously wide range, reflecting just how uncertain the data still is. But even the low end is significant: 25 TWh is roughly the annual electricity consumption of a state like Vermont and Delaware combined.
This creates a paradox that should fascinate any data-driven investor. An industry that contributes about 1 basis point to GDP consumes up to 2.3% of the nation’s electricity. That ratio - tiny GDP contribution, substantial energy draw - is at the heart of virtually every policy debate about Bitcoin mining in the United States today. It also matters for the value-added calculation, because electricity is the primary intermediate input that gets subtracted from mining revenue to arrive at value added.
The analysis uses three scenarios to account for this uncertainty. If electricity represents 30% of mining operating costs (the optimistic case, assuming miners secure extremely cheap power), the U.S. mining value added rises to about 1.47 basis points of GDP. At 50% (the mid-case), it is 1.05 basis points. At 70% (conservative, reflecting higher energy costs), it drops to just 0.63 basis points. The range is wide, but the order of magnitude stays the same: we are firmly in hundredths-of-a-percent territory.
The Animated Story: How We Got Here

The animated chart above tells the story better than any table can. For the first decade of Bitcoin’s existence, U.S. mining value added was a flatline at or near zero. The country simply was not a meaningful mining geography. Then 2021 hit, and the bar chart essentially went vertical. From $0.10 billion in 2020 to $1.68 billion in 2021 - a sixteen-fold increase in a single year. That kind of growth is almost unheard of in any industry, and it was entirely driven by a geopolitical event (China’s mining crackdown) rather than any fundamental change in the economics of Bitcoin itself.
Since 2021, the growth has continued but at a more measured pace, tracking the rise in Bitcoin’s price and the continued expansion of U.S.-based mining operations. Global mining revenue climbed from $5 billion in 2020 to $17 billion in 2025, with the U.S. capturing approximately 37.5% of that total.
If Bitcoin Were a Country: The Market Cap Illusion
Now let us talk about the comparison that crypto Twitter loves and economists hate: stacking Bitcoin’s market cap against national GDPs.

At a year-end 2025 market cap of $1.75 trillion, Bitcoin would rank as roughly the world’s 12th or 13th largest economy if market cap were equivalent to GDP. It would sit just below South Korea ($1.86 trillion GDP) and near Australia, above Spain and Mexico. The entire crypto market, at about $2.8 trillion, would rank 8th in the world - larger than Italy’s entire annual economic output.
These comparisons make for incredible social media graphics. But they are fundamentally misleading, because they compare a stock (accumulated asset value at a point in time) with a flow (annual production of goods and services). Bitcoin’s market cap is analogous to the total value of all real estate in a city; GDP is analogous to the city’s annual economic output. New York City’s real estate might be worth $1.5 trillion, but the city’s GDP is about $800 billion. They are measuring different things.
That said, the comparison is not entirely useless. It does tell us something about Bitcoin’s financial gravity. An asset class with a market cap exceeding $1 trillion creates real economic effects through wealth channels, risk transmission, and capital allocation decisions, even if those effects do not show up directly in GDP. The Federal Reserve’s Financial Stability Reports have consistently flagged crypto-related vulnerabilities precisely because of this growing financial mass.
Bitcoin’s Growing Footprint as Share of GDP

The animated line chart above tracks one of the most telling metrics in this entire analysis: Bitcoin’s market cap expressed as a percentage of U.S. GDP and World GDP over time. The pattern is striking. From 2010 through 2016, the line was essentially at zero. The 2017 rally pushed it to about 1.2% of U.S. GDP, but the 2018 crash brought it right back down. The 2020-2021 bull cycle pushed it above 3.7%, and then the 2024 spot ETF rally sent it to a peak of approximately 6.3% of U.S. GDP.
In 2025, even with Bitcoin averaging over $101,000, the ratio settled around 5.7% as U.S. GDP itself continued to grow. Against world GDP, Bitcoin’s market cap represents about 1.5%.
These are not small numbers. A single asset class representing nearly 6% of the value of the world’s largest economy is historically significant. For context, the entire U.S. agricultural sector contributes about 1% of GDP. The mining and extraction industry (oil, gas, minerals) contributes about 1.4%. Bitcoin’s market cap has reached a scale that, by financial weight alone, rivals some of America’s oldest industries - even if its actual GDP contribution remains a rounding error.
The 2026 Snapshot: Where Things Stand Right Now

As of Q1 2026, Bitcoin trades around $70,000 with a market cap of approximately $1.4 trillion. The U.S. economy reported Q4 2025 GDP at a seasonally adjusted annual rate of $31.4 trillion, with the BEA’s second estimate showing real growth of just 0.7% in that quarter - a notable deceleration from the 4.4% pace of Q3 2025. The government shutdown that ran from early October through mid-November 2025 subtracted approximately 1 percentage point from Q4 growth according to BEA estimates.
For the world economy, the IMF projects 2026 global GDP of approximately $123.6 trillion, with the top five countries (the United States at $31.8 trillion, China at $20.7 trillion, Germany at $5.3 trillion, India at $4.5 trillion, and Japan at $4.46 trillion) accounting for about 55% of the total.
Against that backdrop, Bitcoin’s financial footprint remains substantial but its GDP contribution remains minuscule. The total crypto industry employs approximately 1.6 million people globally as of 2025, with the United States hosting roughly 38% of that workforce. Statista projects U.S. crypto market revenue of approximately $16.7 billion in 2026, which, while meaningful as a service industry, still represents a tiny fraction of the $31.8 trillion U.S. economy.
What the Experts Say: Risk, Not Output
The most influential economic institutions in the world have studied Bitcoin’s macroeconomic impact extensively, and their conclusion is remarkably consistent: crypto’s primary relevance to the real economy comes through risk and interconnections, not through measurable additions to GDP.
The Bank for International Settlements (BIS) argued in its 2022 Annual Economic Report that structural flaws - particularly the lack of a stable nominal anchor and inherent scalability limits - make the crypto ecosystem unsuitable as the basis for a monetary system. The IMF has published multiple papers finding that spillovers between crypto and financial markets intensified over time and can peak during turbulent periods, implying growing potential for shock transmission. The Financial Stability Oversight Council (FSOC) issued a dedicated report on digital asset financial stability risks. The Federal Reserve’s Financial Stability Report has repeatedly discussed crypto-related vulnerabilities.
The consistent message across all these bodies is not that crypto is economically irrelevant. It is that crypto’s relevance runs through channels that GDP does not capture well - portfolio effects, risk-appetite cycles, energy system impacts, and the potential for systemic disruption if adoption deepens without adequate regulation.
The Bottom Line: 2026 and Beyond
Here is what the data tells us with reasonable confidence heading into 2026.
Bitcoin’s measurable, GDP-consistent contribution to U.S. economic output is real but extremely small, on the order of 1 basis point (0.01%) of GDP through mining value added. Adding in financial service fees from exchanges, custodians, and ETF providers probably pushes the total to a few basis points at most, though official data do not allow a clean separation of “Bitcoin-related” financial services from the broader finance sector.
Bitcoin’s market cap, at $1.4 to $1.75 trillion depending on the day, represents a financially significant asset class that would rank among the world’s top 15 economies by size - but market cap is not GDP, and the comparison, while eye-catching, is structurally misleading.
The U.S. became the world’s leading Bitcoin mining jurisdiction essentially overnight in 2021, going from 3.4% of global hashrate to nearly 38% within about 18 months. That geographic shift created a real, measurable (if small) new industry within the U.S. economy, one that consumes between 0.6% and 2.3% of the nation’s electricity.
Most of Bitcoin’s economic impact - the wealth effects, the risk-transmission channels, the infrastructure investment, the energy market distortions, the regulatory apparatus - shows up outside GDP and is better understood through financial stability frameworks than through national income accounting.
And perhaps most importantly: the gap between Bitcoin’s financial weight (trillions) and its GDP contribution (billions) is not a flaw in the data or a failure of measurement. It is a feature of what Bitcoin is. It is primarily an asset, not an industry. Its economic footprint looks much more like gold’s than like manufacturing’s. And just as nobody asks what percentage of GDP gold mining represents when they discuss gold’s role in the global financial system, the GDP question may be the wrong lens entirely for understanding what Bitcoin means for the American economy in 2026 and beyond.
The real question is not whether Bitcoin adds 0.01% or 0.02% to GDP. The real question is what happens to the $31.4 trillion U.S. economy when a $1.4 trillion asset class - part of a crypto ecosystem with an estimated 861 million users worldwide - experiences its next major volatility event, and whether the financial system’s plumbing is ready for it.
That is the trillion-dollar question that the GDP numbers will never answer.
Citations
U.S. Bureau of Economic Analysis (BEA), “Gross Domestic Product [GDP],” FRED, Federal Reserve Bank of St. Louis, series GDPA. https://fred.stlouisfed.org/series/GDP
U.S. Bureau of Economic Analysis, “GDP (Second Estimate), 4th Quarter and Year 2025,” released March 13, 2026. https://www.bea.gov/news/2026/gdp-second-estimate-4th-quarter-and-year-2025
International Monetary Fund, World Economic Outlook (October 2025). Global GDP data accessed via IMF DataMapper and Statista.
Coin Metrics, Community data archives (BTC daily network/market series), distributed under Creative Commons. https://github.com/coinmetrics/data
U.S. Energy Information Administration, “U.S. Bitcoin Mining: Energy Use and Implications,” February 2024. https://www.eia.gov/todayinenergy/detail.php?id=61364
Cambridge Centre for Alternative Finance, Cambridge Bitcoin Electricity Consumption Index (CBECI), Bitcoin Mining Map geographic hashrate estimates.
Bank for International Settlements, Annual Economic Report 2022, Chapter III: “The future monetary system.” https://www.bis.org/publ/arpdf/ar2022e3.htm
International Monetary Fund, “New Evidence on Spillovers Between Crypto Assets and Financial Markets,” Working Paper WP/23/213, September 2023. https://www.imf.org/en/publications/wp/issues/2023/09/30/new-evidence-on-spillovers-between-crypto-assets-and-financial-markets-539476
International Monetary Fund, “Assessing Macrofinancial Risks from Crypto Assets,” Working Paper WP/23/214, September 2023. https://www.imf.org/en/Publications/WP/Issues/2023/09/30/Assessing-Macrofinancial-Risks-from-Crypto-Assets-539473
Financial Stability Oversight Council (FSOC), “Report on Digital Asset Financial Stability Risks and Regulation,” 2022. https://home.treasury.gov/system/files/261/FSOC-Digital-Assets-Report-2022.pdf
Federal Reserve, Financial Stability Report (index). https://www.federalreserve.gov/publications/financial-stability-report.htm
IRS Notice 2014-21: Treatment of virtual currency as property for federal tax purposes. https://www.irs.gov/pub/irs-drop/n-14-21.pdf
Congressional Research Service (CRS), Summary of SEC Approval of Spot Bitcoin ETPs, 2024. https://www.congress.gov/crs_external_products/IF/PDF/IF12573/IF12573.1.pdf
CoinMarketCap, Bitcoin price and market capitalization data, March 2026. https://coinmarketcap.com/currencies/bitcoin/
CoinLaw, “Crypto Industry Employment Statistics 2026: Growth & Careers.” https://coinlaw.io/crypto-industry-employment-statistics/
Visual Capitalist, “Visualizing the $117 Trillion World Economy in 2025.” https://www.visualcapitalist.com/117-trillion-world-economy-in-2025/
Worldometers, “United States GDP (2025),” based on IMF data. https://www.worldometers.info/gdp/us-gdp/
Statista, “Cryptocurrencies - Worldwide,” Market Forecast. User penetration and revenue projections based on IMF/World Bank macro indicators. https://www.statista.com/outlook/fmo/digital-assets/cryptocurrencies/worldwide
Worldometers, “South Korea GDP (2025),” based on IMF World Economic Outlook (October 2025). https://www.worldometers.info/gdp/south-korea-gdp/
StatisticsTimes, “World GDP 2025,” based on IMF World Economic Outlook. https://statisticstimes.com/economy/world-gdp.php

