

America's Trillion-Dollar Tab: What the National Debt Means for You
The Current State of U.S. National Debt: A Quantitative Snapshot

America has a problem. A nearly $39 trillion problem, to be precise — and it’s growing by about $7.2 billion every single day. If you’ve ever glanced at the news and seen headlines about the U.S. national debt, you might have felt a wave of confusion. The numbers are so mind-bogglingly large that they seem abstract, disconnected from our daily lives. But the truth is, this ever-growing IOU has real-world consequences for everyone from retirees counting on Social Security to young families trying to buy their first home.
Think of it like this: the U.S. government spends money on everything from roads and bridges to Social Security and national defense. When it spends more than it brings in through taxes, it has to borrow money to cover the difference. That borrowing, added up over the years, is the national debt. And right now, the tab is running at a pace that would make even the most reckless credit card user blush.
So, how big is this number, and what does it actually mean? Let’s break it down with data.
The Big Picture: Just How Massive Is the Debt?
As of March 4, 2026, the total gross national debt stands at $38.86 trillion. That’s $113,638 for every single person in the country, or roughly $288,283 per household. The debt-to-GDP ratio — which compares the debt to the total size of the U.S. economy — hovers around 123%, among the highest levels in American history.
To put the speed of accumulation in perspective, the debt has increased by $2.64 trillion in just the past twelve months alone. That works out to $7.23 billion per day, $301 million per hour, or about $83,721 per second. At this pace, the U.S. is expected to blow past $39 trillion by approximately April 2026.
The numbers are not just big — they’re accelerating. It took the United States from its founding in 1776 all the way to 2008 to accumulate its first $10 trillion in debt. The next $10 trillion came in just eight years. And the most recent $10 trillion? That took roughly four years, from late 2021 to late 2025. The exponential curve is unmistakable when you look at the chart below.
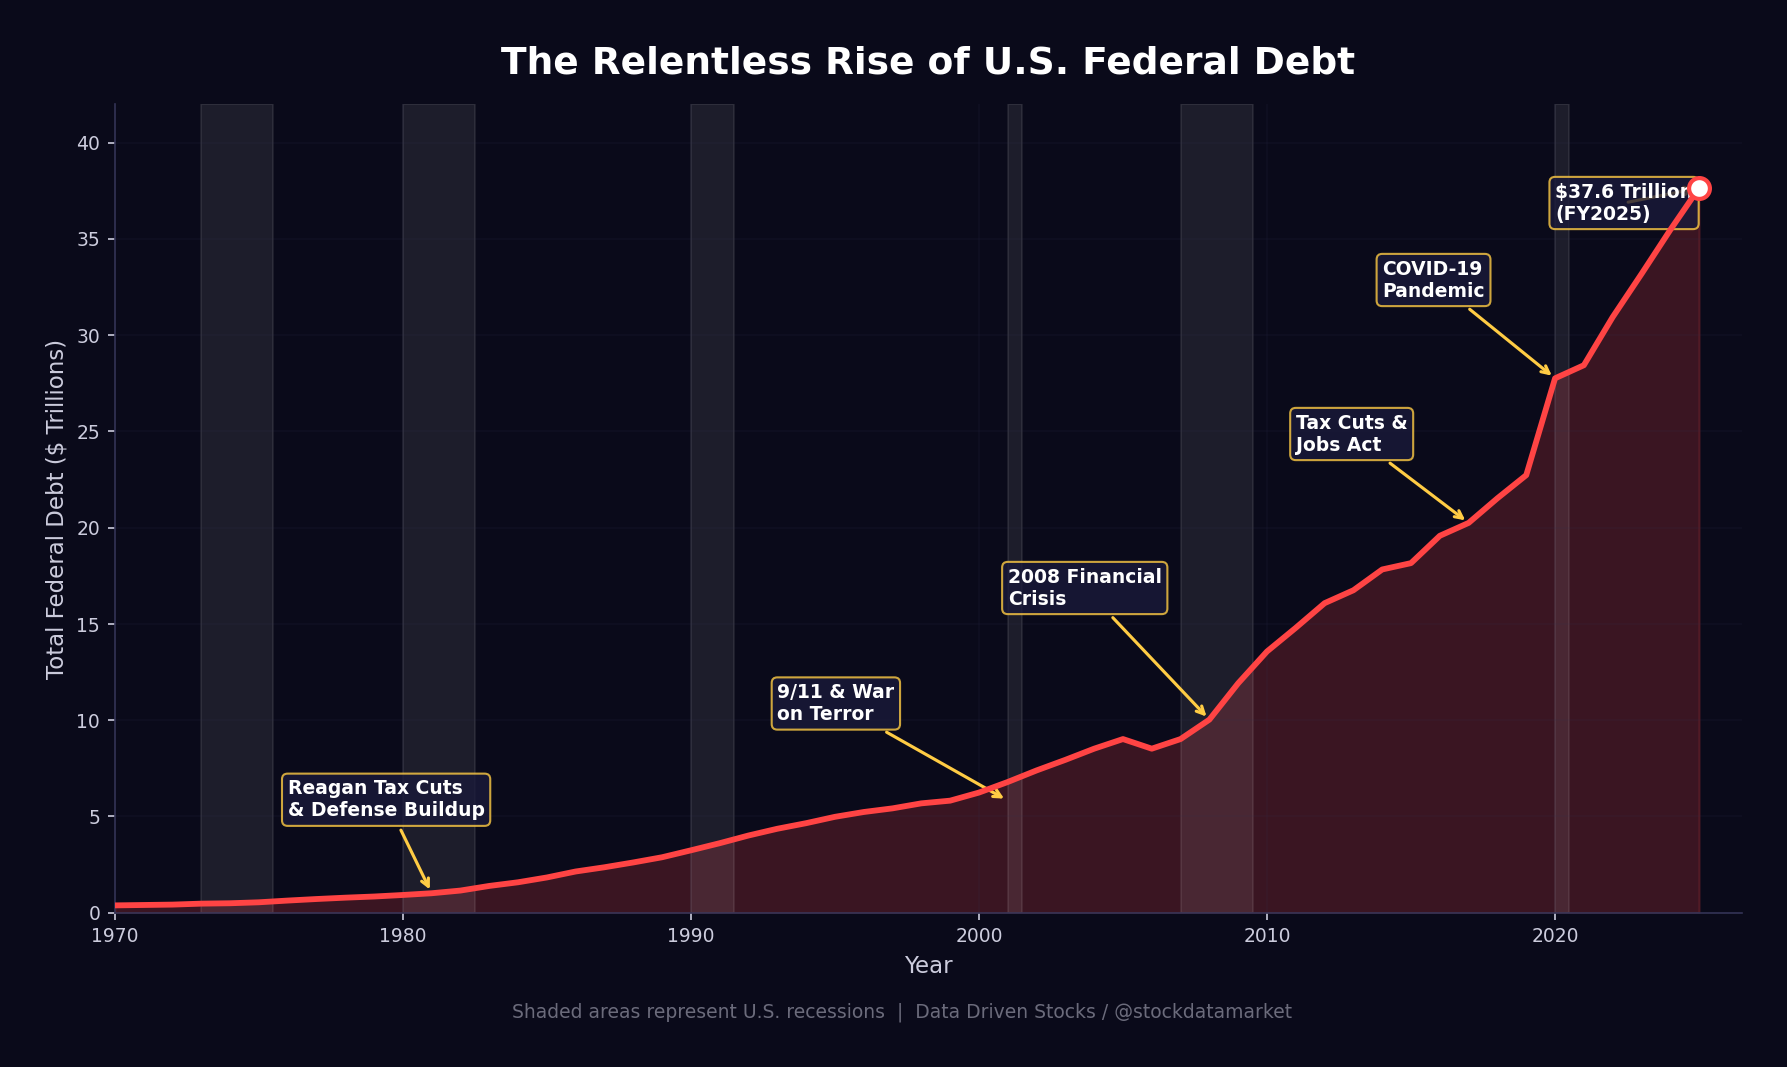
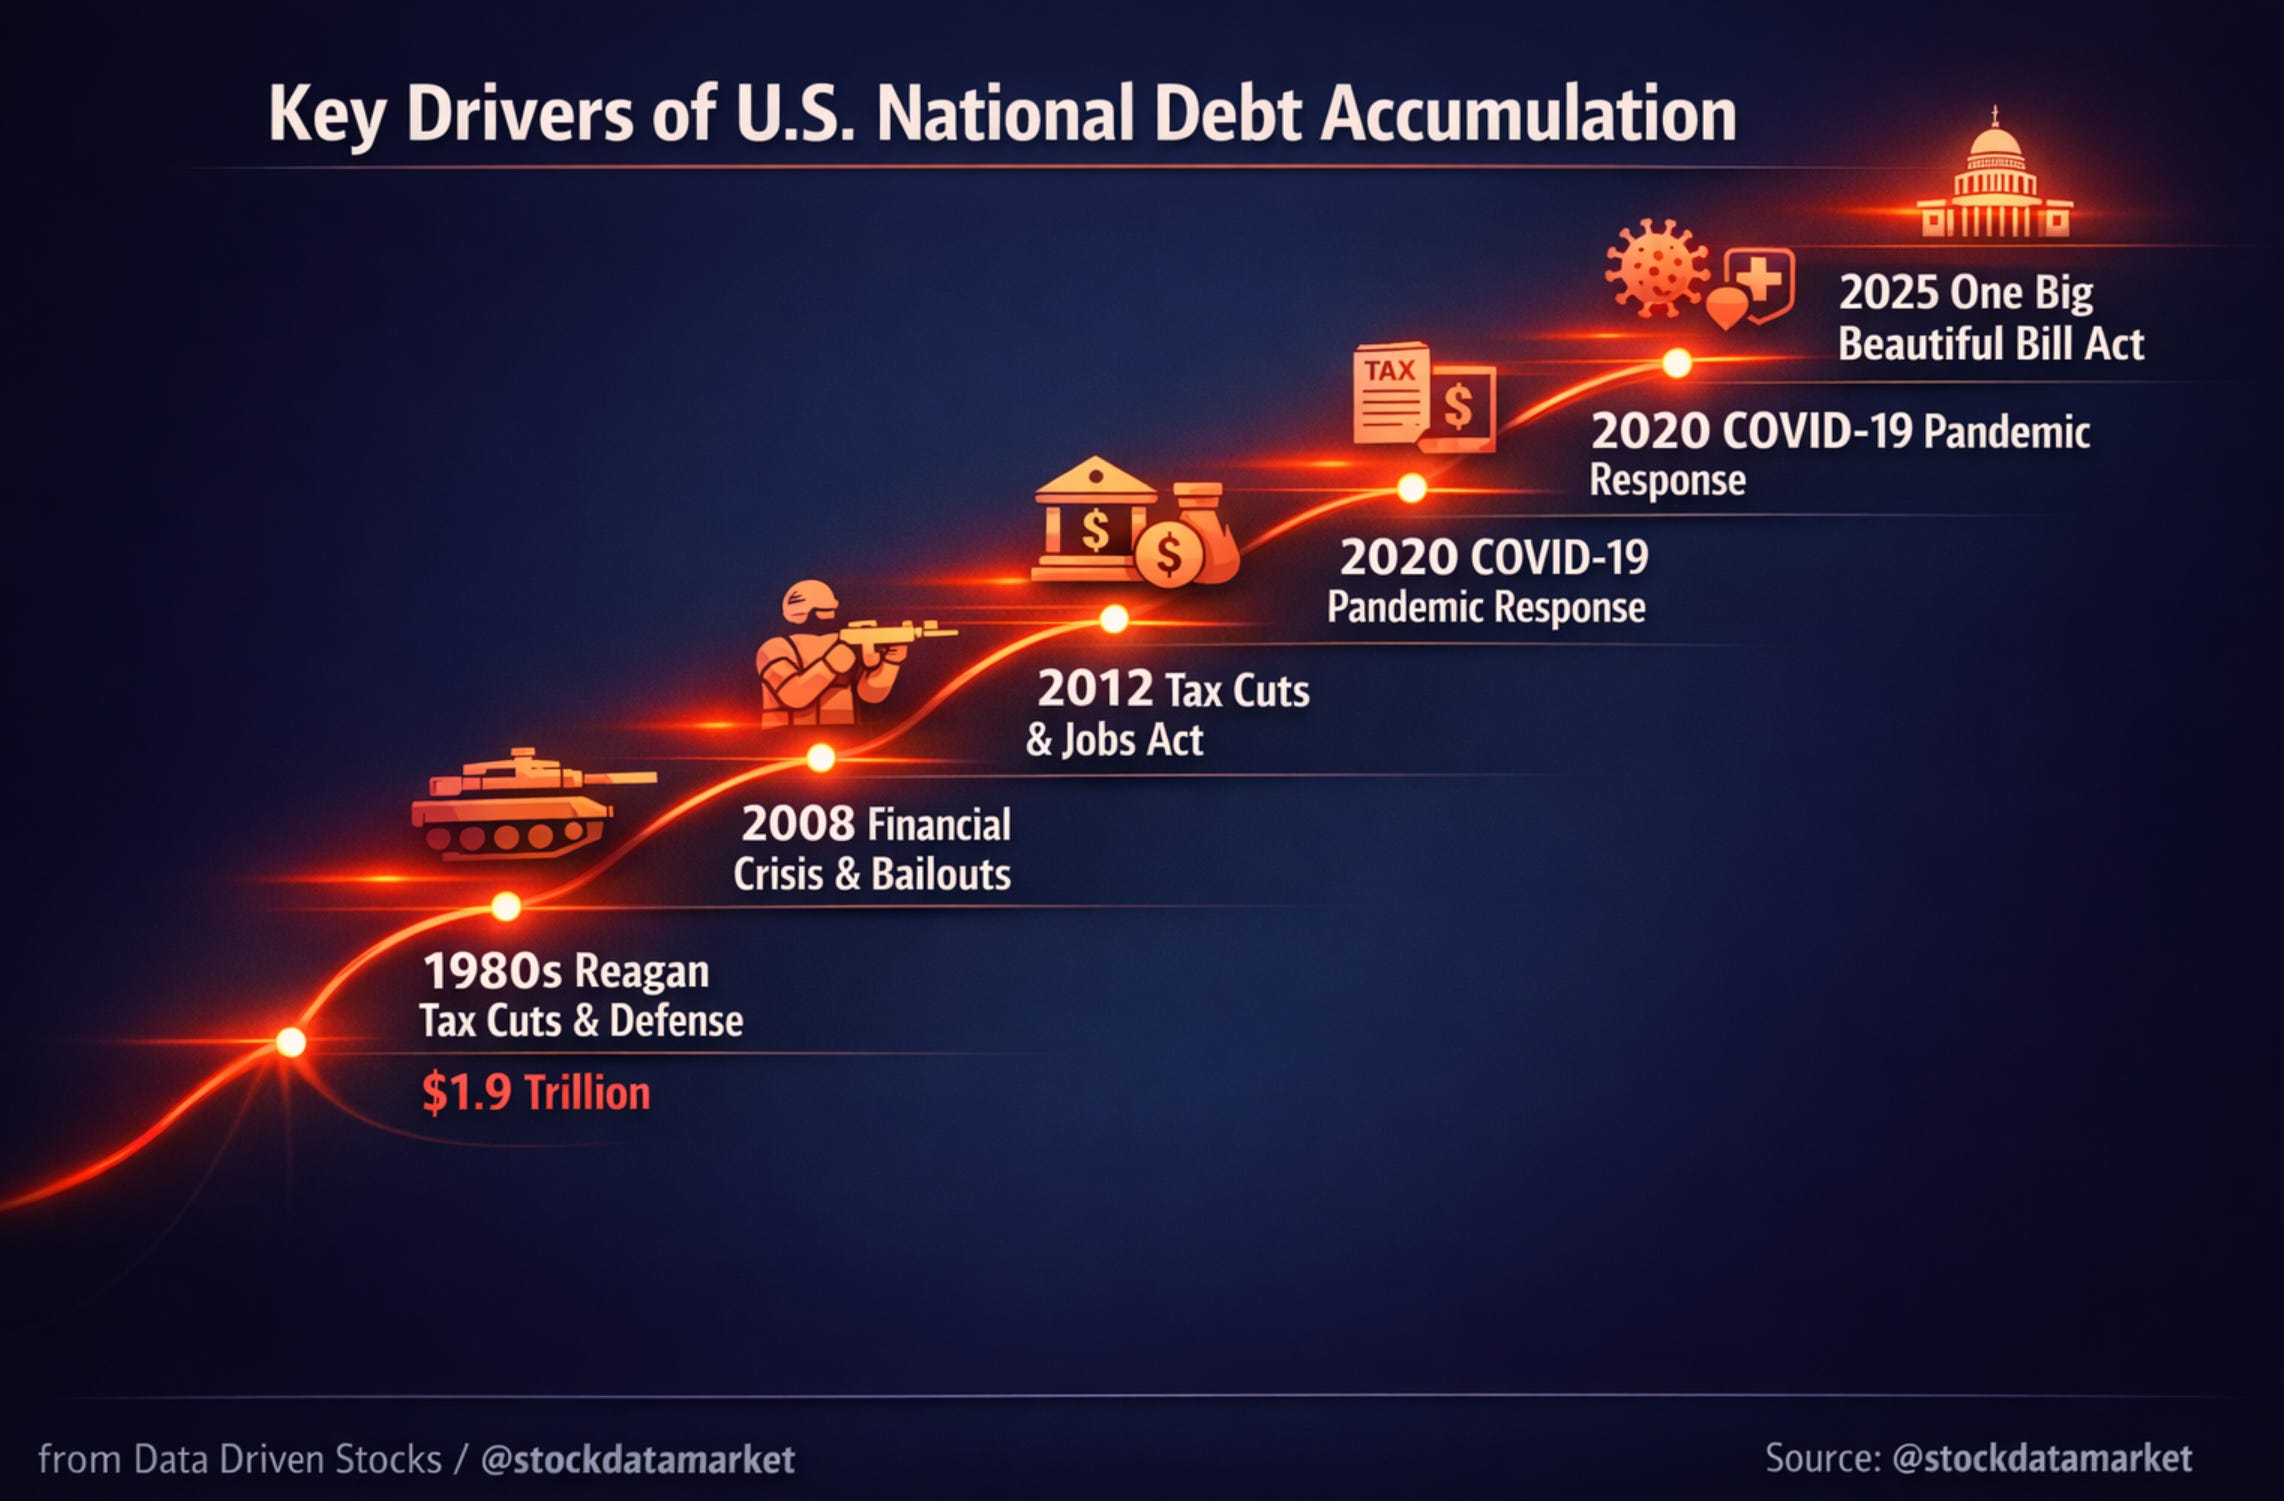
What’s striking about this trajectory is not just the steepness of the line, but the fact that every single major event — wars, recessions, tax cuts, pandemics — pushed the debt permanently higher. After the 2008 financial crisis, there was no period of fiscal consolidation. After COVID, there was no snap-back. The new debt floor simply became the new baseline, and spending continued to outpace revenue.
The $970 Billion Interest Problem
Here’s where things get really uncomfortable. When you have a lot of debt, you have to pay interest on it. The same is true for the U.S. government. And the interest bill has gone from a manageable budget line item to an absolute monster.
In fiscal year 2025, the federal government spent $970 billion on net interest payments alone. Just five years earlier, in 2020, that figure was $345 billion. Interest costs have nearly tripled in half a decade, making them one of the fastest-growing line items in the entire federal budget. Net interest is now the third-largest government expenditure, behind only Social Security and Medicare — and it has surpassed national defense spending ($917 billion in FY2025).
To put the $970 billion interest tab in human terms: it consumed 19 cents of every dollar the government collected in taxes. It equaled roughly $7,300 per American household. That’s more than the average household spends annually on health care, gasoline, clothing, or education. And here’s the kicker — that money doesn’t build a single road, fund a single school, or defend a single border. It simply services past borrowing.
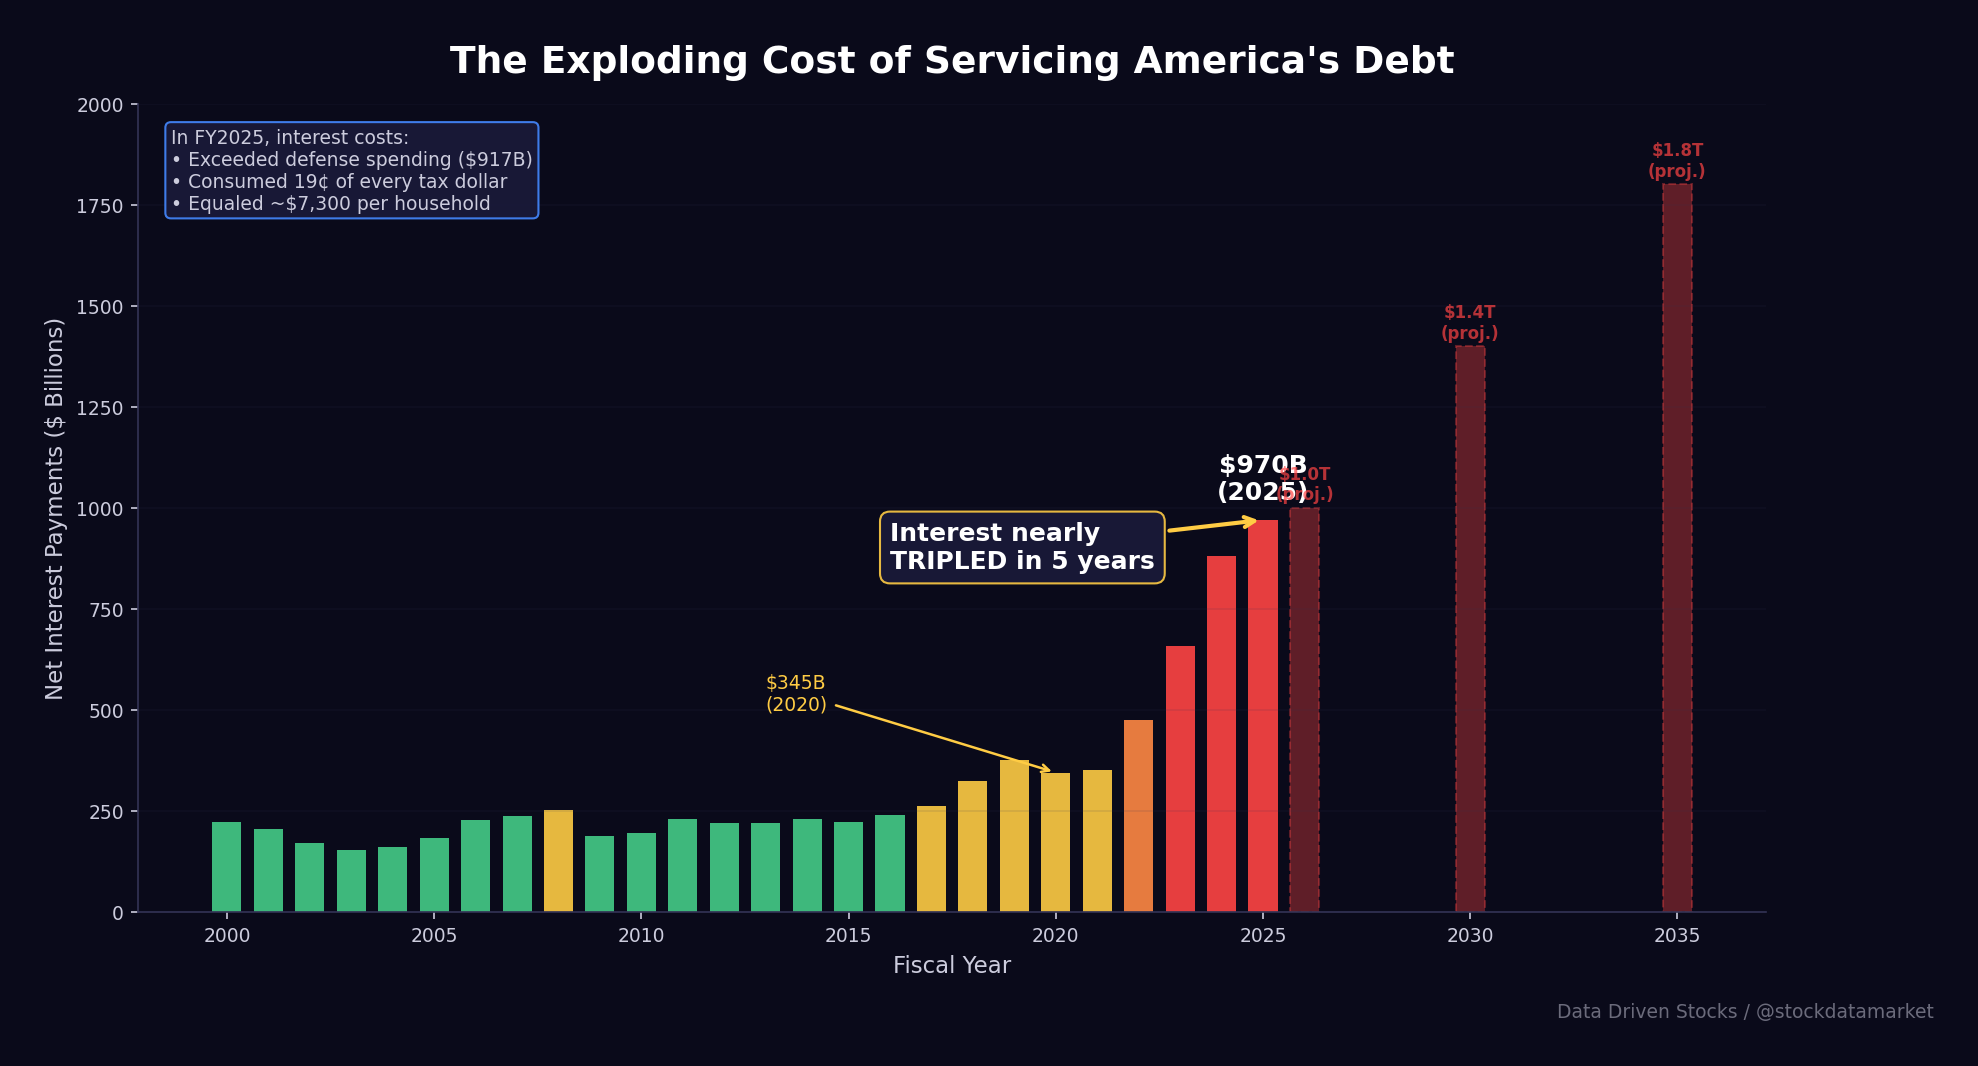
The projections going forward are even grimmer. The Congressional Budget Office estimates interest payments will cross the $1 trillion mark in FY2026 and continue climbing to approximately $1.8 trillion by 2035. Under a more adverse scenario — where tariffs are struck down by courts, temporary tax provisions become permanent, and Treasury yields remain elevated — interest costs could reach $2.2 trillion by decade’s end. That would mean the government spends more servicing its past debts than it does on most programs that actually serve the public.
The compounding dynamic is what makes this so dangerous. Higher debt leads to higher interest payments, which leads to larger deficits, which leads to even more debt. It’s a fiscal doom loop, and breaking out of it requires either dramatically cutting spending, dramatically raising revenue, or some combination of both — none of which appear likely in the current political environment.
Uncle Sam’s Credit Card Bill: The Deficit Story
To understand how the debt got this large, you have to follow the annual deficit — the gap between what the government spends and what it brings in. The deficit is the accelerator pedal; the debt is the odometer reading.
The United States has run a budget deficit in 23 of the last 25 fiscal years. The only exceptions were the brief Clinton-era surpluses from 1998 to 2001, when a booming tech economy and bipartisan fiscal restraint briefly put the government in the black. Since then, it’s been nothing but red ink.
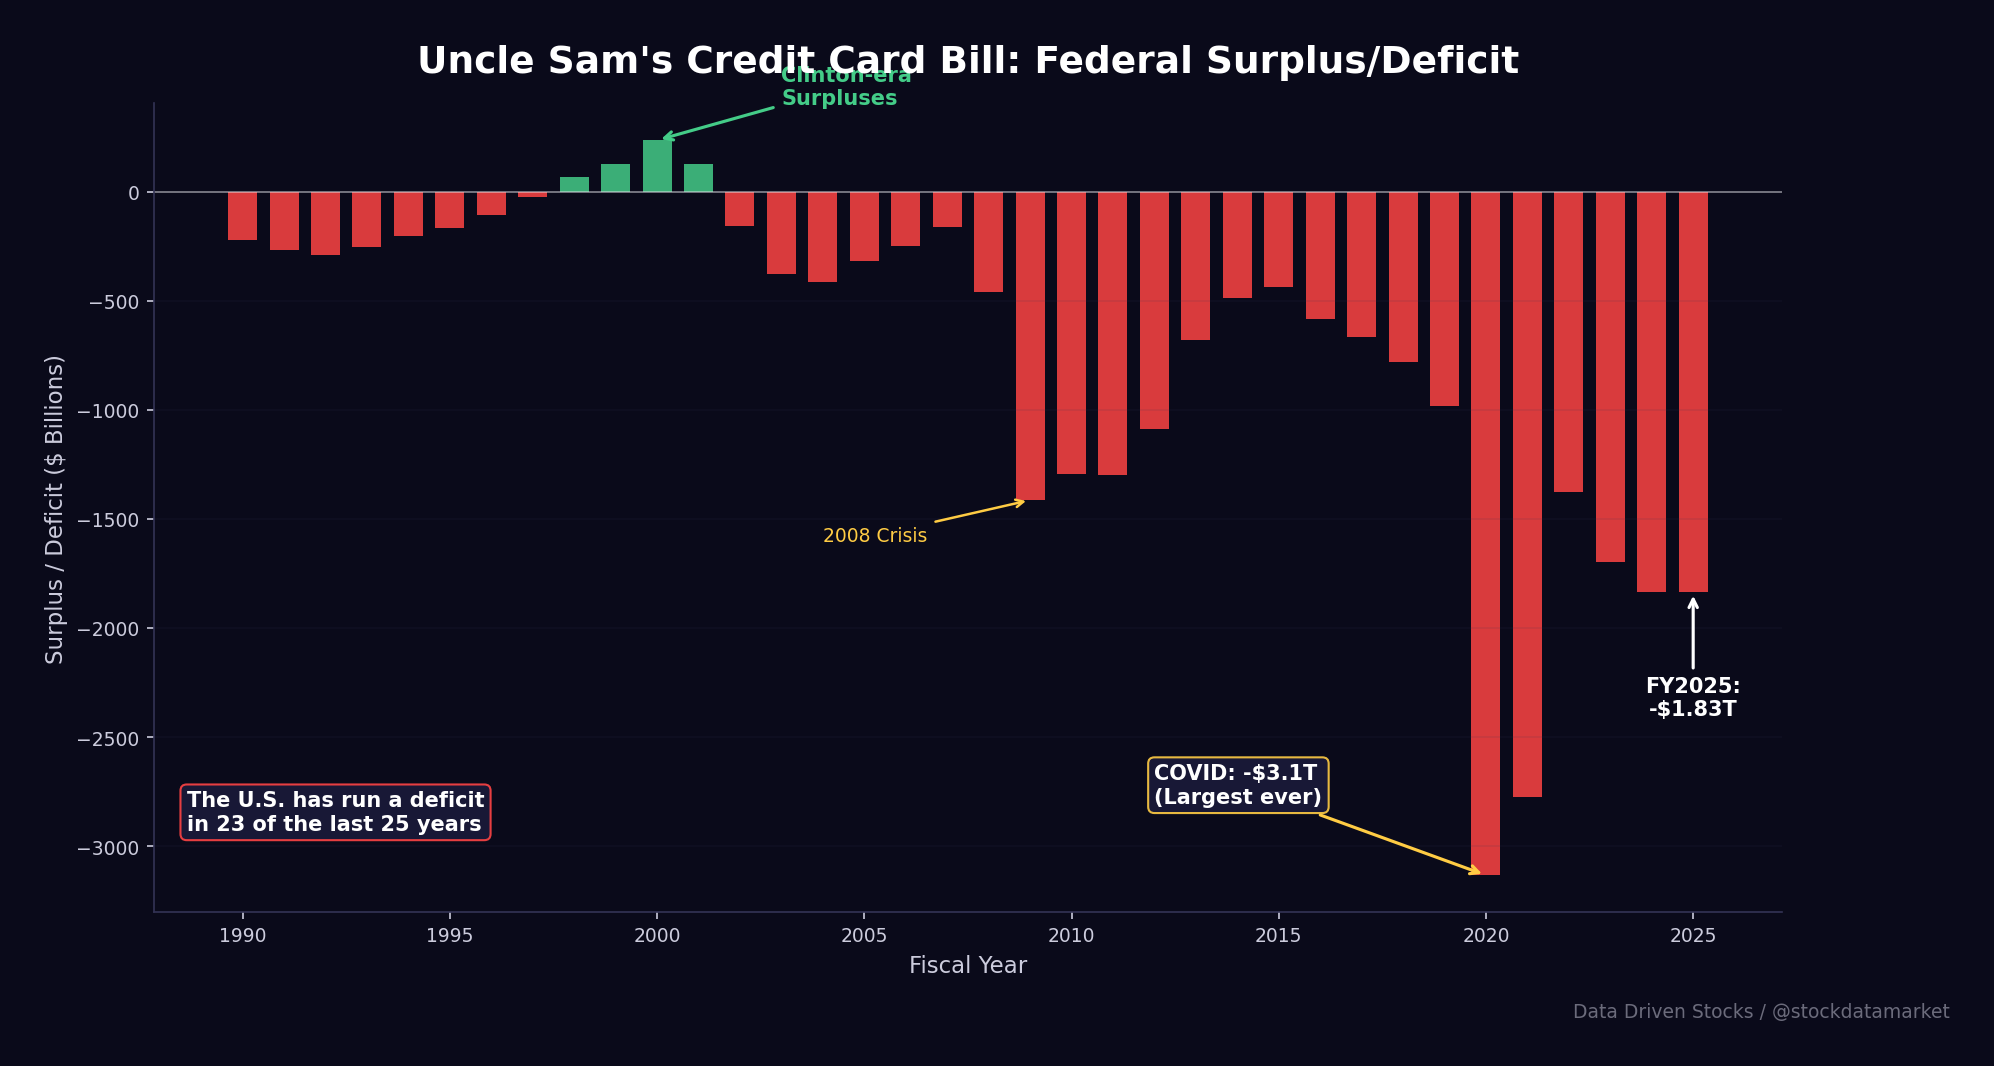
The 2008 financial crisis pushed deficits above $1 trillion for four consecutive years as the government bailed out banks, stimulated the economy, and dealt with collapsing tax revenues. There was a gradual recovery through the mid-2010s, with deficits shrinking to about $438 billion by 2015. But the 2017 Tax Cuts and Jobs Act reversed that trend, pushing deficits back above $700-900 billion even during what was supposed to be a strong economy.
Then came COVID. The FY2020 deficit hit a staggering $3.1 trillion — the largest in American history by a wide margin — as the government unleashed trillions in stimulus, PPP loans, enhanced unemployment, and direct payments. FY2021 added another $2.8 trillion. Even after the emergency spending faded, deficits have remained stubbornly above $1.8 trillion, driven by a structural gap between spending and revenue that existed long before the pandemic.
The FY2025 deficit came in at approximately $1.83 trillion, or about 5.9% of GDP. The CBO projects annual deficits will exceed $2 trillion every year for the next decade. That’s not crisis spending — that’s the baseline.
Anatomy of the Debt: Who Do We Owe?
The national debt isn’t like a single credit card bill. It’s split into two main categories, and understanding who holds it is crucial for assessing the risks involved.
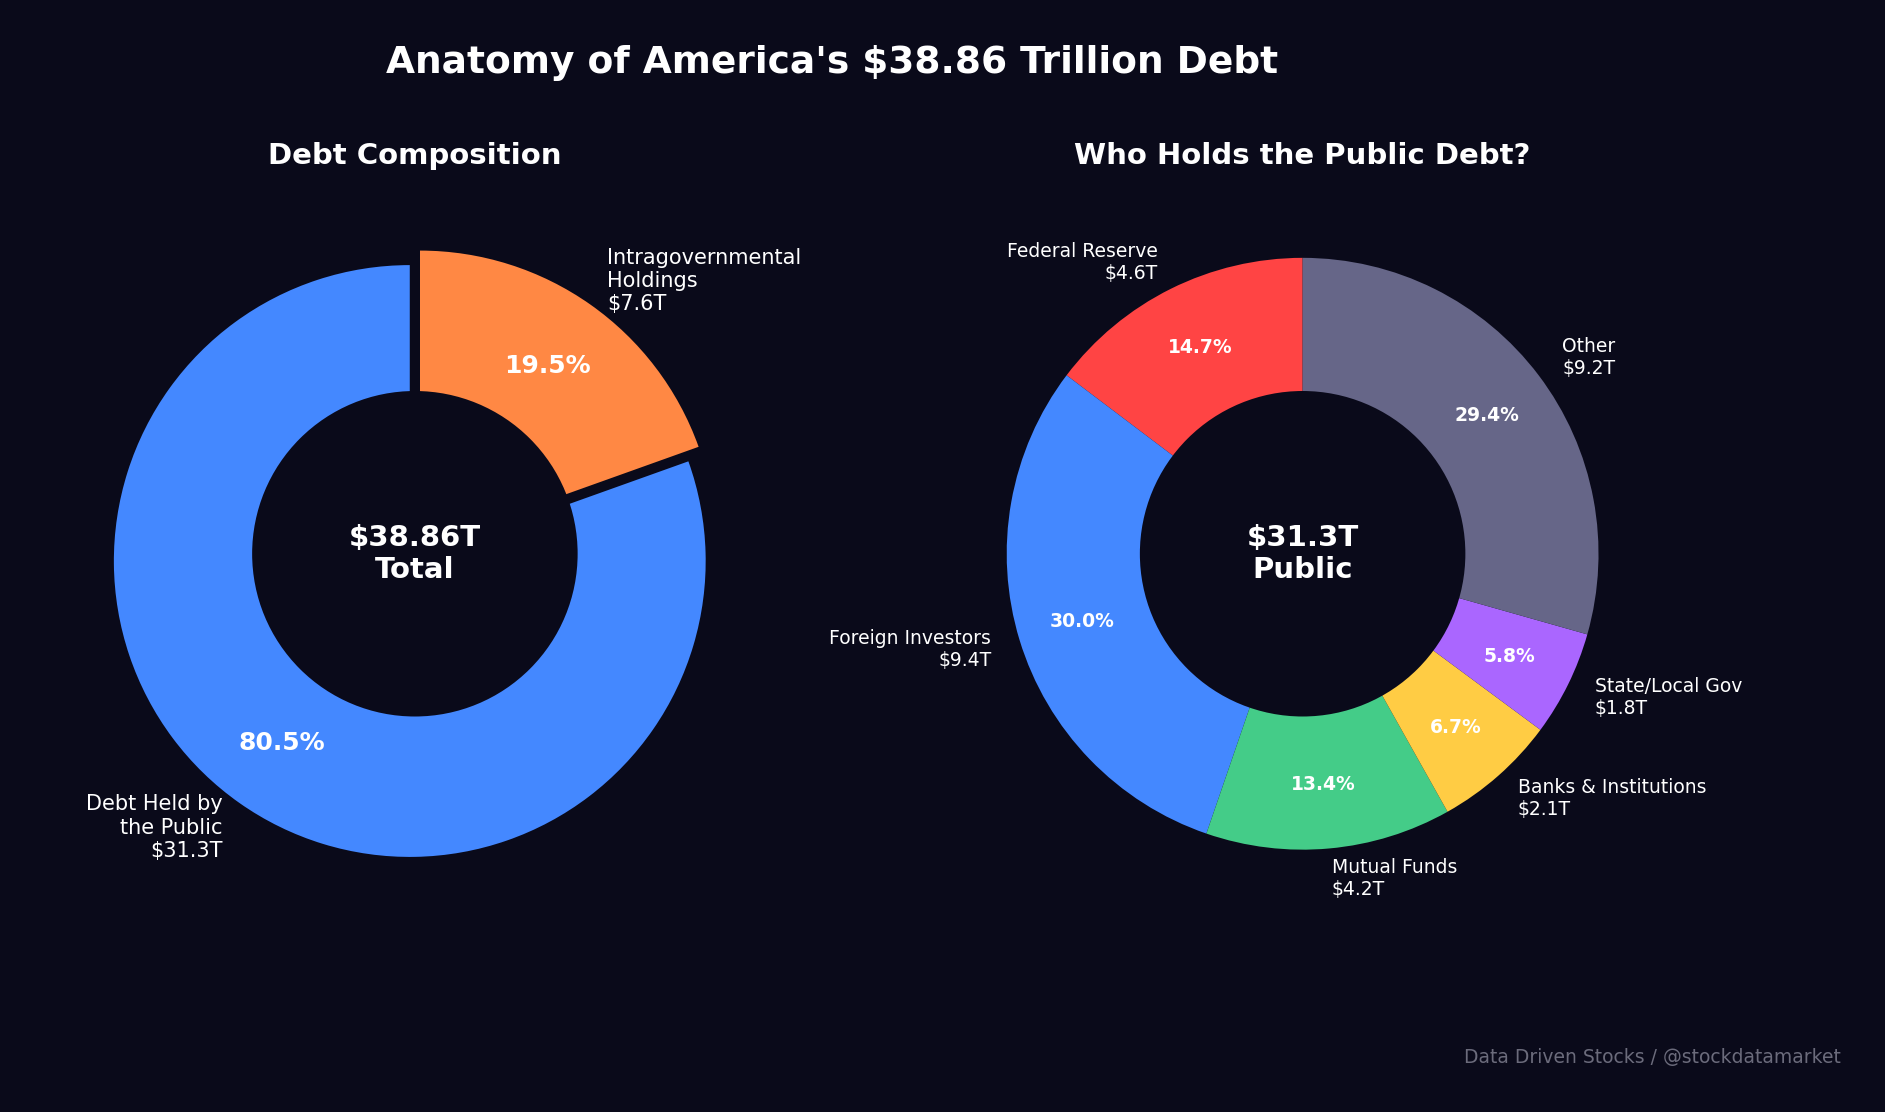
The larger portion — about $31.3 trillion — is “debt held by the public.” These are Treasury securities owned by everyone from individual savers to the Federal Reserve to foreign governments. The remaining $7.6 trillion is intragovernmental debt — money the government essentially owes to its own trust funds, primarily Social Security and Medicare.
Among public debt holders, foreign investors are the biggest category at $9.4 trillion, a record high. The Federal Reserve holds about $4.6 trillion (down from its pandemic peak as quantitative tightening continues). Mutual funds, pension funds, banks, insurance companies, and state and local governments round out the rest.
A Closer Look at the Lenders: Who Owns America’s IOUs?
So who exactly are these foreign countries lending money to Uncle Sam? It’s a mix that reveals fascinating geopolitical dynamics.
Japan remains the largest foreign holder at $1.186 trillion, having increased its position by over $100 billion in the past year. The United Kingdom surged into second place with $866 billion, up nearly $100 billion year-over-year. Much of the UK’s growth reflects London’s role as a global financial hub where institutions from around the world park their Treasury holdings.
China, meanwhile, continues its multi-year drawdown. Its holdings fell to $683.5 billion, a decline of about $86 billion from the prior year. Beijing has been steadily reducing its U.S. debt exposure since peaking above $1.3 trillion in 2013, diversifying into gold and other reserve assets — a trend that many interpret as part of a broader de-dollarization strategy.
Belgium ($477B) and Canada ($468B) round out the top five, though Belgium’s large holdings are somewhat misleading — Brussels hosts Euroclear, a major bond clearinghouse, so the figure reflects custodial holdings on behalf of investors worldwide rather than Belgian government purchases.
The fact that total foreign holdings hit a record $9.4 trillion despite China’s selling tells you something important: demand for U.S. Treasuries remains robust globally, driven by relatively high yields (the 10-year sits around 4.3%), the dollar’s reserve currency status, and the sheer depth and liquidity of the Treasury market. For now, the world is still willing to lend to America — but the price keeps going up.
How Did We Get Here? A Timeline of Debt
The national debt didn’t balloon overnight. It’s the product of decades of decisions and several massive economic shocks. Here’s the shorthand version of the story.
In the early 1980s, the Reagan administration slashed income taxes while dramatically increasing defense spending during the Cold War’s final act. The national debt tripled during the Reagan-Bush years, from about $900 billion in 1980 to $4 trillion by 1992. The 1990s brought a rare period of fiscal improvement — a combination of Clinton-era tax increases, the tech boom generating surging revenue, and bipartisan spending restraint under the Balanced Budget Act of 1997 produced four consecutive years of surpluses.
Then came 9/11 and the wars in Afghanistan and Iraq, which were financed almost entirely through borrowing. The 2001 and 2003 Bush tax cuts further eroded the revenue base. By the time the 2008 financial crisis hit, the government was already running deficits again — and the crisis turned them into chasms. TARP, the auto bailouts, the Recovery Act, and falling tax revenue added trillions.
The 2017 Tax Cuts and Jobs Act reduced corporate and individual tax rates, adding an estimated $1.9 trillion to deficits over a decade according to CBO scoring. And then COVID-19 arrived, triggering the largest single-year fiscal expansion in American history. Between the CARES Act, the Consolidated Appropriations Act, and the American Rescue Plan, Congress authorized roughly $5 trillion in emergency spending.
Most recently, the One Big Beautiful Bill Act signed in July 2025 added an estimated $4.1 trillion in new ten-year debt through a combination of extended tax cuts, defense spending, and immigration provisions. The offsets in the bill totaled roughly $2.5 trillion, leaving a net $1.5 trillion addition — the largest single-year policy-driven debt increase since 2022.
How Do We Stack Up? The International Context
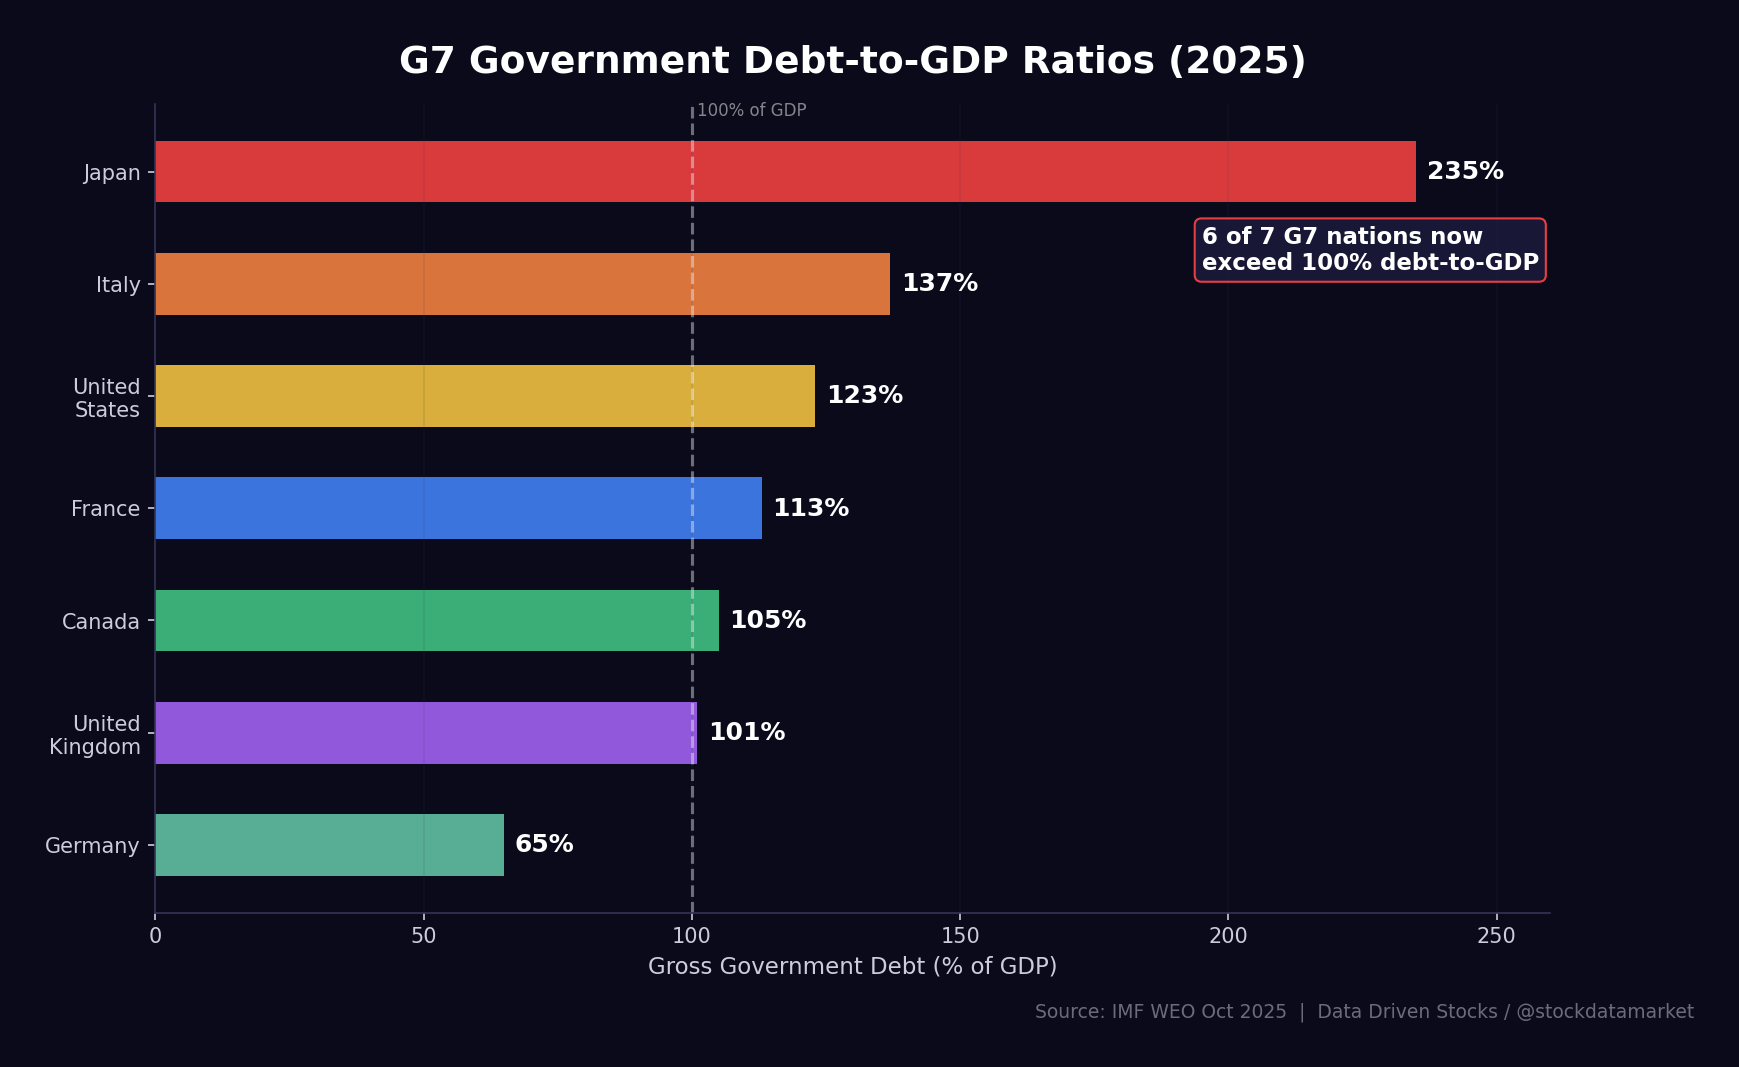
It’s tempting to look at these numbers and assume the U.S. is the world’s most indebted nation. The reality is more nuanced. According to IMF data from October 2025, the U.S. ranks third among G7 nations in gross government debt-to-GDP at 123%, behind Japan (235%) and Italy (137%).
What makes the U.S. unique isn’t just the ratio — it’s the scale. At $38.86 trillion, the U.S. has by far the largest absolute debt pile of any country on Earth. It also has the deepest and most liquid government bond market, which means any disruption to confidence in Treasuries would reverberate through every corner of global finance.
Japan’s much higher ratio (235%) is often cited as evidence that a country can carry enormous debt without crisis. But Japan’s situation is fundamentally different: roughly 90% of Japanese government debt is held domestically, primarily by Japanese banks, insurance companies, and the Bank of Japan. This insulates Japan from the kind of sudden foreign selling that could destabilize its bond market. The U.S., by contrast, relies on foreign investors for about 30% of its publicly held debt — making it more vulnerable to shifts in global investor sentiment.
Germany stands out as the lone G7 fiscal hawk at just 65% of GDP, though recent increases in defense and infrastructure spending are pushing that ratio higher. Six of the seven G7 nations now exceed the 100% debt-to-GDP threshold, a situation that would have been unthinkable just two decades ago.
Where Are We Headed? The Long-Term Outlook
If current policies remain roughly unchanged, the trajectory is clear — and it’s not pretty.
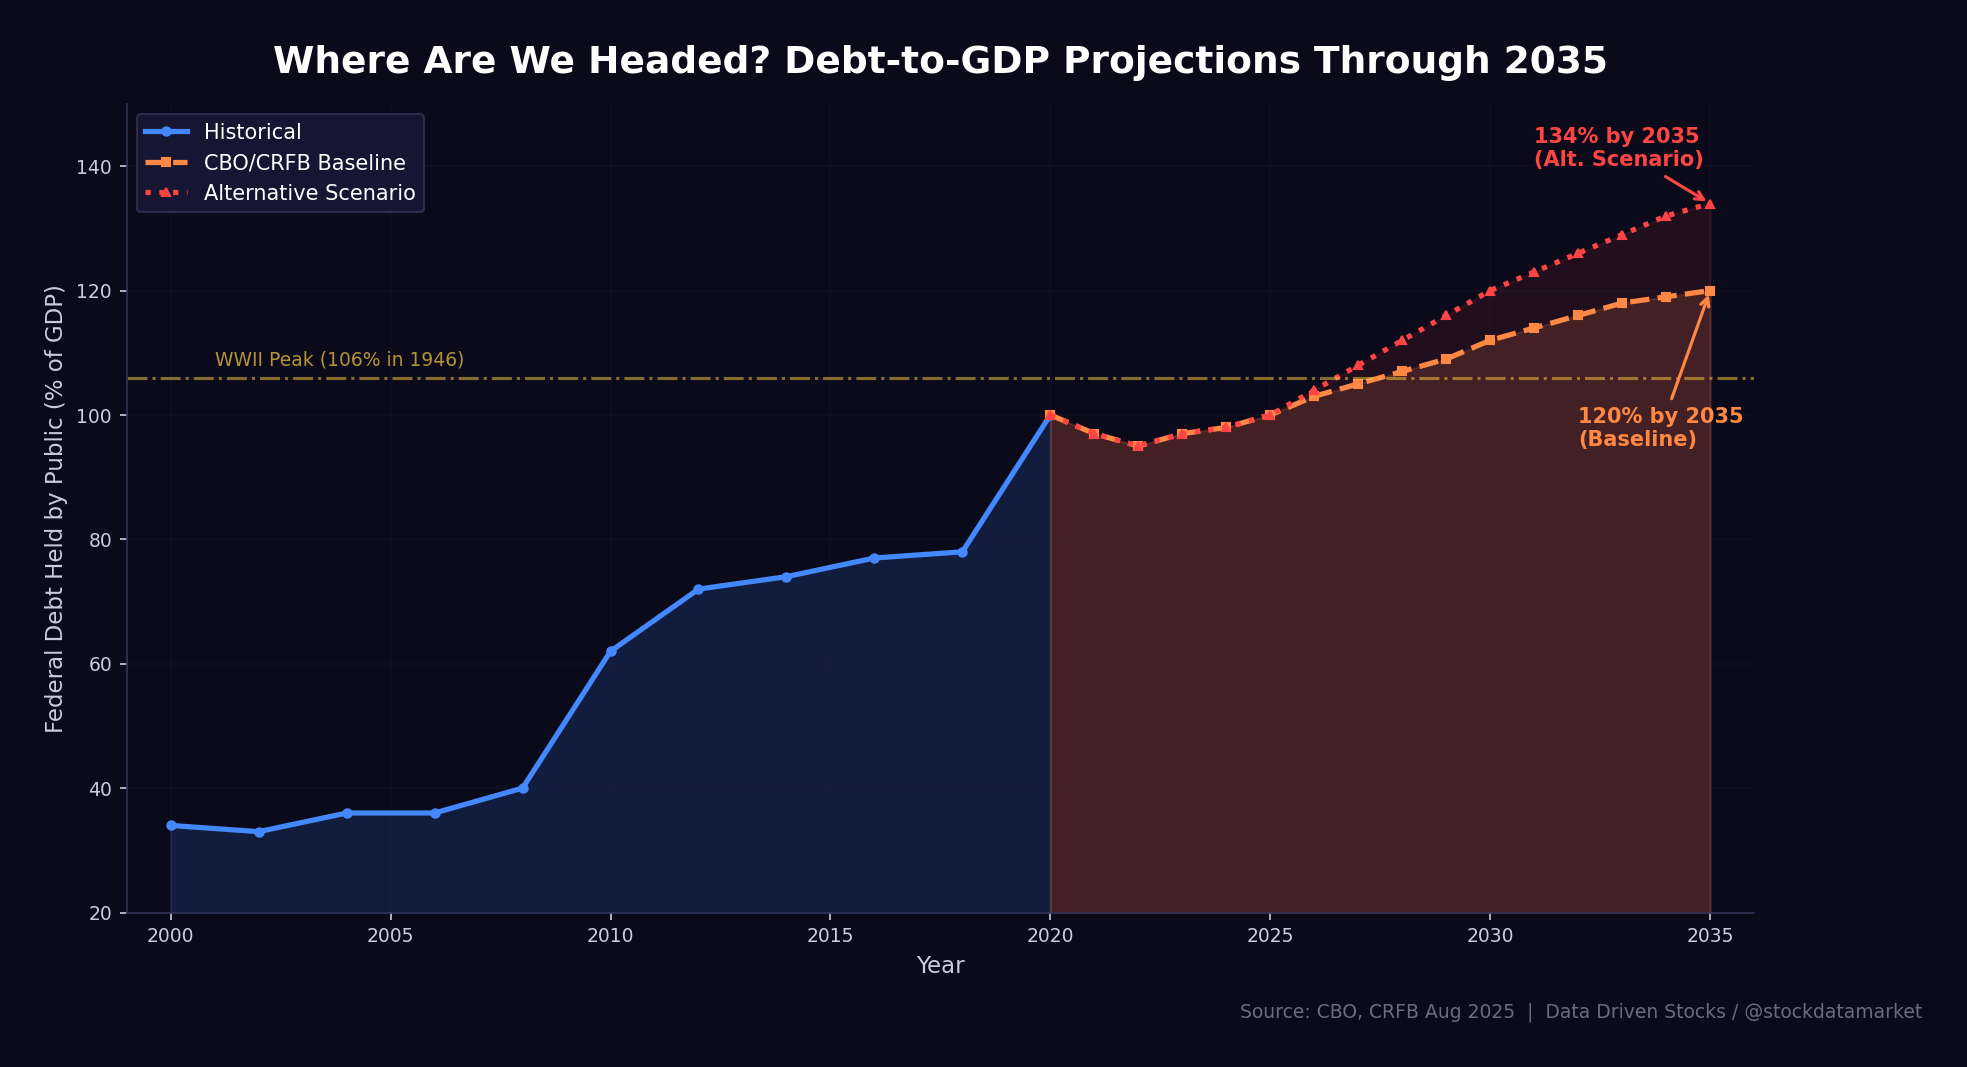
Under the CBO/CRFB adjusted baseline, debt held by the public is projected to climb from about 100% of GDP today to 120% by 2035. That already surpasses the post-World War II peak of 106% set in 1946 — a level that was achieved fighting a two-front global war and was rapidly reduced in subsequent decades through economic growth and fiscal discipline.
Under an alternative scenario — where the Supreme Court strikes down many of the current tariffs, temporary provisions from the One Big Beautiful Bill Act are made permanent, and Treasury yields remain near current levels — debt could reach 134% of GDP by 2035. Annual deficits under this scenario would approach $2.6 trillion, with interest payments alone consuming over 5% of GDP.
The three main drivers of this trajectory are well known: Social Security costs rising as baby boomers retire, healthcare spending increasing as the population ages and per-capita costs climb, and net interest compounding on an ever-larger debt stock. Together, these three categories are projected to account for virtually all of the growth in federal spending over the next three decades.
What Does This All Mean for You?
The national debt might seem like a distant abstraction — something that politicians argue about but that doesn’t really affect your daily life. That perception is wrong, and here’s why.
Higher government borrowing crowds out private investment. When the Treasury is absorbing vast amounts of capital to finance deficits, there’s less available for businesses to borrow and invest. This puts upward pressure on interest rates for everything from mortgages to car loans to small business credit lines. If you’ve wondered why mortgage rates have stayed stubbornly above 6-7% even as the Fed has moderated its stance, the government’s voracious borrowing needs are a big part of the story.
The interest bill also means less money for everything else. Every dollar spent on interest is a dollar that can’t go toward infrastructure, education, scientific research, veterans’ benefits, or any other national priority. As interest costs grow from $970 billion today toward $1.8 trillion by 2035, the squeeze on discretionary spending will intensify. Programs that invest in the future — R&D, education, infrastructure — will face increasing competition from the dead weight of servicing past borrowing.
Then there’s the Social Security question. The retirement trust fund is projected to reach insolvency by 2032, at which point benefits would face an automatic 24% across-the-board cut unless Congress acts. For a typical retiring couple, that would mean about $18,400 less per year in benefits. The high debt environment makes fixing Social Security harder, because any solution — whether raising taxes or redirecting spending — runs headlong into an already stressed fiscal position.
Finally, there’s the tail risk that few like to discuss but everyone should think about: what happens if global investors lose confidence in U.S. fiscal management? The dollar’s reserve currency status and the depth of the Treasury market have so far insulated the U.S. from the kind of bond market crisis that has hit smaller economies. But that insulation is not permanent. If foreign holders begin to meaningfully reduce their exposure — as China has been doing — and domestic demand can’t fully compensate, yields could spike, interest costs could spiral, and the fiscal doom loop could accelerate dramatically.
None of this is inevitable. The U.S. has come back from high debt before — after World War II, the debt-to-GDP ratio was reduced from 106% to about 30% over three decades through a combination of strong economic growth, moderate inflation, and restrained fiscal policy. But doing it again requires political will that, at least for now, appears to be in short supply.
Understanding the national debt is the first step toward having a meaningful conversation about our country’s financial future. It’s a complex issue with no easy solutions, but it’s one that affects us all — and the clock is ticking louder every day.
Data’s Substack is a reader-supported publication. To receive new posts and support my work, consider becoming a free or paid subscriber.
Sources
U.S. Congress Joint Economic Committee, Monthly Debt Update and Debt Dashboard (March 2026)
U.S. Government Accountability Office, “Financial Audit: Bureau of the Fiscal Service’s FY 2025 and FY 2024 Schedules of Federal Debt” (January 2026)
Congressional Budget Office (CBO), Budget and Economic Outlook (January 2025, updated projections)
Committee for a Responsible Federal Budget (CRFB), “An August 2025 Budget Baseline” and “Top 13 Fiscal Charts of 2025”
American Action Forum, “Sizing Up Interest Payments on the National Debt” (November 2025)
Center on Budget and Policy Priorities, “Deficits, Debt, and Interest” (December 2025)
Peter G. Peterson Foundation, “The Current Federal Deficit and Debt” (February 2026)
U.S. Treasury Department, TIC Data — Major Foreign Holders of Treasury Securities (December 2025)
U.S. Treasury Fiscal Data, “Understanding the National Debt” and “Interest Expense and Average Interest Rates”
International Monetary Fund, World Economic Outlook (October 2025)
RSM US, “The rise of debt in the G7 economies” (2025)
Congress.gov/CRS, “Federal Debt and the Debt Limit in 2025” and “Foreign Holdings of Federal Debt”