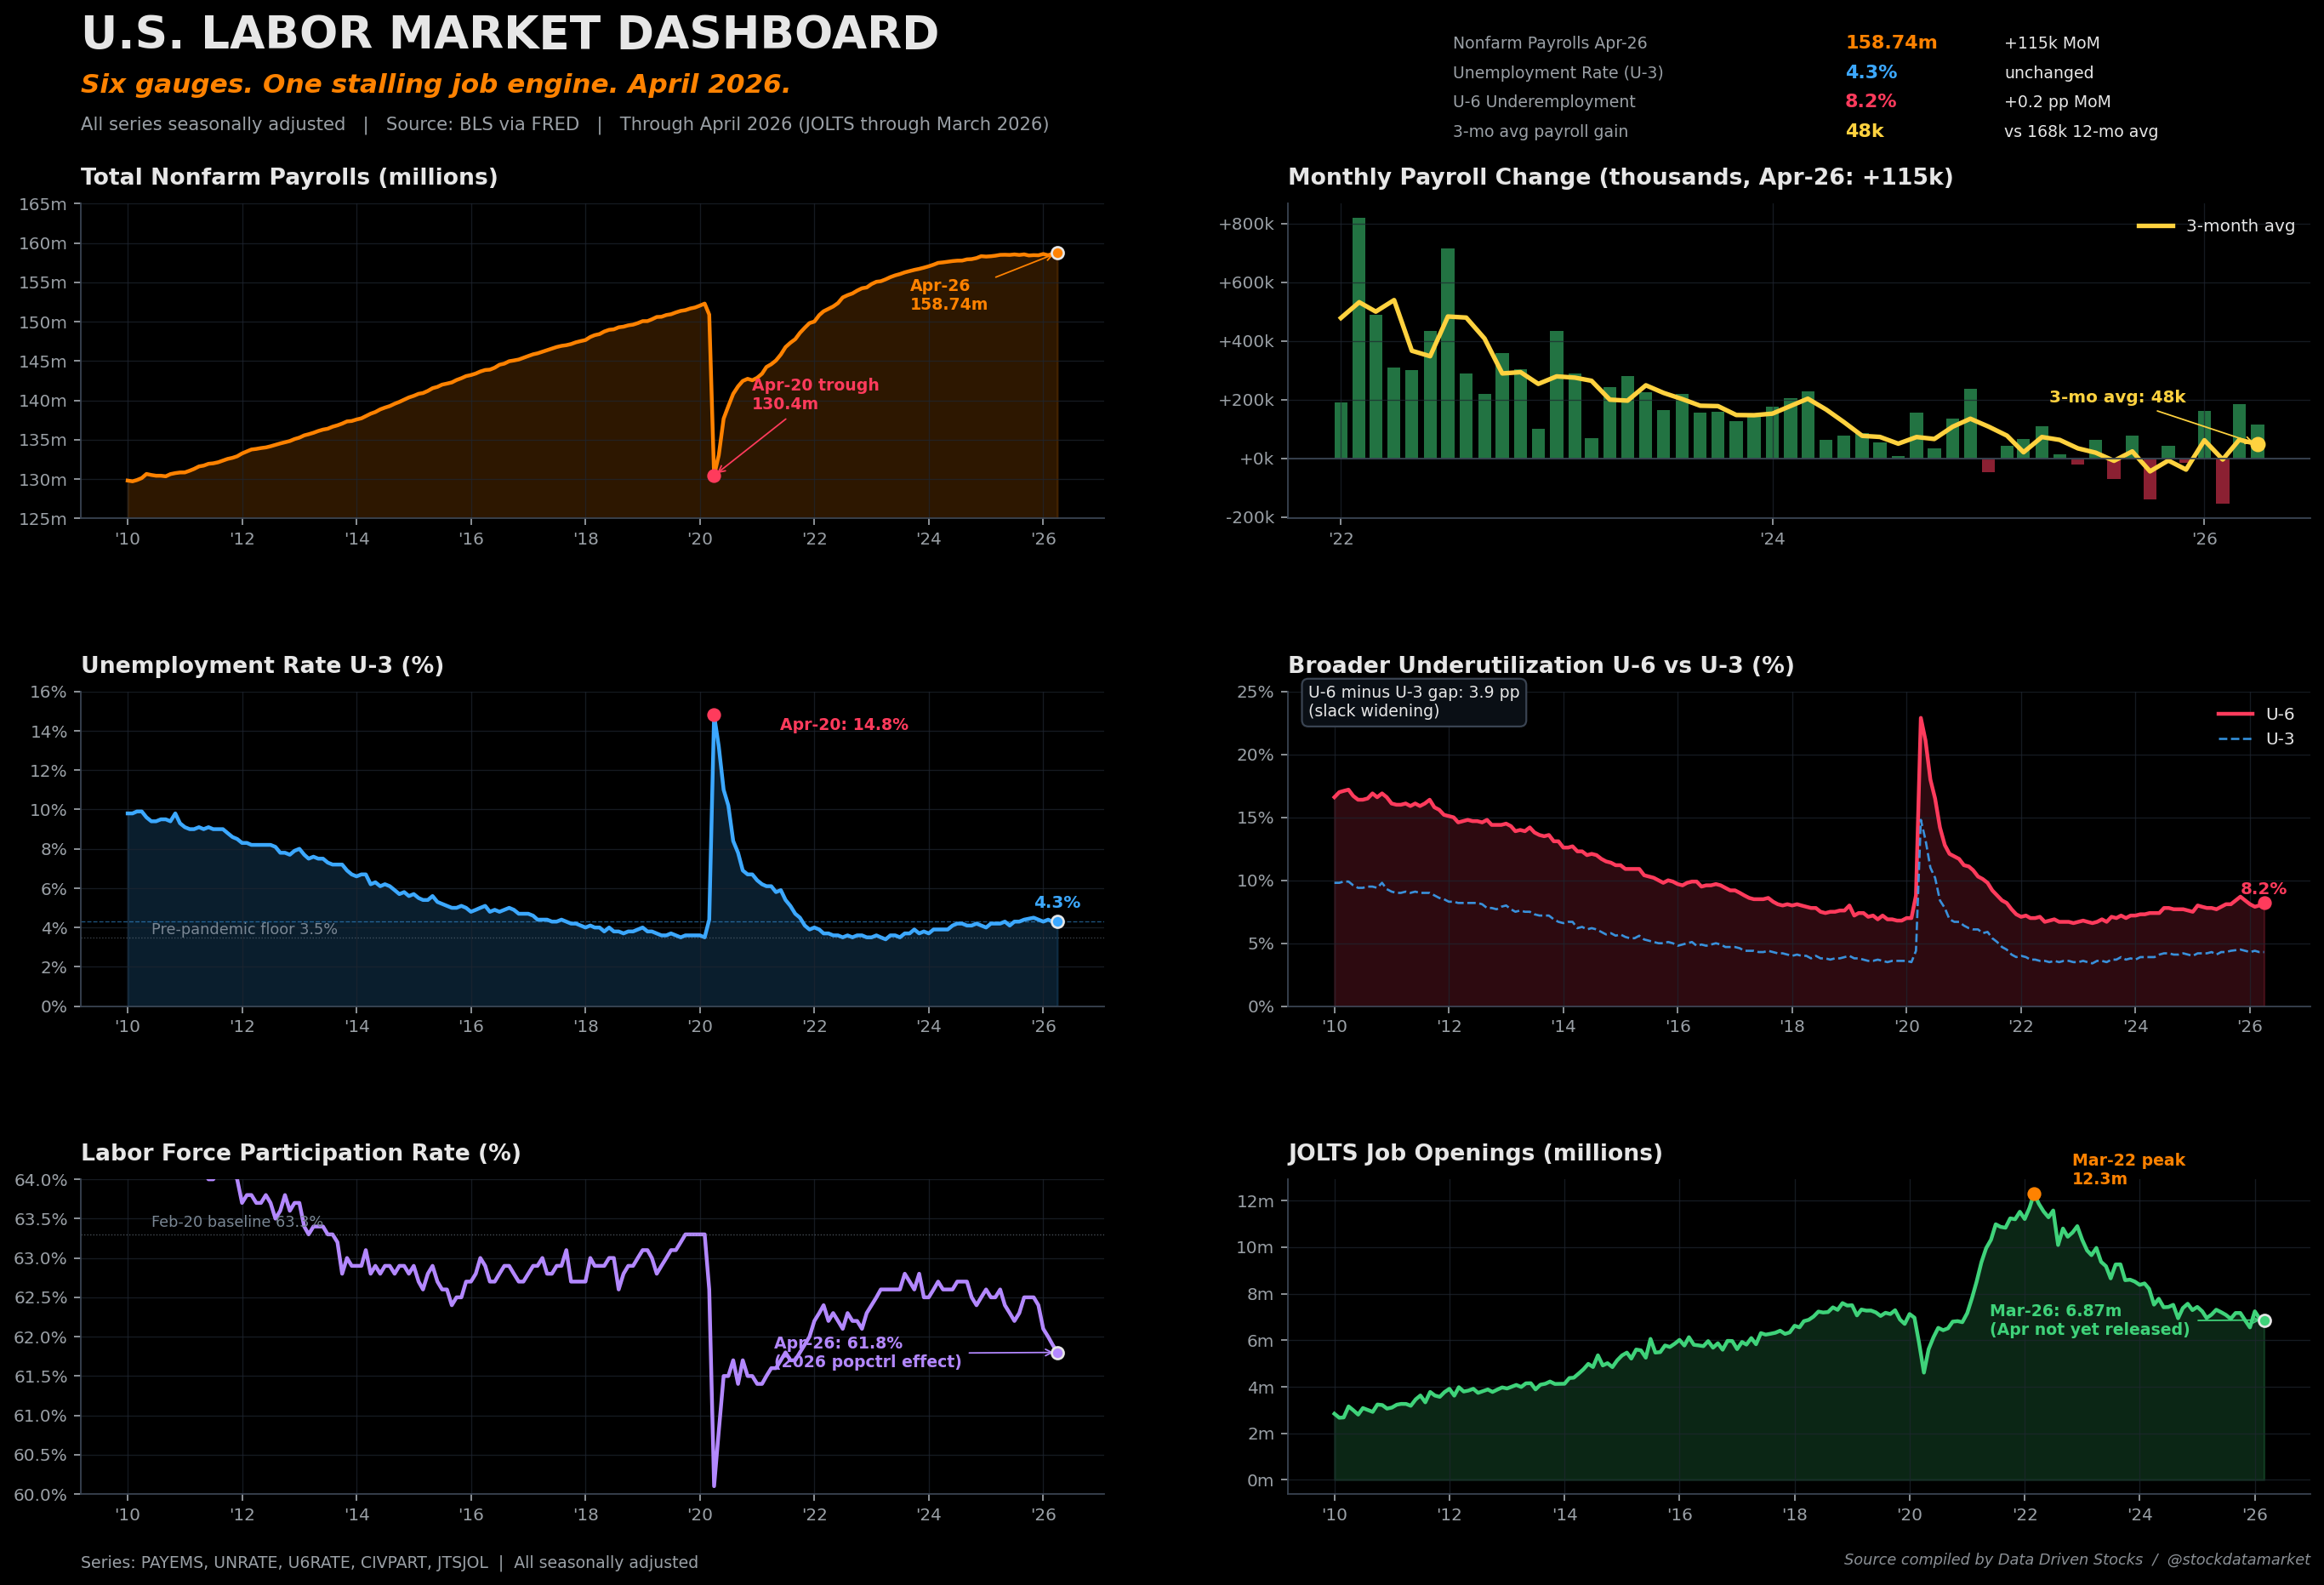
America’s Job Engine Is Quietly Stalling: Inside the April 2026 Payroll Report Wall Street Is Sleepwalking Past
America’s Job Engine Is Quietly Stalling: Inside the April 2026 Payroll Report Wall Street Is Sleepwalking Past. So the job reports are as always rigged