

America Lost 23,000 Jobs And The Unemployment Rate Went Down - yet there is less people employed. Here Is Who Vanished.
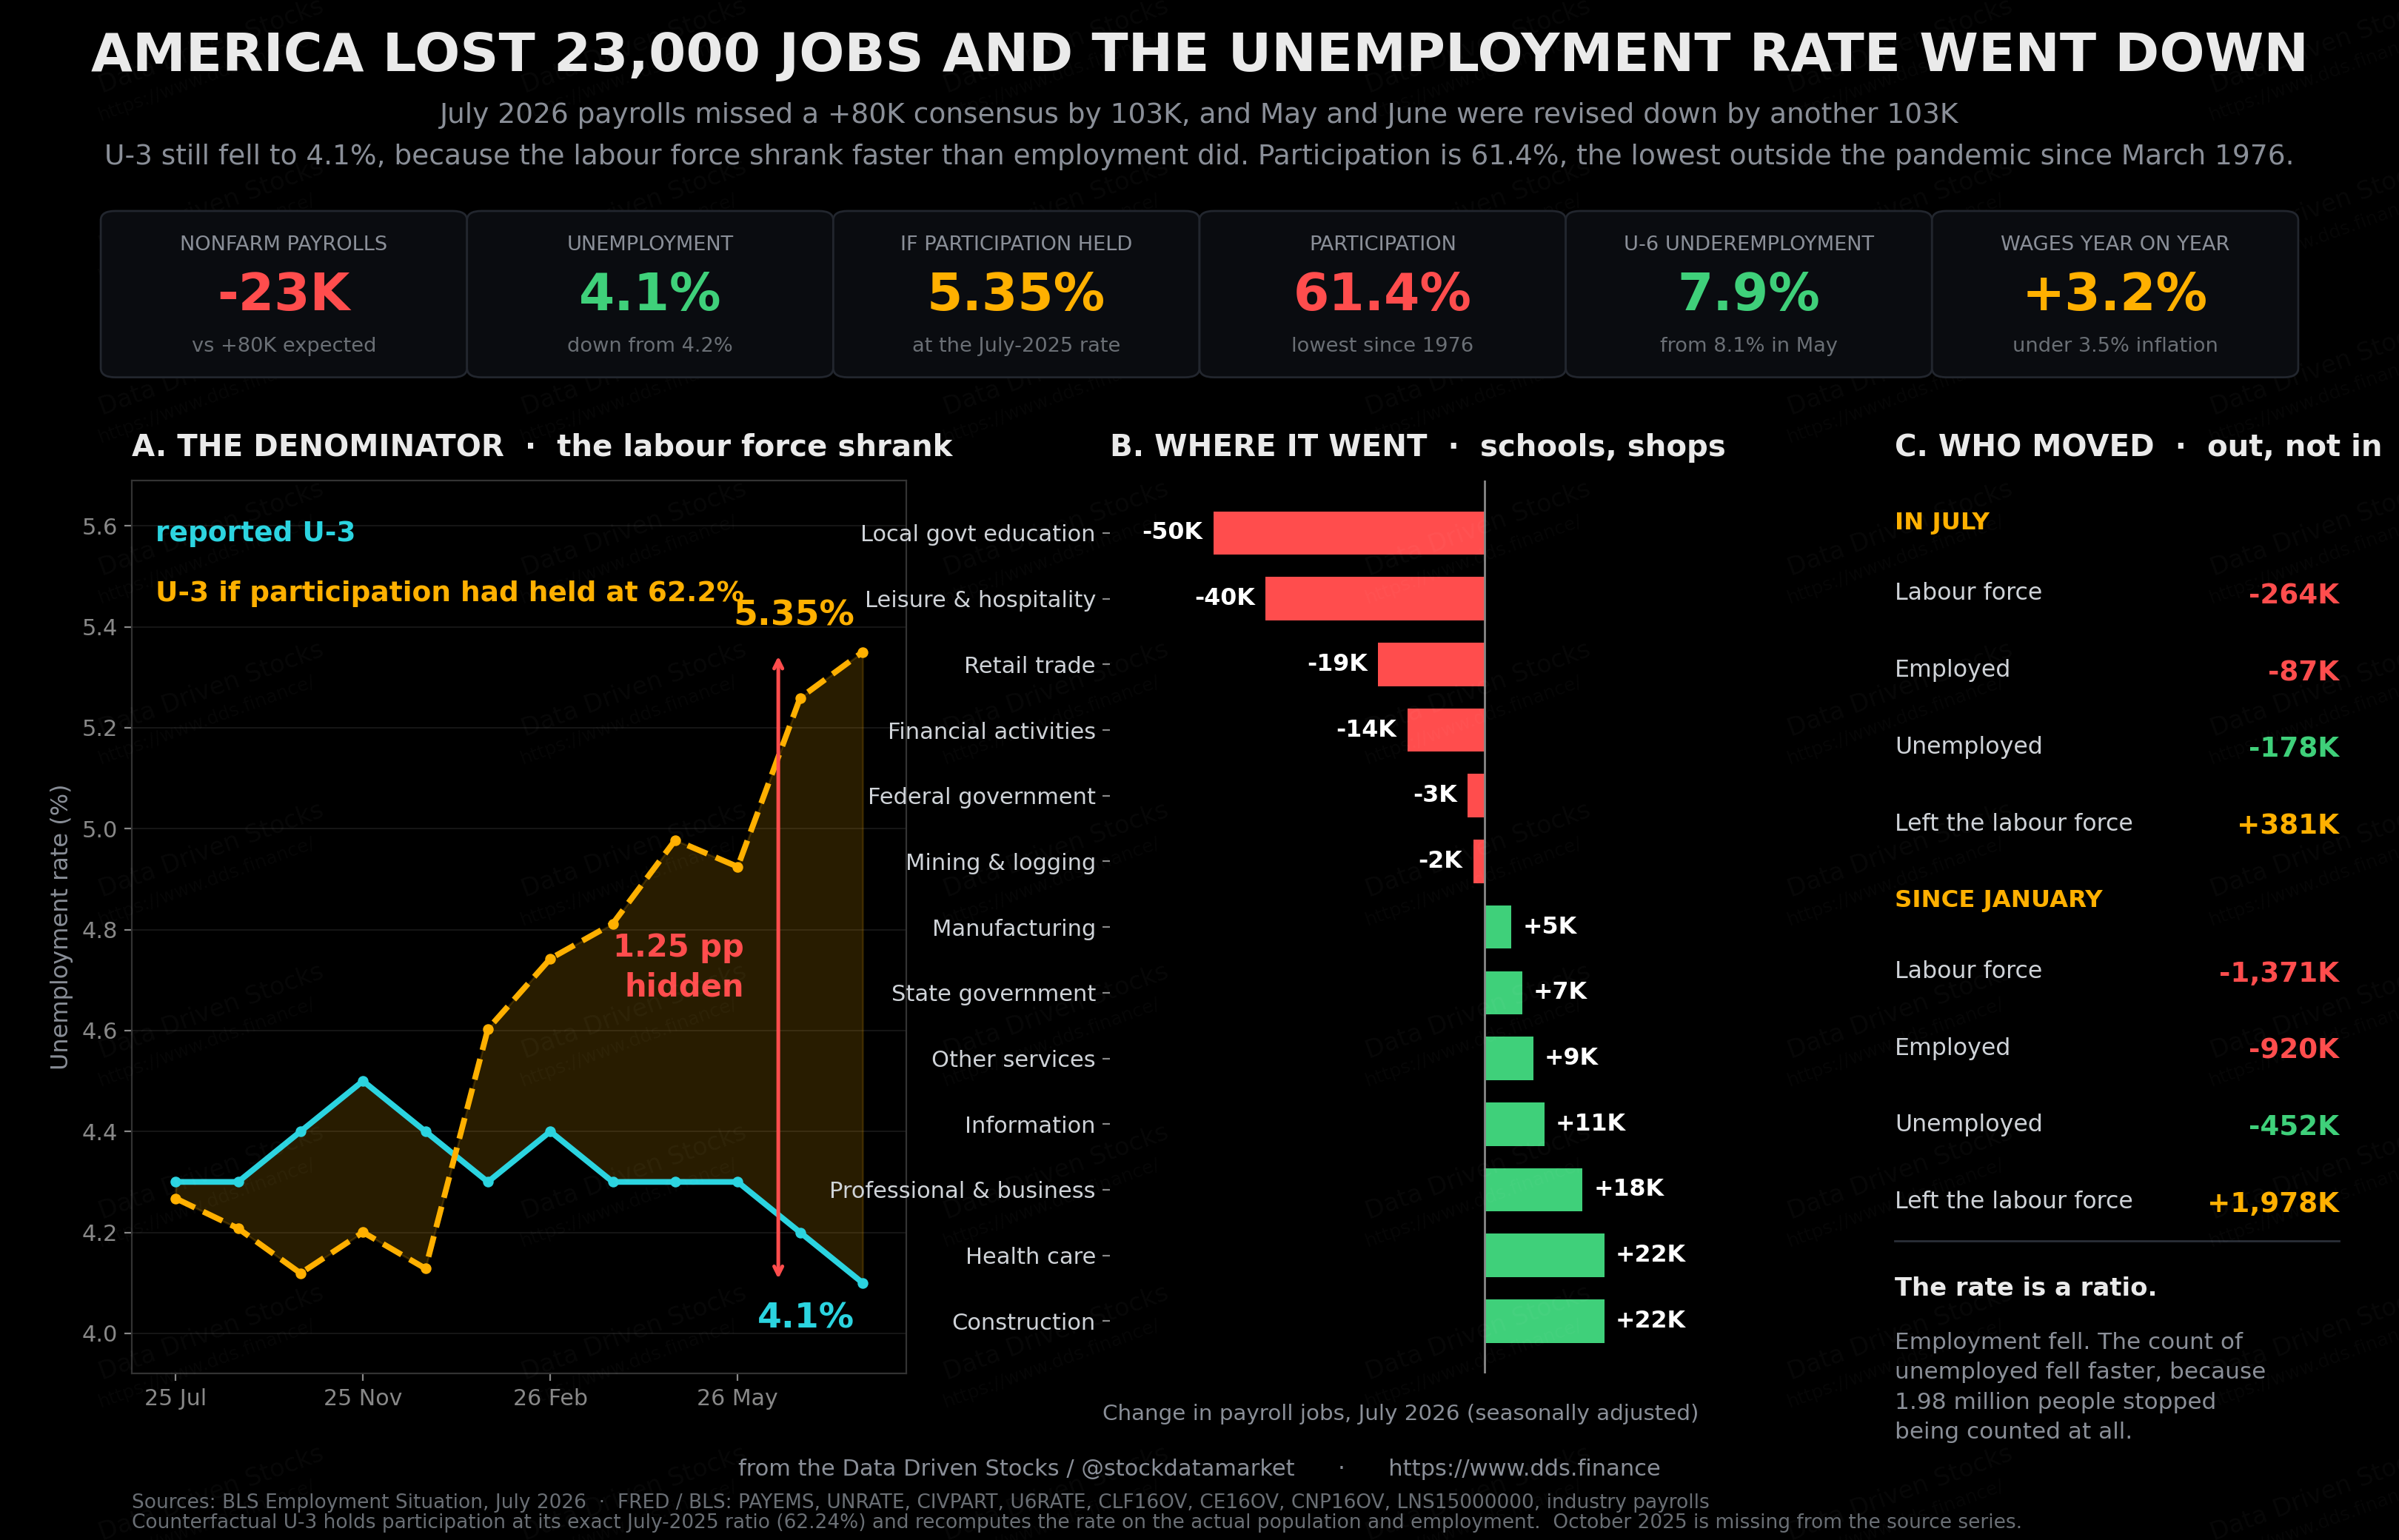
The July jobs report was weak, weaker than the miss suggested once the revisions landed, and the unemployment rate got better anyway because 381,000 people stopped being counted in a single month.

If you are somewhere in the US, you probably saw a headline that said the economy lost jobs, saw another one that said unemployment fell, and closed the tab.
Both headlines were correct. That is the part worth ten minutes of your weekend.
What actually printed
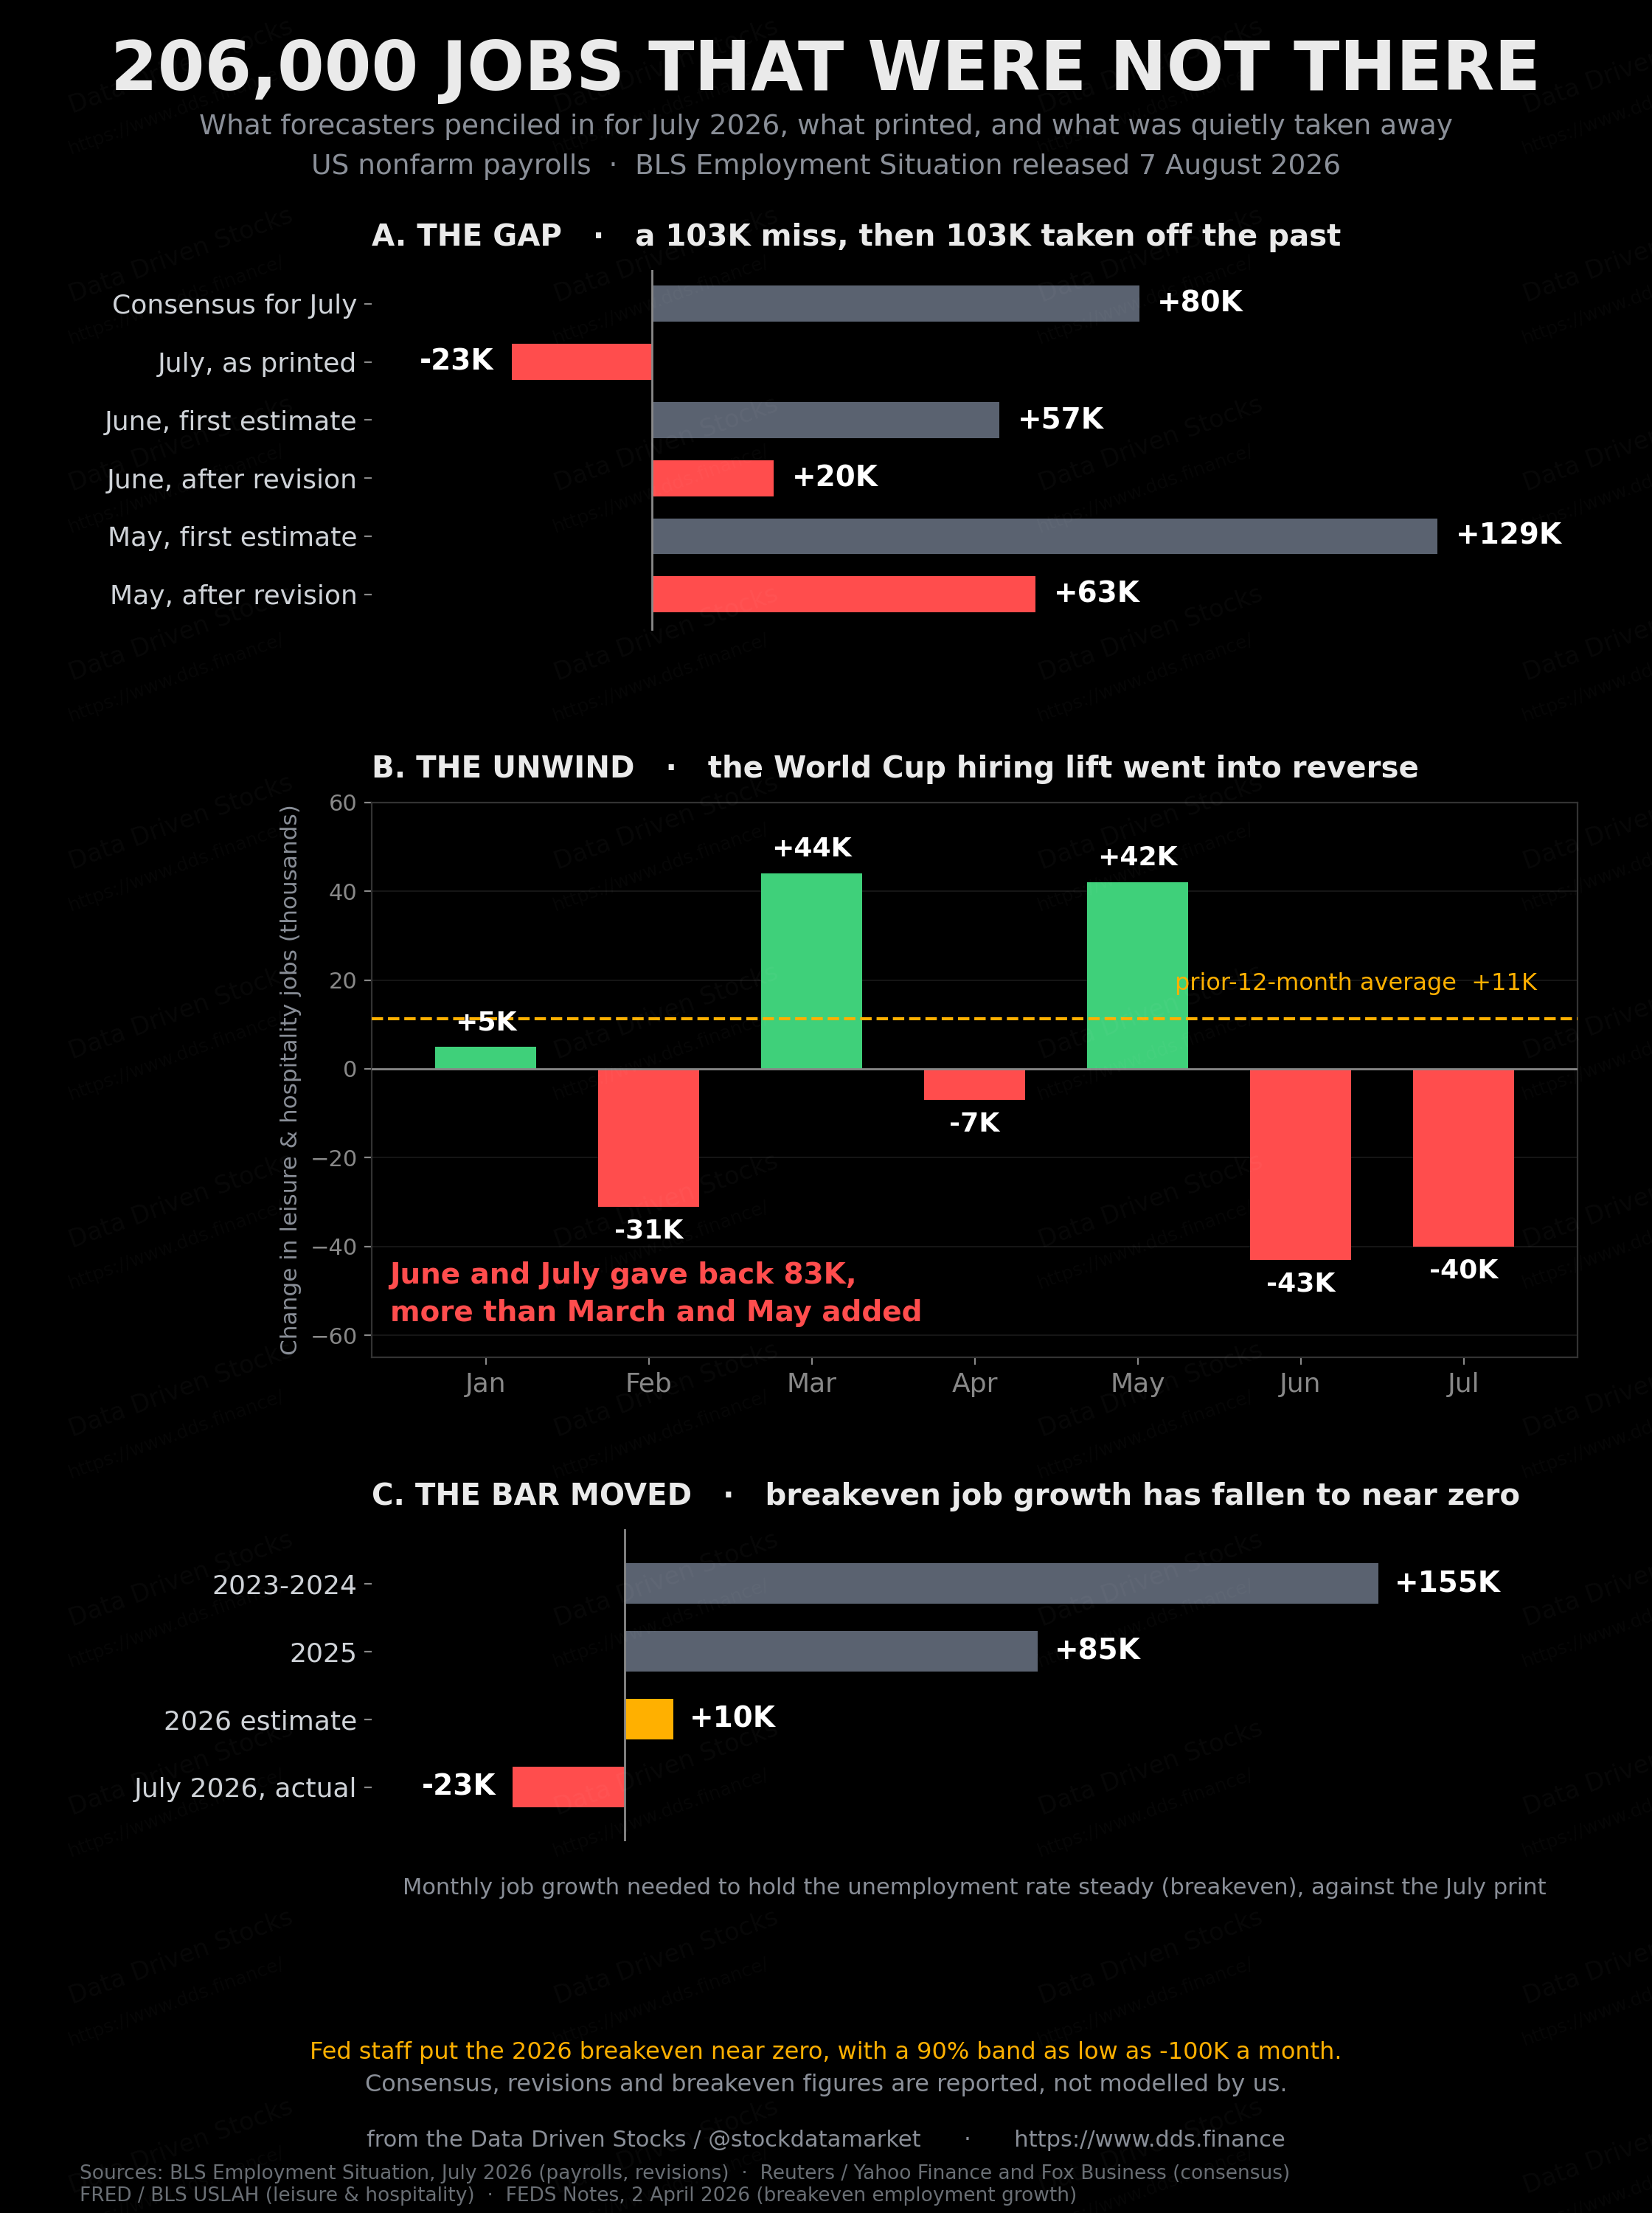
Nonfarm payrolls fell by 23,000 in July. Economists had penciled in a gain of about 80,000. So the print missed by 103,000, which is a big miss by any standard, and then the Bureau of Labor Statistics went back and took another 103,000 off the two months before it. May came down from 129,000 to 63,000. June came down from 57,000 to 20,000.
Two hundred and six thousand jobs that people thought existed on Thursday did not exist on Friday. That is the shape of the report.
The unemployment rate went to 4.1% from 4.2%. Forecasters had it going the other way, to 4.3%. Average hourly earnings came in at $37.62, up two cents on the month and 3.2% over the year. The average workweek did not budge from 34.3 hours. That last detail matters more than it looks, and I will come back to it.
Markets took it as good news, in the specific way that markets do when the Federal Reserve has been threatening to raise rates. The odds of a September hike dropped from about 55% to 40%. Two-year Treasury yields fell eight basis points to 4.16%, ten-years fell six to 4.61%, and the dollar index slid half a percent to 99.43. The Nasdaq closed up 0.8%. Fewer jobs, higher stocks. Welcome to 2026.
Why the forecasters were 103,000 wrong
There are two answers here, and only one of them is about the economy.
The first is boring and specific. Local government education shed 50,000 jobs in July. Retail trade lost 19,000. Financial activities lost 14,000 and has now been shrinking for months. Leisure and hospitality dropped 40,000, which is the second monthly decline in a row after losing 43,000 in June.
That hospitality line deserves its own paragraph, because it is the ghost of a story I wrote in June. Back then, leisure and hospitality had just posted 70,000 jobs, its biggest monthly gain in about three years against a 14,000 monthly average, and Bank of America put a name on it in a research note: World Cup fever. Restaurants and bars staffing up for a tournament that kicked off on 11 June. I argued at the time that the lift looked borrowed rather than earned. It was. That May figure has since been revised down to 42,000, and June and July together gave back 83,000. The tournament ended and the bartenders went home.
Health care added 22,000, doing what it always does. Construction added 22,000. Professional and business services added 18,000, and information added 11,000 after a rough patch. Private payrolls were actually up 30,000. Government was down 53,000 and did all the damage.
The second answer is the one nobody wants to say out loud at a bank. The consensus was measuring July 2026 with a 2023 ruler, and the ruler has shrunk.
Federal Reserve staff published a note in April working out how many jobs the US now needs to add each month just to hold the unemployment rate flat. That figure has a name, breakeven employment growth, and it used to be around 155,000 a month during 2023 and 2024. In 2025 it dropped to about 85,000. For 2026 the staff put it at under 10,000 a month, and they wrote that the 90% confidence band around it stretches down to monthly declines of 100,000 even when output is growing at potential.
A negative 23,000 print therefore sits comfortably inside the range you would expect from an economy running at trend. The forecasters who wanted 80,000 were asking the labour market to do something it no longer has the people to do.
The part that breaks people’s brains
Employment fell. Unemployment fell. Both.
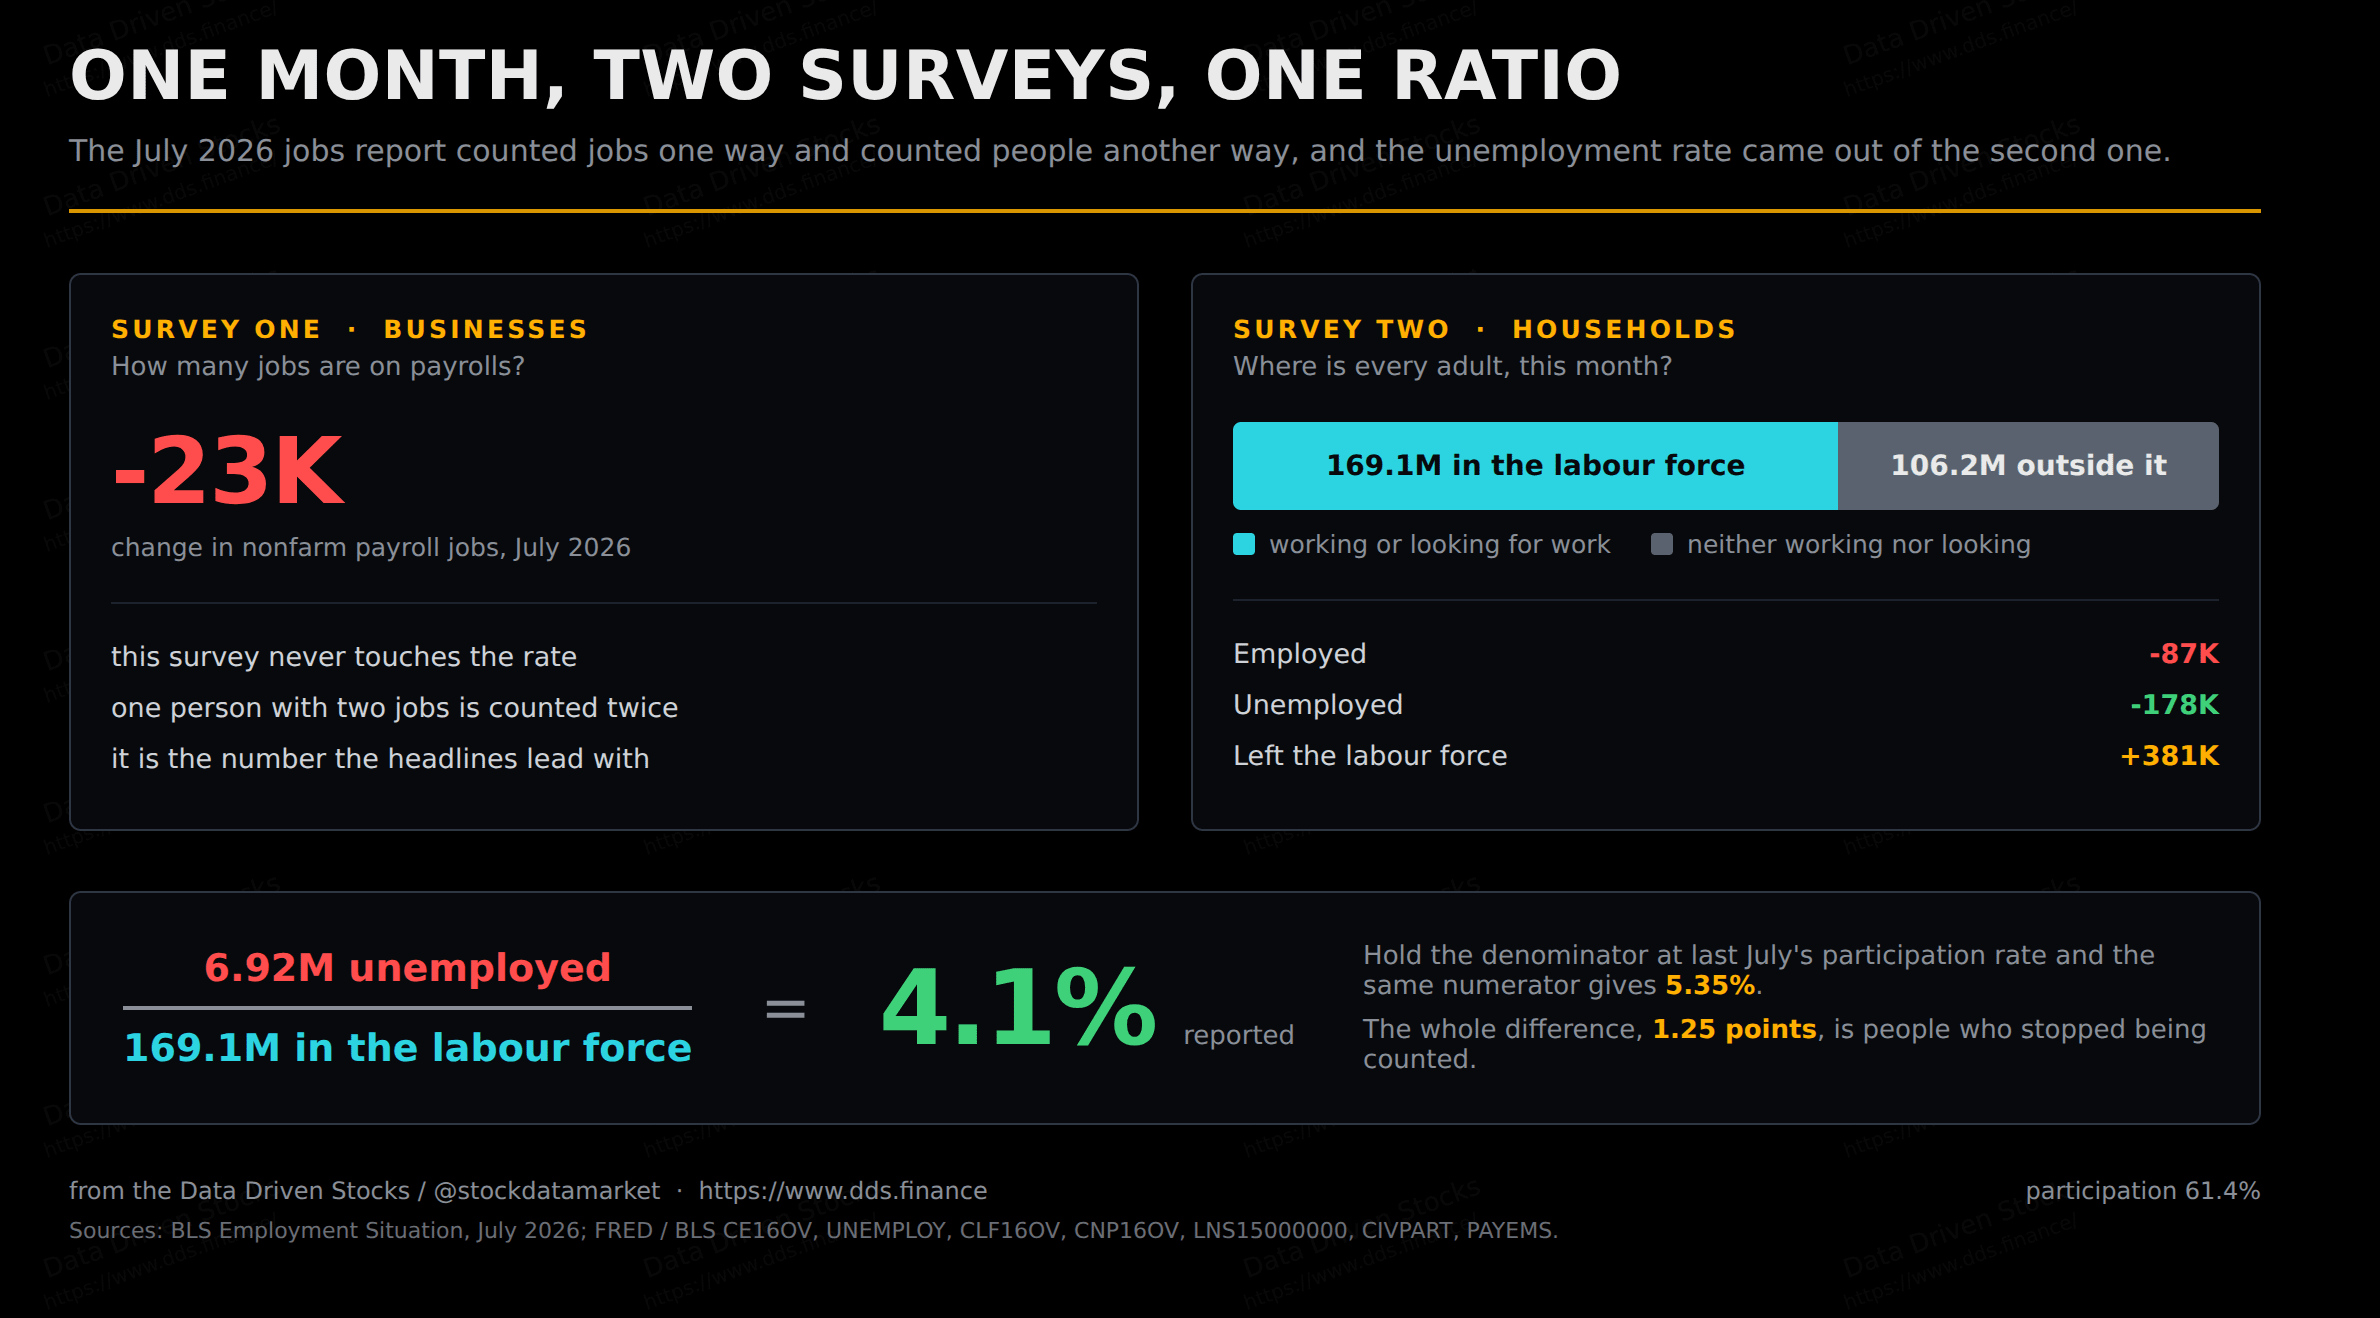
Here is the arithmetic, and it takes about thirty seconds. The unemployment rate is the number of unemployed people divided by the number of people in the labour force. The labour force means everyone who is either working or actively looking. If you stop looking, you leave the labour force entirely. You are not employed. You are not unemployed. You are gone from the calculation.
In July, the household survey counted 87,000 fewer people employed. It counted 178,000 fewer people unemployed. And it counted 381,000 more people who were neither. The labour force shrank by 264,000, which Trading Economics flagged in its own write-up of the release.
So the numerator fell faster than the denominator, and the rate went down.
Now widen the window. Since January, the labour force has contracted by 1.37 million people. Employment is down 920,000. The count of unemployed is down 452,000. And 1.98 million more Americans now sit outside the labour force than did in January, against a working-age population that grew by 606,000 over the same stretch.
This is where I stopped being casual about the report.
Take the July participation rate from a year ago, 62.24% on the unrounded numbers, and apply it to today’s actual population. Then take today’s actual employment count and work out what the unemployment rate would be. The answer is 5.35%.
Not 4.1%. The gap is 1.25 percentage points, and every bit of it is people who stopped being counted.
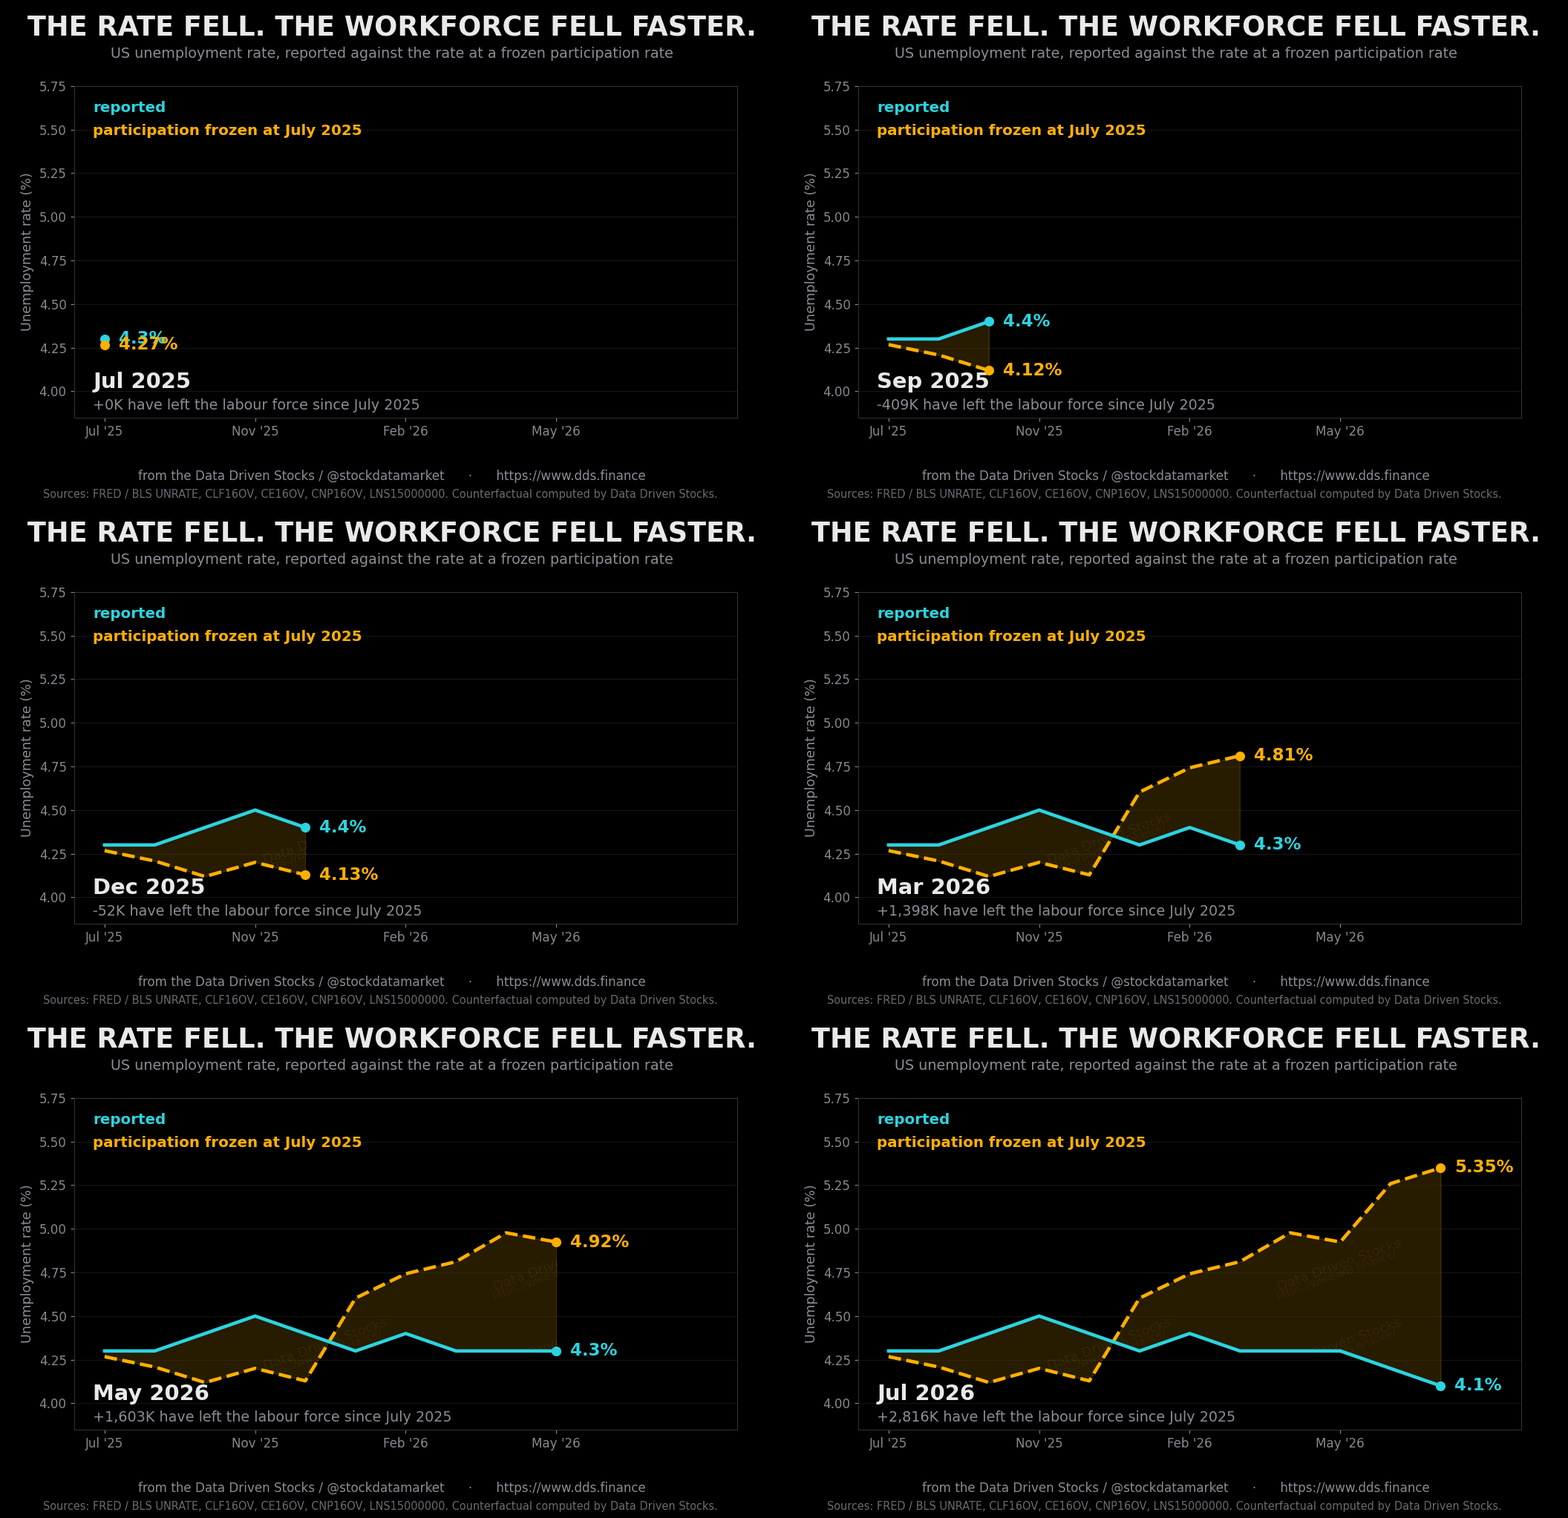
I want to be careful here, because a counterfactual is not a forecast and it is not a claim that the “true” unemployment rate is 5.35%. There are 2.8 million more people outside the labour force than there were last July, and plenty of them retired on schedule and are perfectly happy about it. Freezing participation is a thought experiment, not a measurement. But it puts a number on how much of the good news in that 4.1% is arithmetic rather than employment, and the number is most of it.
Is participation really that bad?
Yes and no, and the split is more interesting than either camp admits.
The level is bad. Participation is 61.4%. Outside the pandemic window, the last time it sat this low was March 1976, when it printed 61.3%. Trading Economics reached the same conclusion independently, writing that excluding 2020 and 2021 the labour force is at its lowest since 1976. Fifty years.
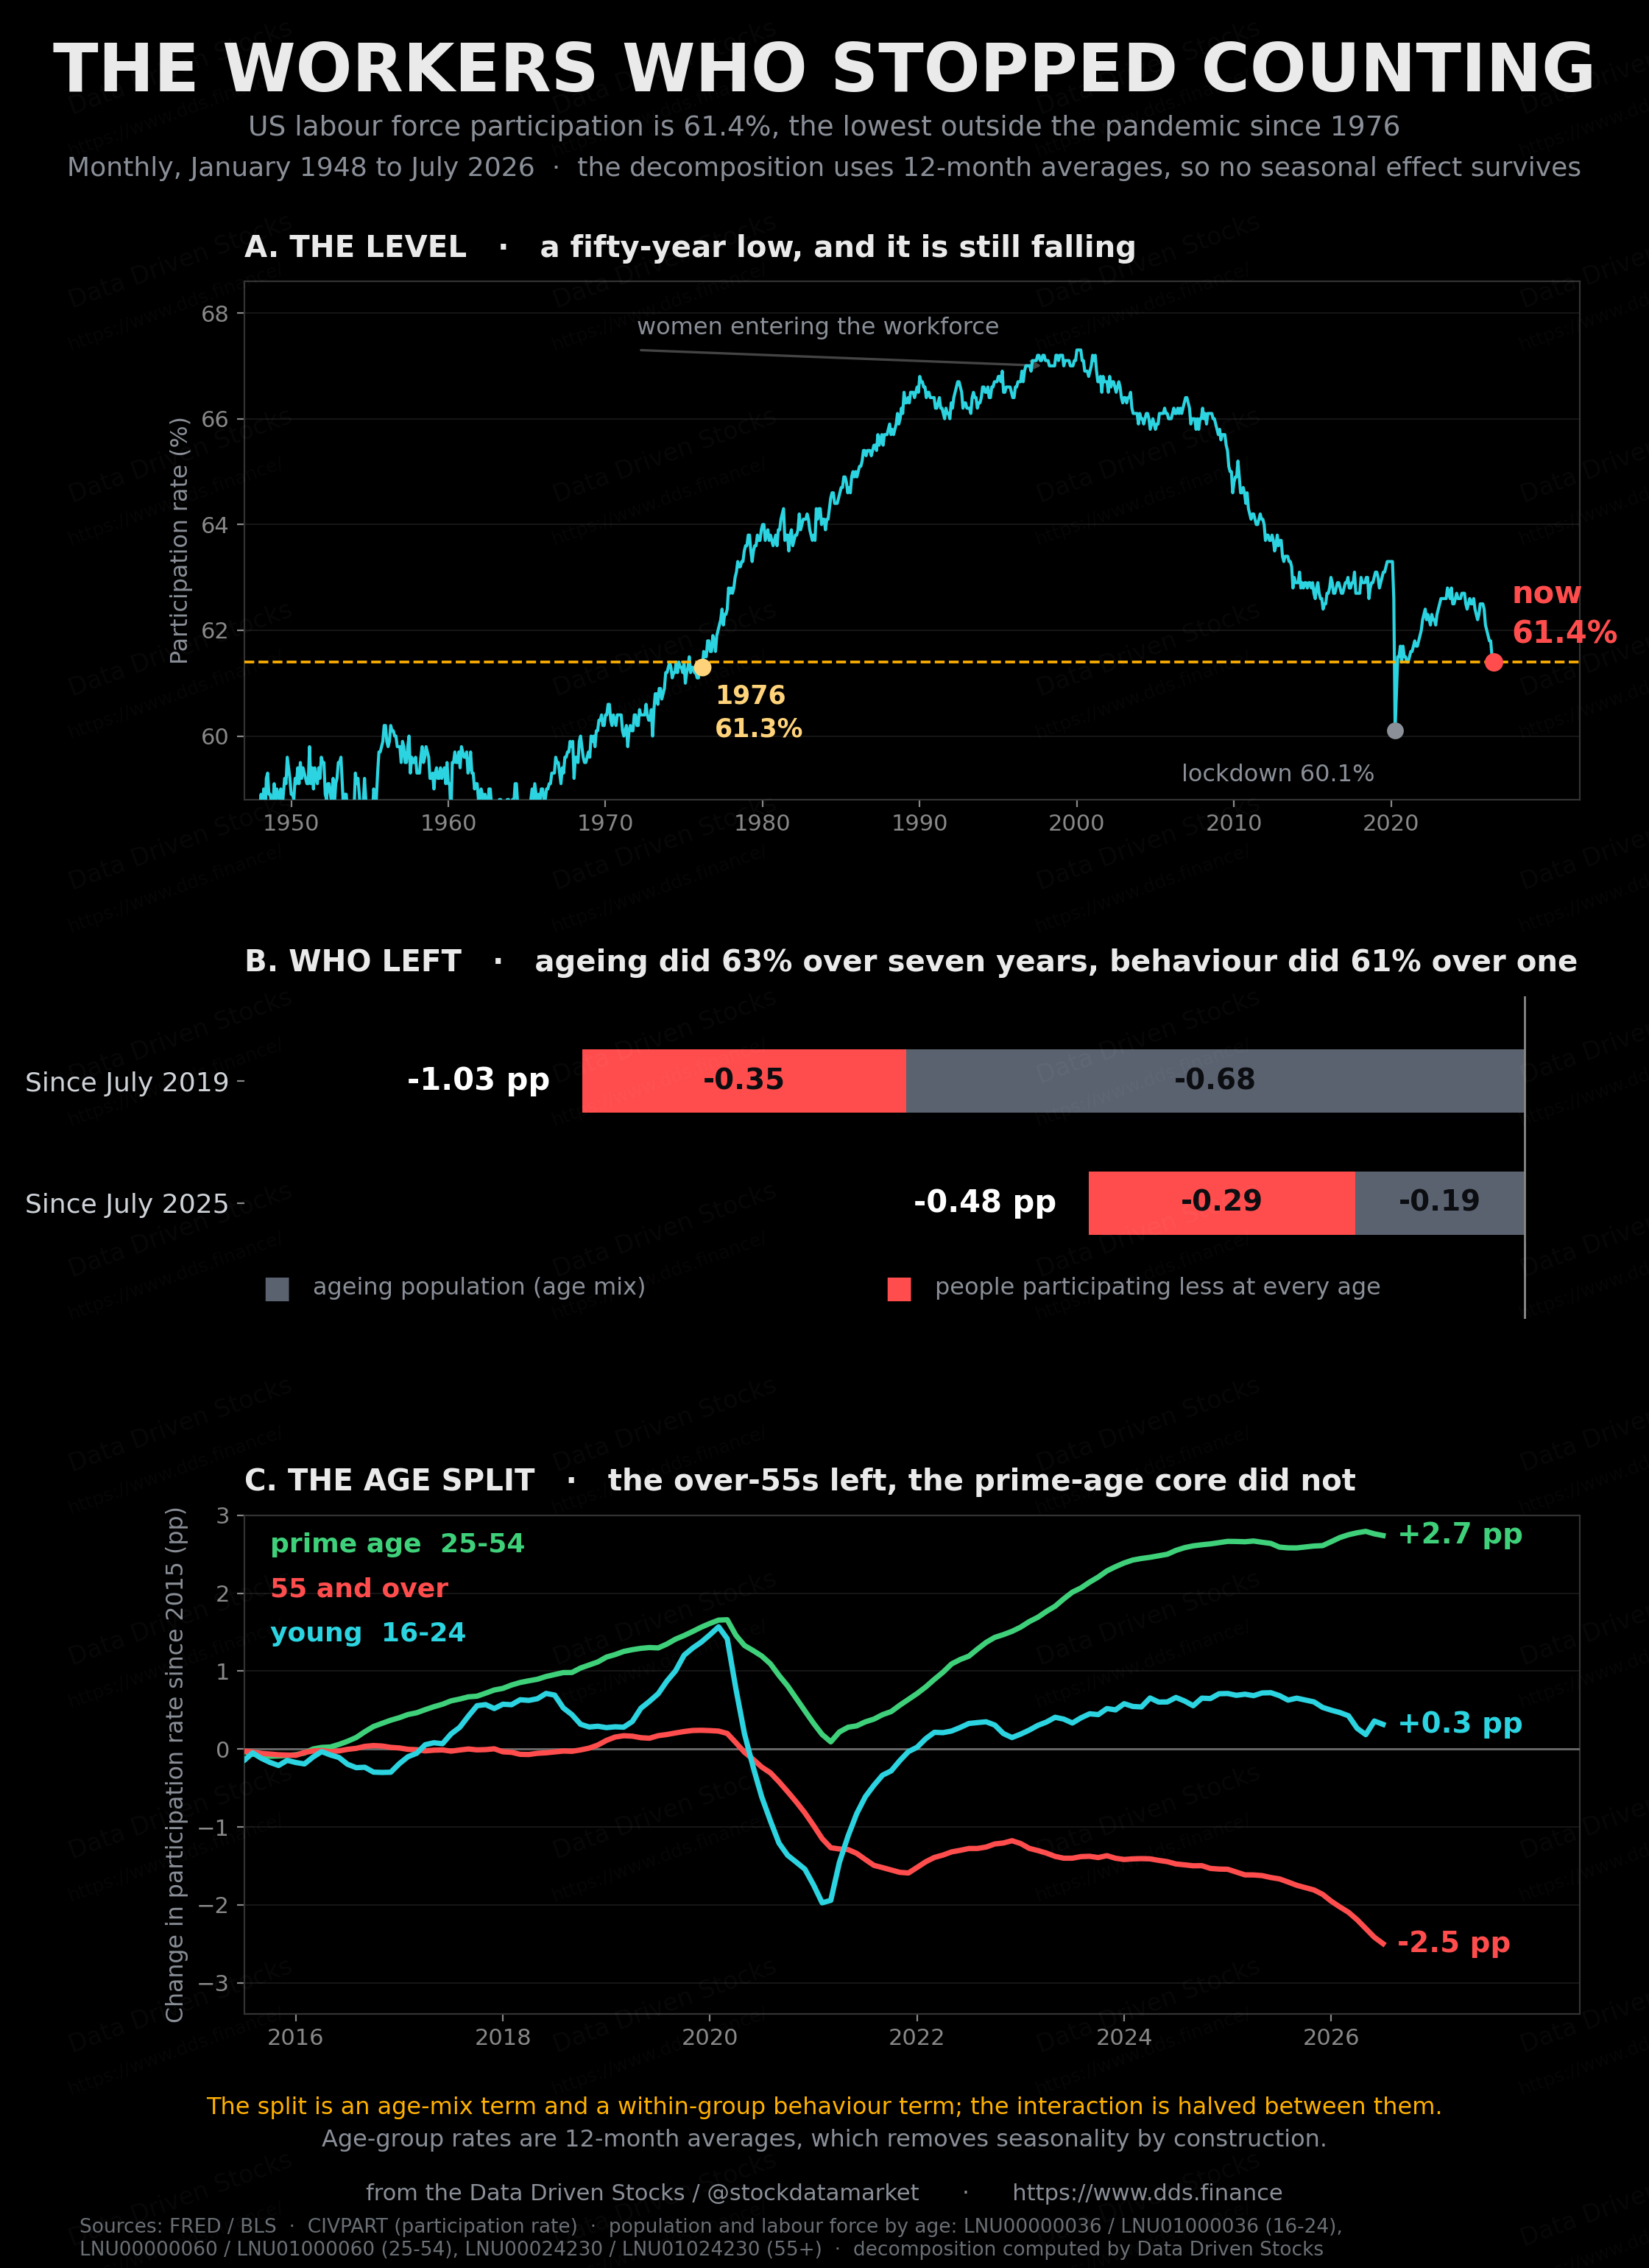
The reflexive explanation is demographics. Boomers are retiring, so of course participation is falling, so nothing to see here. I wanted to know whether that story actually holds, so I decomposed it.
The method is simple enough to check. Split the adult population into three age groups, take twelve-month averages so seasonality disappears by construction, and separate the change in the overall participation rate into two pieces. One piece is what happens purely because the population is getting older, holding each group’s behaviour fixed. The other is what happens because people within each age group are participating at different rates than before.
Over the seven years since July 2019, participation fell 1.03 points. Ageing accounts for 0.65 of that, or 63%. The demographic story is right about the long run.
Over the last twelve months, participation fell 0.48 points, and ageing accounts for only 0.18 of it. Behaviour accounts for 0.29, or 61%. The demographic story is wrong about right now.
Dig into which group is doing it and the answer is the over-55s. Their participation rate has fallen 2.67 points since 2019, and 0.83 points in the last year alone. Same ages, less work. A 62-year-old today is measurably less likely to be in the labour force than a 62-year-old in 2019 was, and the obvious reason is that this cohort watched its house and its portfolio climb enough to make early retirement an easy call.
The one encouraging number is the prime-age core. Americans between 25 and 54 are participating at 1.44 points above their 2019 rate. The people who are supposed to be working are, in aggregate, still working.
That said, the seasonally adjusted prime-age series has turned. It read 84.0% in January and 83.4% in July. Six months of drift is not a trend yet. Give it three more prints and it might be.
There is one more input, and I would be dishonest to leave it out. Foreign-born workers in the US participate at 66.3%, against 61.6% for the native-born, and about seven in ten of them fall in the prime-age band against roughly six in ten of the native-born. Immigration policy is labour-supply policy whether anyone wants to frame it that way. The Fed’s own note put potential labour force growth at under 10,000 workers a month for 2026 and called that unprecedented in US history, and it got there mostly by marking down net immigration.
What a 4.1% headline is hiding
The rate improved. Almost nothing underneath it did.
U-6, the broad measure that sweeps in the underemployed and the marginally attached, sits at 7.9%. That is exactly where it was a year ago. But U-6 divides by the same shrinking labour force as U-3, so flat is not the reassurance it looks like.
Everything that measures depth rather than headcount got worse. The share of unemployed Americans who have been out of work for 27 weeks or more rose from 24.9% to 25.5%. The number of people working part time because they cannot find full-time work rose from 4.689 million to 4.804 million. The average unemployment spell stretched from 24.0 weeks to 24.9.
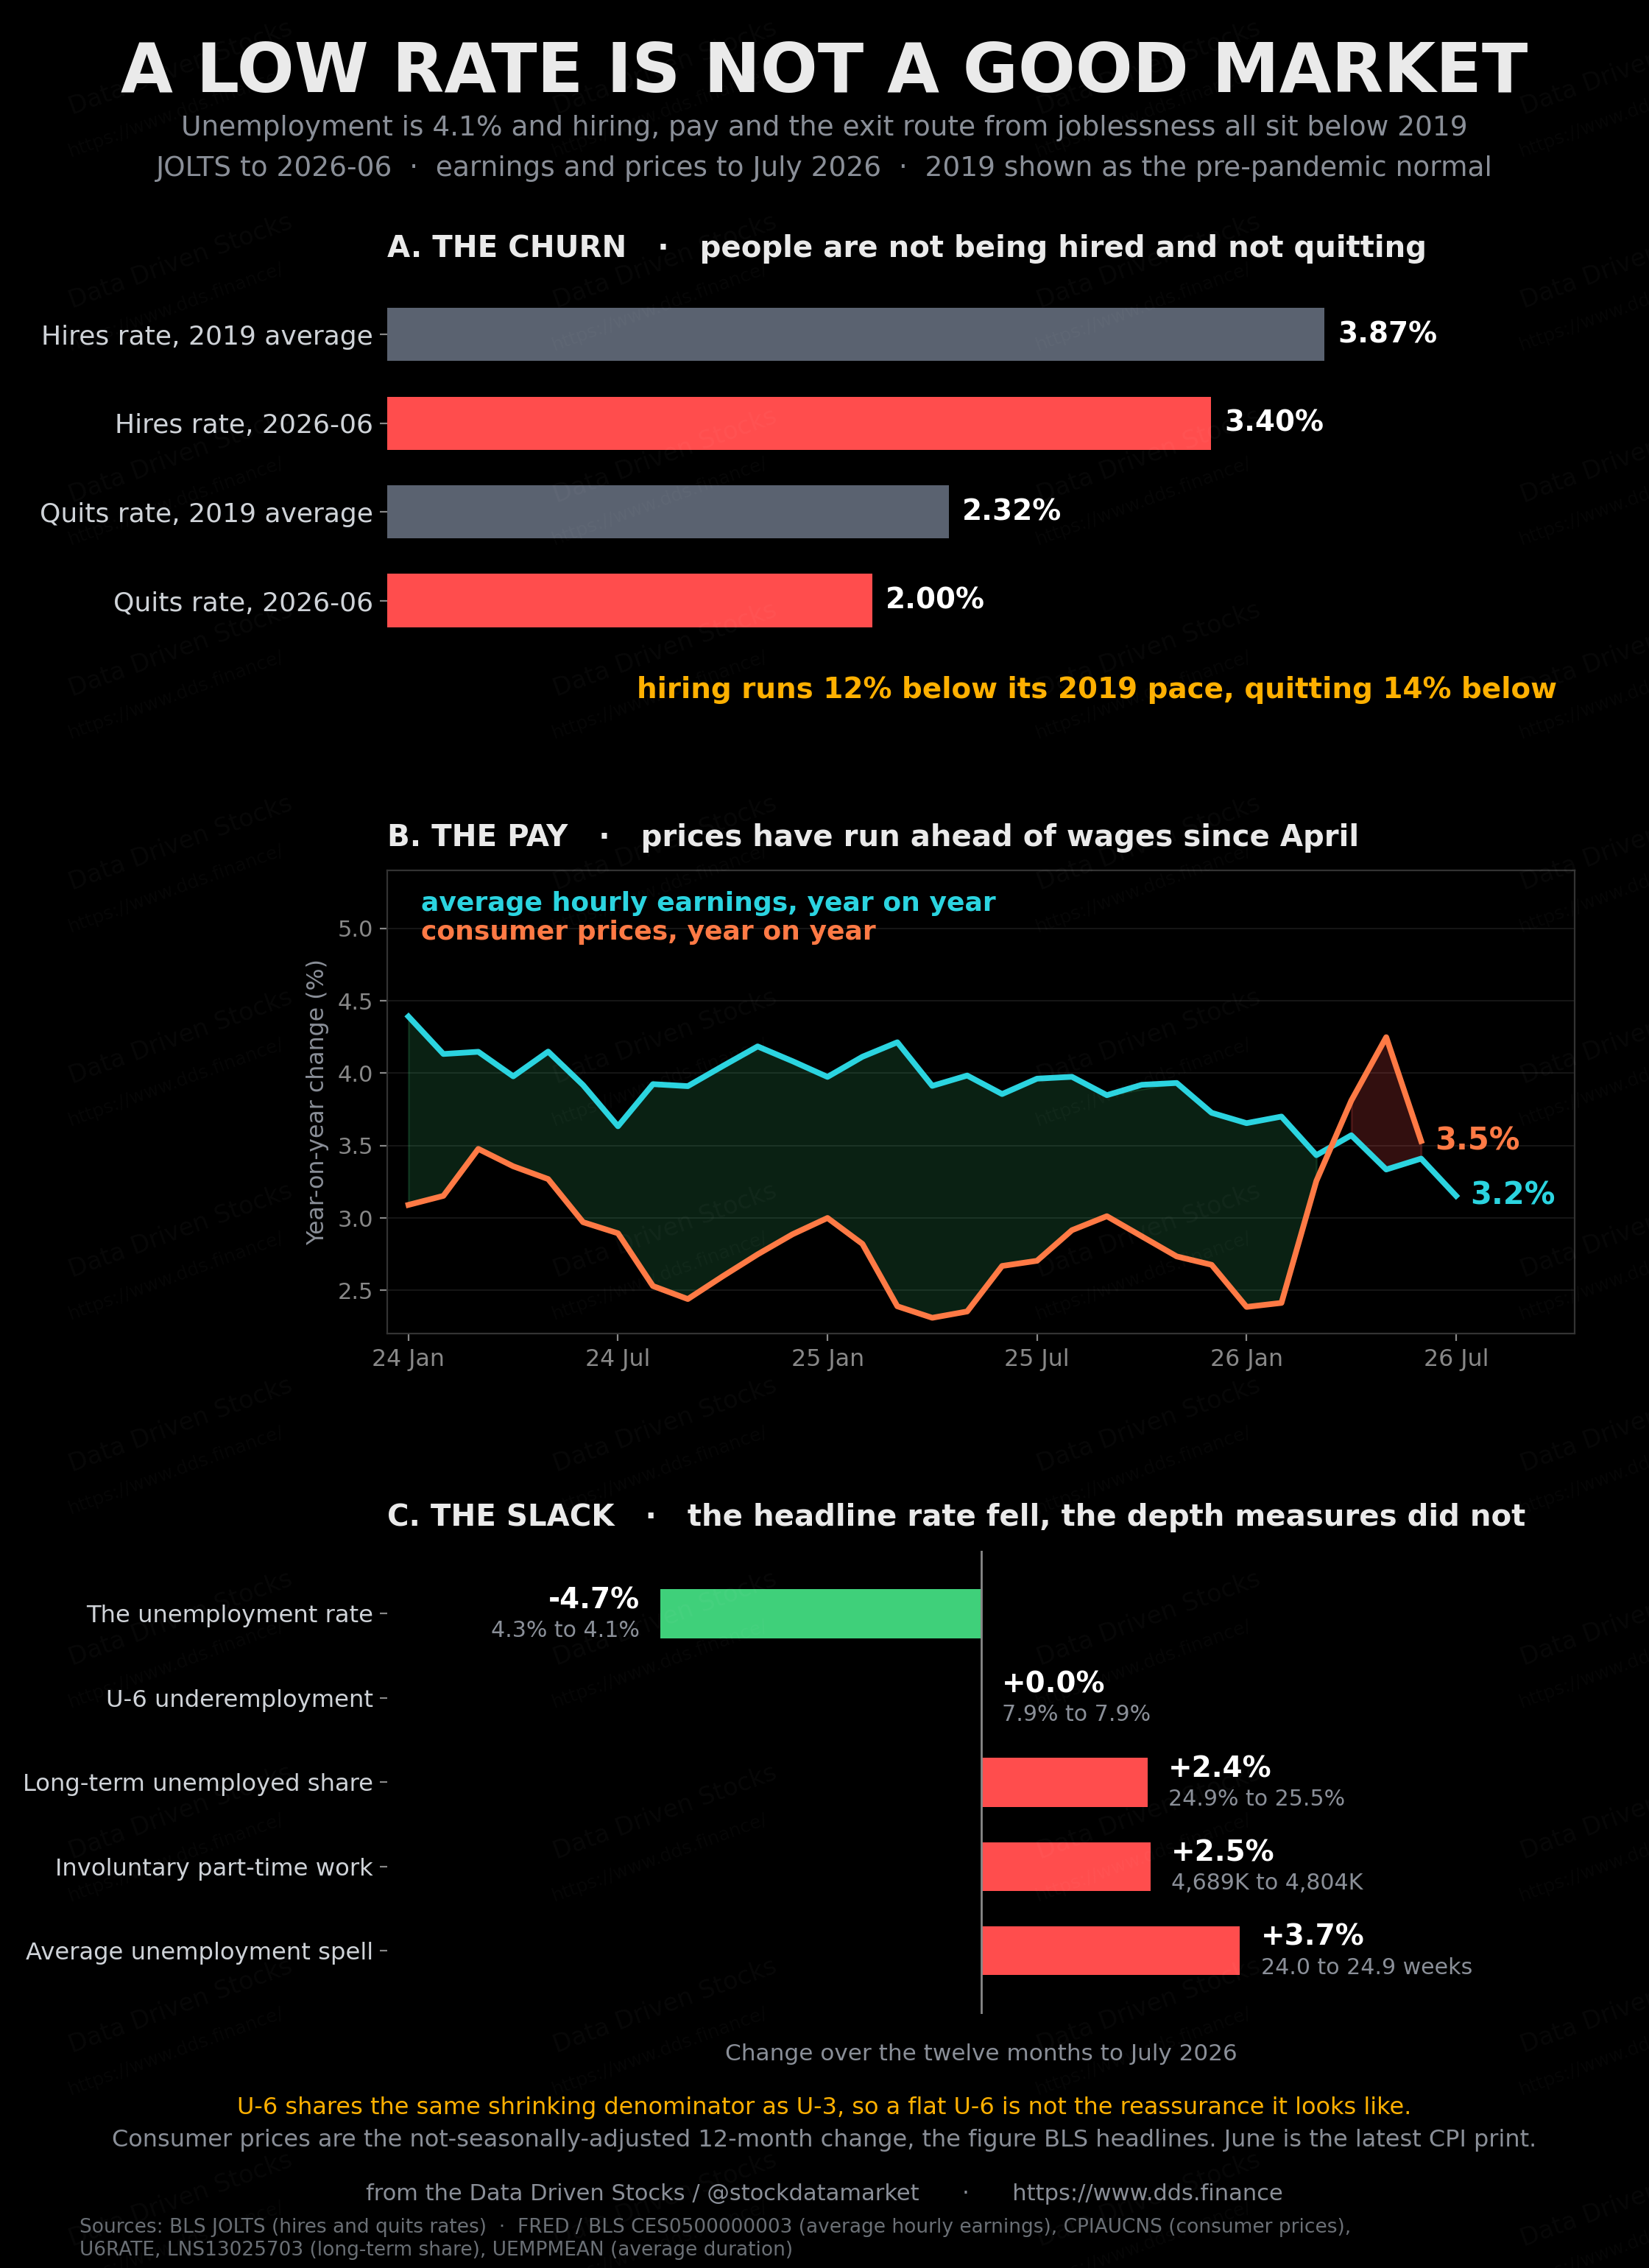
The churn data says the same thing from a different angle. June JOLTS put the hires rate at 3.4% against a 2019 average of 3.87%, and the quits rate at 2.0% against 2.32%. Hiring runs about 12% below its pre-pandemic pace, quitting about 14% below. People are not being hired and people are not leaving. Layoffs are low, initial claims are 199,000 and the four-week average is 198,750, which is near the lowest in decades.
If you have a job, this market feels stable. If you want a different job, it feels like a wall. Both descriptions are accurate and they are describing the same economy.
And the pay is not making up for it. Average hourly earnings are running 3.2% over the year. Consumer prices ran 3.5% in June. Prices have been ahead of wages every month since April, when the Iran conflict pushed the energy index up 15.7% over the year and headline inflation briefly touched 4.2%. The ceasefire has since brought energy down, June CPI fell 0.4% on the month and core inflation is at 2.6%, but a worker whose paycheque grew 3.2% while their cost of living grew 3.5% has not had a good year.
That flat 34.3-hour workweek fits the same picture. When demand softens, employers usually cut hours before they cut heads. Hours have not moved. Employers are neither expanding nor retreating. They are sitting still.
What to actually keep in your head about jobs data
Most of the confusion around these releases comes from a handful of things that are never explained on television, so here they are in plain language.
There are two surveys, not one. The payroll number comes from asking businesses how many jobs are on their books, and it double-counts anyone holding two jobs. The unemployment rate comes from asking households where each adult sits this month. They are different instruments measuring different things, and in a month like July they disagree loudly.
The revisions are not a footnote, they are the report. A first estimate is a sample. The number you get two months later is closer to reality, and this month it was 103,000 worse. If you traded the May headline you traded a number that no longer exists.
The bar moved. Breakeven job growth was 155,000 a month two years ago and is under 10,000 now. Judging a 2026 print against a 2023 mental benchmark will make you wrong in a specific direction, and this month it made the entire street wrong.
The rate is a ratio, and the denominator has been moving more than the numerator. Any month where participation drops, the unemployment rate gets flattered for reasons that have nothing to do with anyone finding work.
Hires matter more than openings. Postings are cheap and firms leave them up. Someone starting a job is the only thing that ends unemployment for an actual person.
So will unemployment go up?
It has to, eventually, and the timing depends on whether labour demand or labour supply moves first.
Unemployment rises when employment falls faster than the labour force does. Right now the labour force is falling at about 107,000 a month while employment is roughly flat, which is why the rate keeps drifting down through a jobs report that would have looked alarming in any other decade.
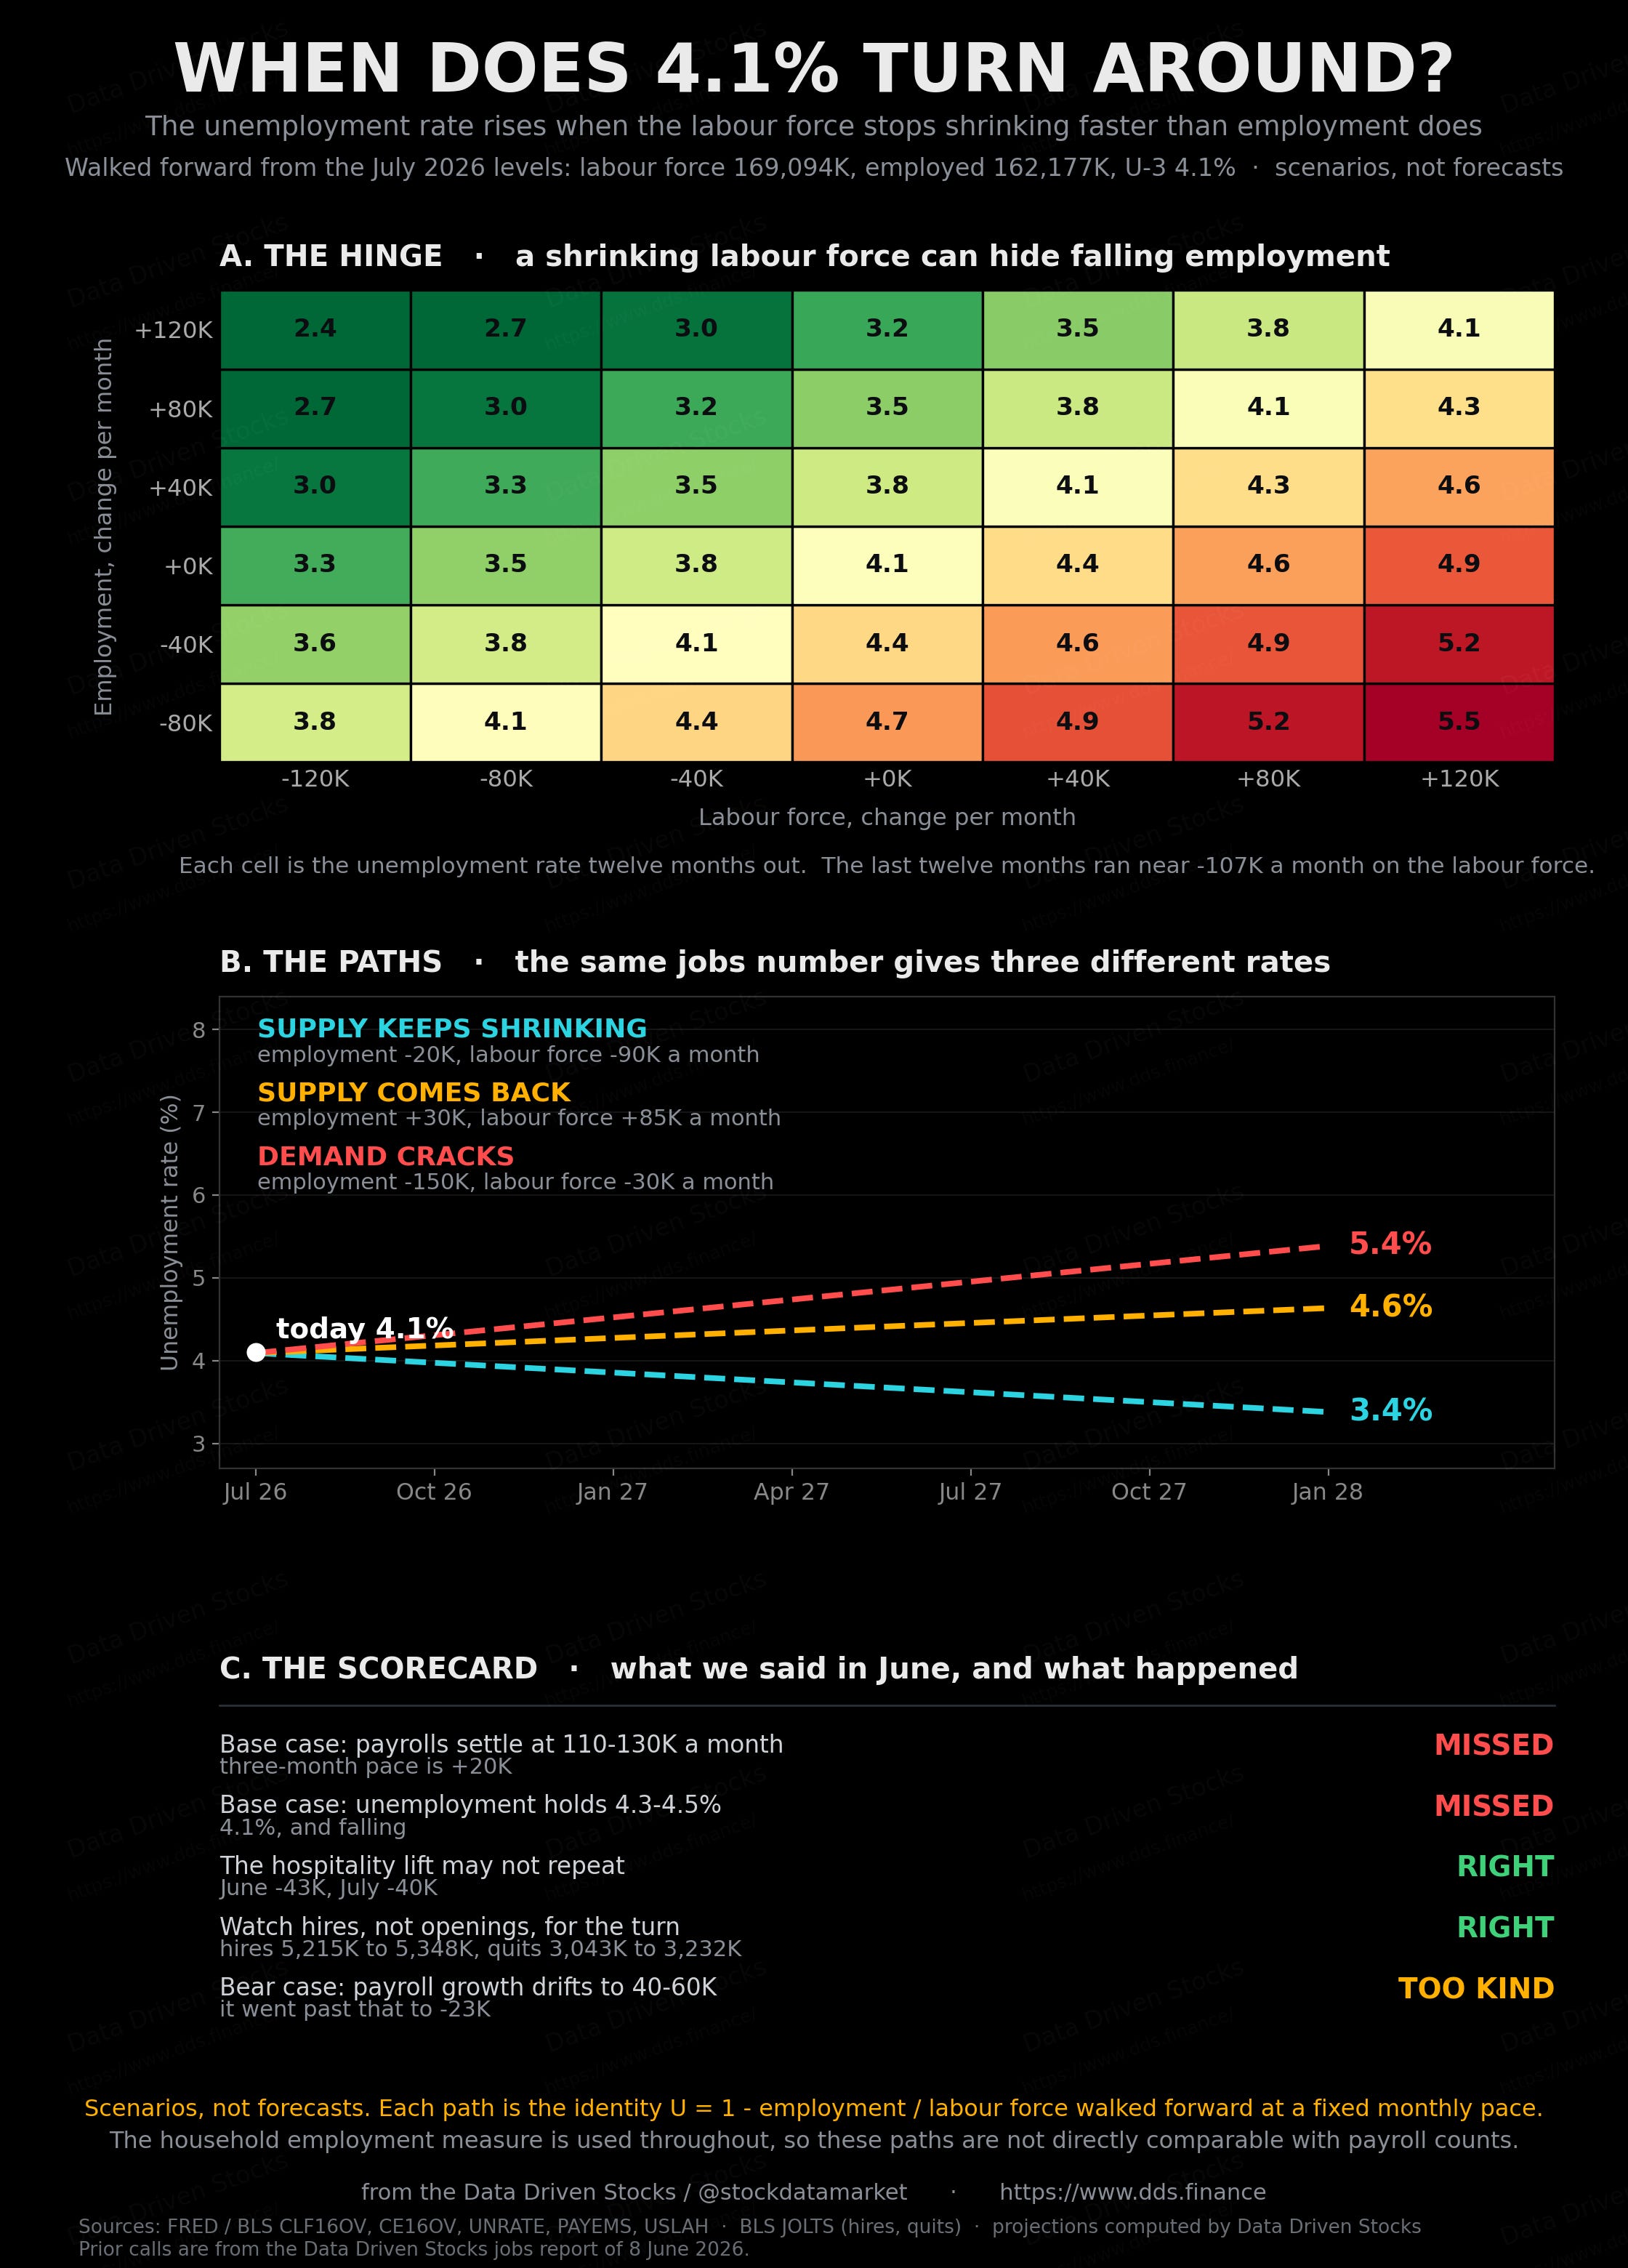
Walk the identity forward and the answer falls out. Keep employment shrinking 20,000 a month while the labour force sheds 90,000, and eighteen months from now the unemployment rate is 3.4%, a number that would be reported as full employment while employment itself declines. Let labour supply come back, say employment growing 30,000 a month while the labour force grows 85,000 as immigration normalises and the early retirements slow, and the rate climbs to 4.6% while the economy is objectively healthier. And if demand actually cracks, employment falling 150,000 a month with the labour force down 30,000, you get 5.4%.
The uncomfortable implication is that the rate could go up because things got better. A rising unemployment rate driven by people returning to the labour force is a good headline dressed as a bad one, and I expect a lot of people to misread it when it happens.
I should also mark my own homework, because the June piece made calls and they deserve scoring. The base case had payrolls settling into a 110,000 to 130,000 monthly pace with unemployment holding 4.3% to 4.5%. The three-month pace is 20,000 and unemployment is 4.1%. Missed on both. The bear case had payroll growth drifting to 40,000 or 60,000, which turned out to be too generous. What held up were the two mechanical calls: the hospitality lift did not repeat, and hiring churn was the thing to watch. Hires ran from 5.215 million in April to 5.348 million in June and quits from 3.043 million to 3.232 million, so churn has thawed slightly even as the headline deteriorated.
The lesson I am taking from being wrong is that I anchored on job growth as the variable and treated labour supply as background. That was backwards. In 2026 the supply side is the story.
The part that should worry equity holders
Everything above is cyclical. This next bit is not.
Real output growth is exactly two things added together: hours worked and output per hour. That is how the statistics are built rather than a theory about them, and it holds to the second decimal in the data.
Labour force growth ran 1.70% a year in the 1960s. By the 2010s it was 0.67%. Over the last twelve months it was minus 0.75%. The pool of American workers is not growing more slowly. It is shrinking.
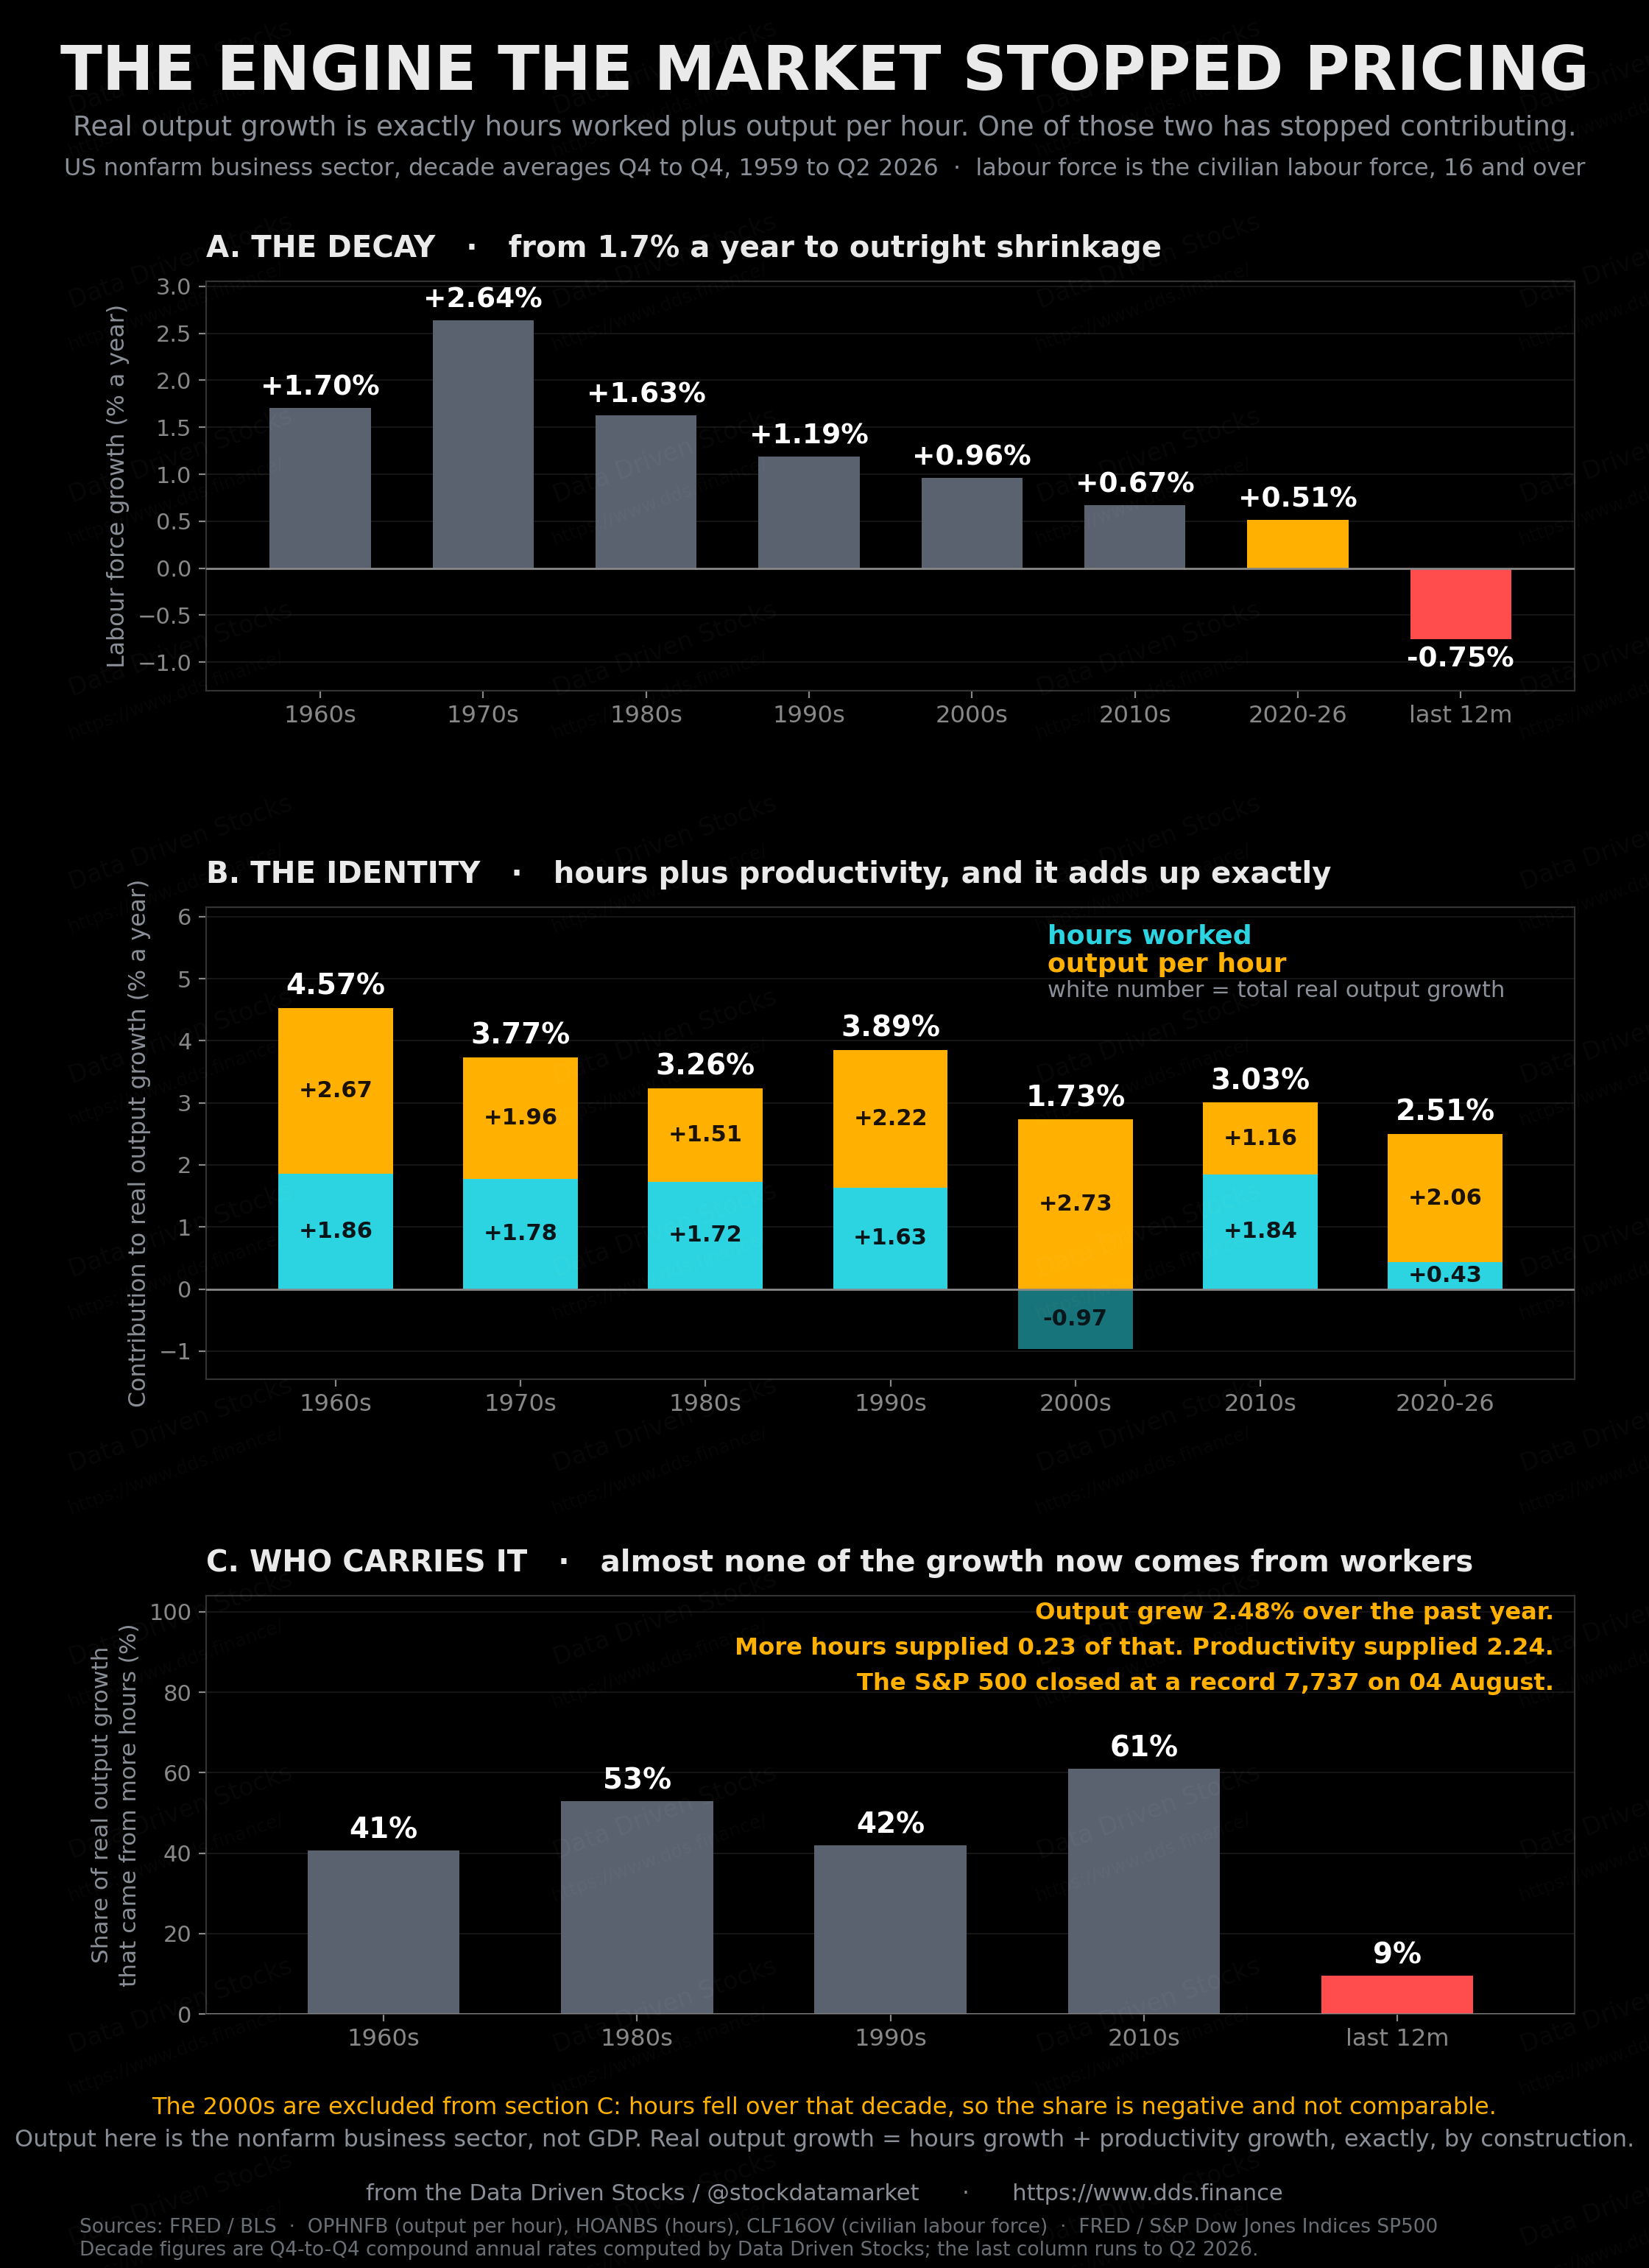
Over the last year the nonfarm business sector grew output by 2.48%. Hours contributed 0.23 of that. Productivity contributed 2.24. Which means 9% of American economic growth over the past year came from more people working. In the 2010s that figure was 61%. In the 1960s it was 41%.
Corporate profits ultimately track nominal output, and equity prices ultimately track profits. If the workforce contributes nothing to growth, the growth rate of the earnings base rests entirely on productivity. At the current labour force trend of minus 0.75%, productivity has to run above 2.75% just to keep output growing at 2%.
Right now it is delivering. Second-quarter productivity rose 1.4% at an annual rate and 2.2% over the year, comfortably ahead of the 1.16% the 2010s managed. Unit labour costs rose 1.3%, below what the market expected. The S&P 500 closed at a record 7,736.52 on 4 August and sits up more than 12% for the year.
So the market is making a legible bet: that automation and software keep raising output per worker fast enough to cover an economy that no longer adds workers. The 1990s ran a similar trade and it worked, with productivity at 2.22% carrying the decade. The 2000s ran it and it broke, with hours falling 0.97% a year and output growth collapsing to 1.73%.
Another half point off participation would barely register. Productivity growth sliding back toward its 2010s average while the workforce keeps shrinking would register a great deal. Put 1.16% productivity next to minus 0.75% labour force growth and you get an economy growing at about 0.4% a year. Nothing in current equity pricing looks like it is discounting that.
Bottom line
The July jobs report was weak, weaker than the miss suggested once the revisions landed, and the unemployment rate got better anyway because 381,000 people stopped being counted in a single month.
The demographic explanation is honest about the last seven years and dishonest about the last twelve months. Ageing did 63% of the damage since 2019 and only 39% of it since last July. The rest is people choosing not to work, concentrated among the over-55s, with prime-age participation now starting to slip too.
None of this shows up in the number that leads the broadcast. A 4.1% unemployment rate reads like a labour market at full employment, and by the standard of the last quarter-century it is. But the hiring rate is 12% below 2019, the average jobless spell is a week longer than a year ago, a quarter of the unemployed have been out of work for more than half a year, and wages have trailed prices every month since April.
Sources
U.S. Bureau of Labor Statistics, Employment Situation Summary, July 2026 - https://www.bls.gov/news.release/archives/empsit_08072026.htm
U.S. Bureau of Labor Statistics, Employment Situation news release (current) - https://www.bls.gov/news.release/empsit.nr0.htm
U.S. Bureau of Labor Statistics, Employment Situation PDF, July 2026 - https://www.bls.gov/news.release/pdf/empsit.pdf
U.S. Bureau of Labor Statistics, Job Openings and Labor Turnover Survey - https://www.bls.gov/news.release/jolts.nr0.htm
U.S. Bureau of Labor Statistics, Consumer Price Index, June 2026 - https://www.bls.gov/news.release/archives/cpi_07142026.htm
U.S. Bureau of Labor Statistics, Productivity and Costs, Q2 2026 - https://www.bls.gov/news.release/prod2.nr0.htm
U.S. Department of Labor, Unemployment Insurance Weekly Claims - https://www.dol.gov/ui/data.pdf
Board of Governors of the Federal Reserve System, “Labor Force Growth, Breakeven Employment, and Potential GDP Growth,” FEDS Notes, 2 April 2026 - https://www.federalreserve.gov/econres/notes/feds-notes/labor-force-growth-breakeven-employment-and-potential-gdp-growth-20260402.html
Congressional Budget Office, “CBO’s Current View of the Economy From 2026 to 2028” - https://www.cbo.gov/publication/62005
Congressional Budget Office, “The Demographic Outlook: 2026 to 2056” - https://www.cbo.gov/publication/61994
Federal Reserve Bank of San Francisco, “Immigration and Changes in Labor Force Demographics” - https://www.frbsf.org/research-and-insights/publications/economic-letter/2025/11/immigration-and-changes-in-labor-force-demographics/
Federal Reserve Economic Data (FRED), Total Nonfarm Payrolls (PAYEMS) - https://fred.stlouisfed.org/series/PAYEMS
Federal Reserve Economic Data (FRED), Unemployment Rate (UNRATE) - https://fred.stlouisfed.org/series/UNRATE
Federal Reserve Economic Data (FRED), Labor Force Participation Rate (CIVPART) - https://fred.stlouisfed.org/series/CIVPART
Federal Reserve Economic Data (FRED), U-6 Underemployment Rate (U6RATE) - https://fred.stlouisfed.org/series/U6RATE
Federal Reserve Economic Data (FRED), Civilian Labor Force Level (CLF16OV) - https://fred.stlouisfed.org/series/CLF16OV
Federal Reserve Economic Data (FRED), Employment Level (CE16OV) - https://fred.stlouisfed.org/series/CE16OV
Federal Reserve Economic Data (FRED), Not in Labor Force (LNS15000000) - https://fred.stlouisfed.org/series/LNS15000000
Federal Reserve Economic Data (FRED), Prime-Age Labor Force Participation Rate (LNS11300060) - https://fred.stlouisfed.org/series/LNS11300060
Federal Reserve Economic Data (FRED), Nonfarm Business Sector Labor Productivity (OPHNFB) - https://fred.stlouisfed.org/series/OPHNFB
Federal Reserve Economic Data (FRED), Nonfarm Business Sector Hours Worked (HOANBS) - https://fred.stlouisfed.org/series/HOANBS
Federal Reserve Economic Data (FRED), S&P 500 (SP500) - https://fred.stlouisfed.org/series/SP500
Yahoo Finance, “US jobs report July 2026: Payrolls fell 23,000” - https://finance.yahoo.com/economy/articles/u-payrolls-fell-23-000-123501443.html
Yahoo Finance, “Soft July jobs report fuels skepticism over possible Fed rate hike” - https://finance.yahoo.com/economy/policy/articles/soft-july-jobs-report-fuels-130642877.html
Fox Business, “July 2026 jobs report: US economy unexpectedly shed jobs” - https://www.foxbusiness.com/economy/us-jobs-report-july-2026
CNBC, “Jobs report July 2026” - https://www.cnbc.com/2026/08/07/jobs-report-july-2026.html
CNN, “The US economy unexpectedly lost 23,000 jobs last month” - https://www.cnn.com/2026/08/07/economy/us-jobs-report-july
Quartz, “U.S. payrolls fell 23,000 in July 2026, first drop in months” - https://qz.com/us-payrolls-july-2026-jobs-report-080726
Indeed Hiring Lab, “July 2026 Jobs Report: Unexpected Turbulence” - https://www.hiringlab.org/2026/08/07/july-2026-jobs-report-unexpected-turbulence/
Indeed Hiring Lab, “July 2026 FOMC Reaction: The Labor Market Plays Second Fiddle” - https://www.hiringlab.org/2026/07/29/july-2026-fomc-reaction-the-labor-market-plays-second-fiddle/
Indeed Hiring Lab, “A Shifting Pipeline: What Indeed’s Data Reveals About Immigrants’ Role in the US Labor Force” - https://www.hiringlab.org/2026/05/21/immigrants-role-in-the-us-labor-force/
Skift, “Leisure and Hospitality Leads U.S. Job Growth on World Cup Boost” - https://skift.com/2026/06/05/hospitality-leisure-job-gains-may-2026/
Fortune, “Labor force participation falls to 61.5%, the lowest in 50 years outside COVID” - https://fortune.com/2026/07/08/labor-force-participation-61-5-lowest-50-years-supply-jobs-available/
Trading Economics, United States Labor Force Participation Rate - https://tradingeconomics.com/united-states/labor-force-participation-rate
Trading Economics, United States Unemployment Rate - https://tradingeconomics.com/united-states/unemployment-rate
Trading Economics, United States Inflation Rate - https://tradingeconomics.com/united-states/inflation-cpi
Trading Economics, United States Non Farm Payrolls - https://tradingeconomics.com/united-states/non-farm-payrolls
CNBC, “Fed rate decision July 2026: Divided Fed holds interest rates steady” - https://www.cnbc.com/2026/07/29/fed-rate-decision-july-2026.html
Federal Reserve Bank of Dallas, “The Impact of the 2026 Iran War on U.S. Inflation: A Scenario Analysis” - https://www.dallasfed.org/research/papers/2026/wp2609
Economic Policy Institute, “The U.S.-born labor force will shrink over the next decade” - https://www.epi.org/publication/the-u-s-born-labor-force-will-shrink-over-the-next-decade-achieving-historically-normal-gdp-growth-rates-will-be-impossible-unless-immigration-flows-are-sustained/