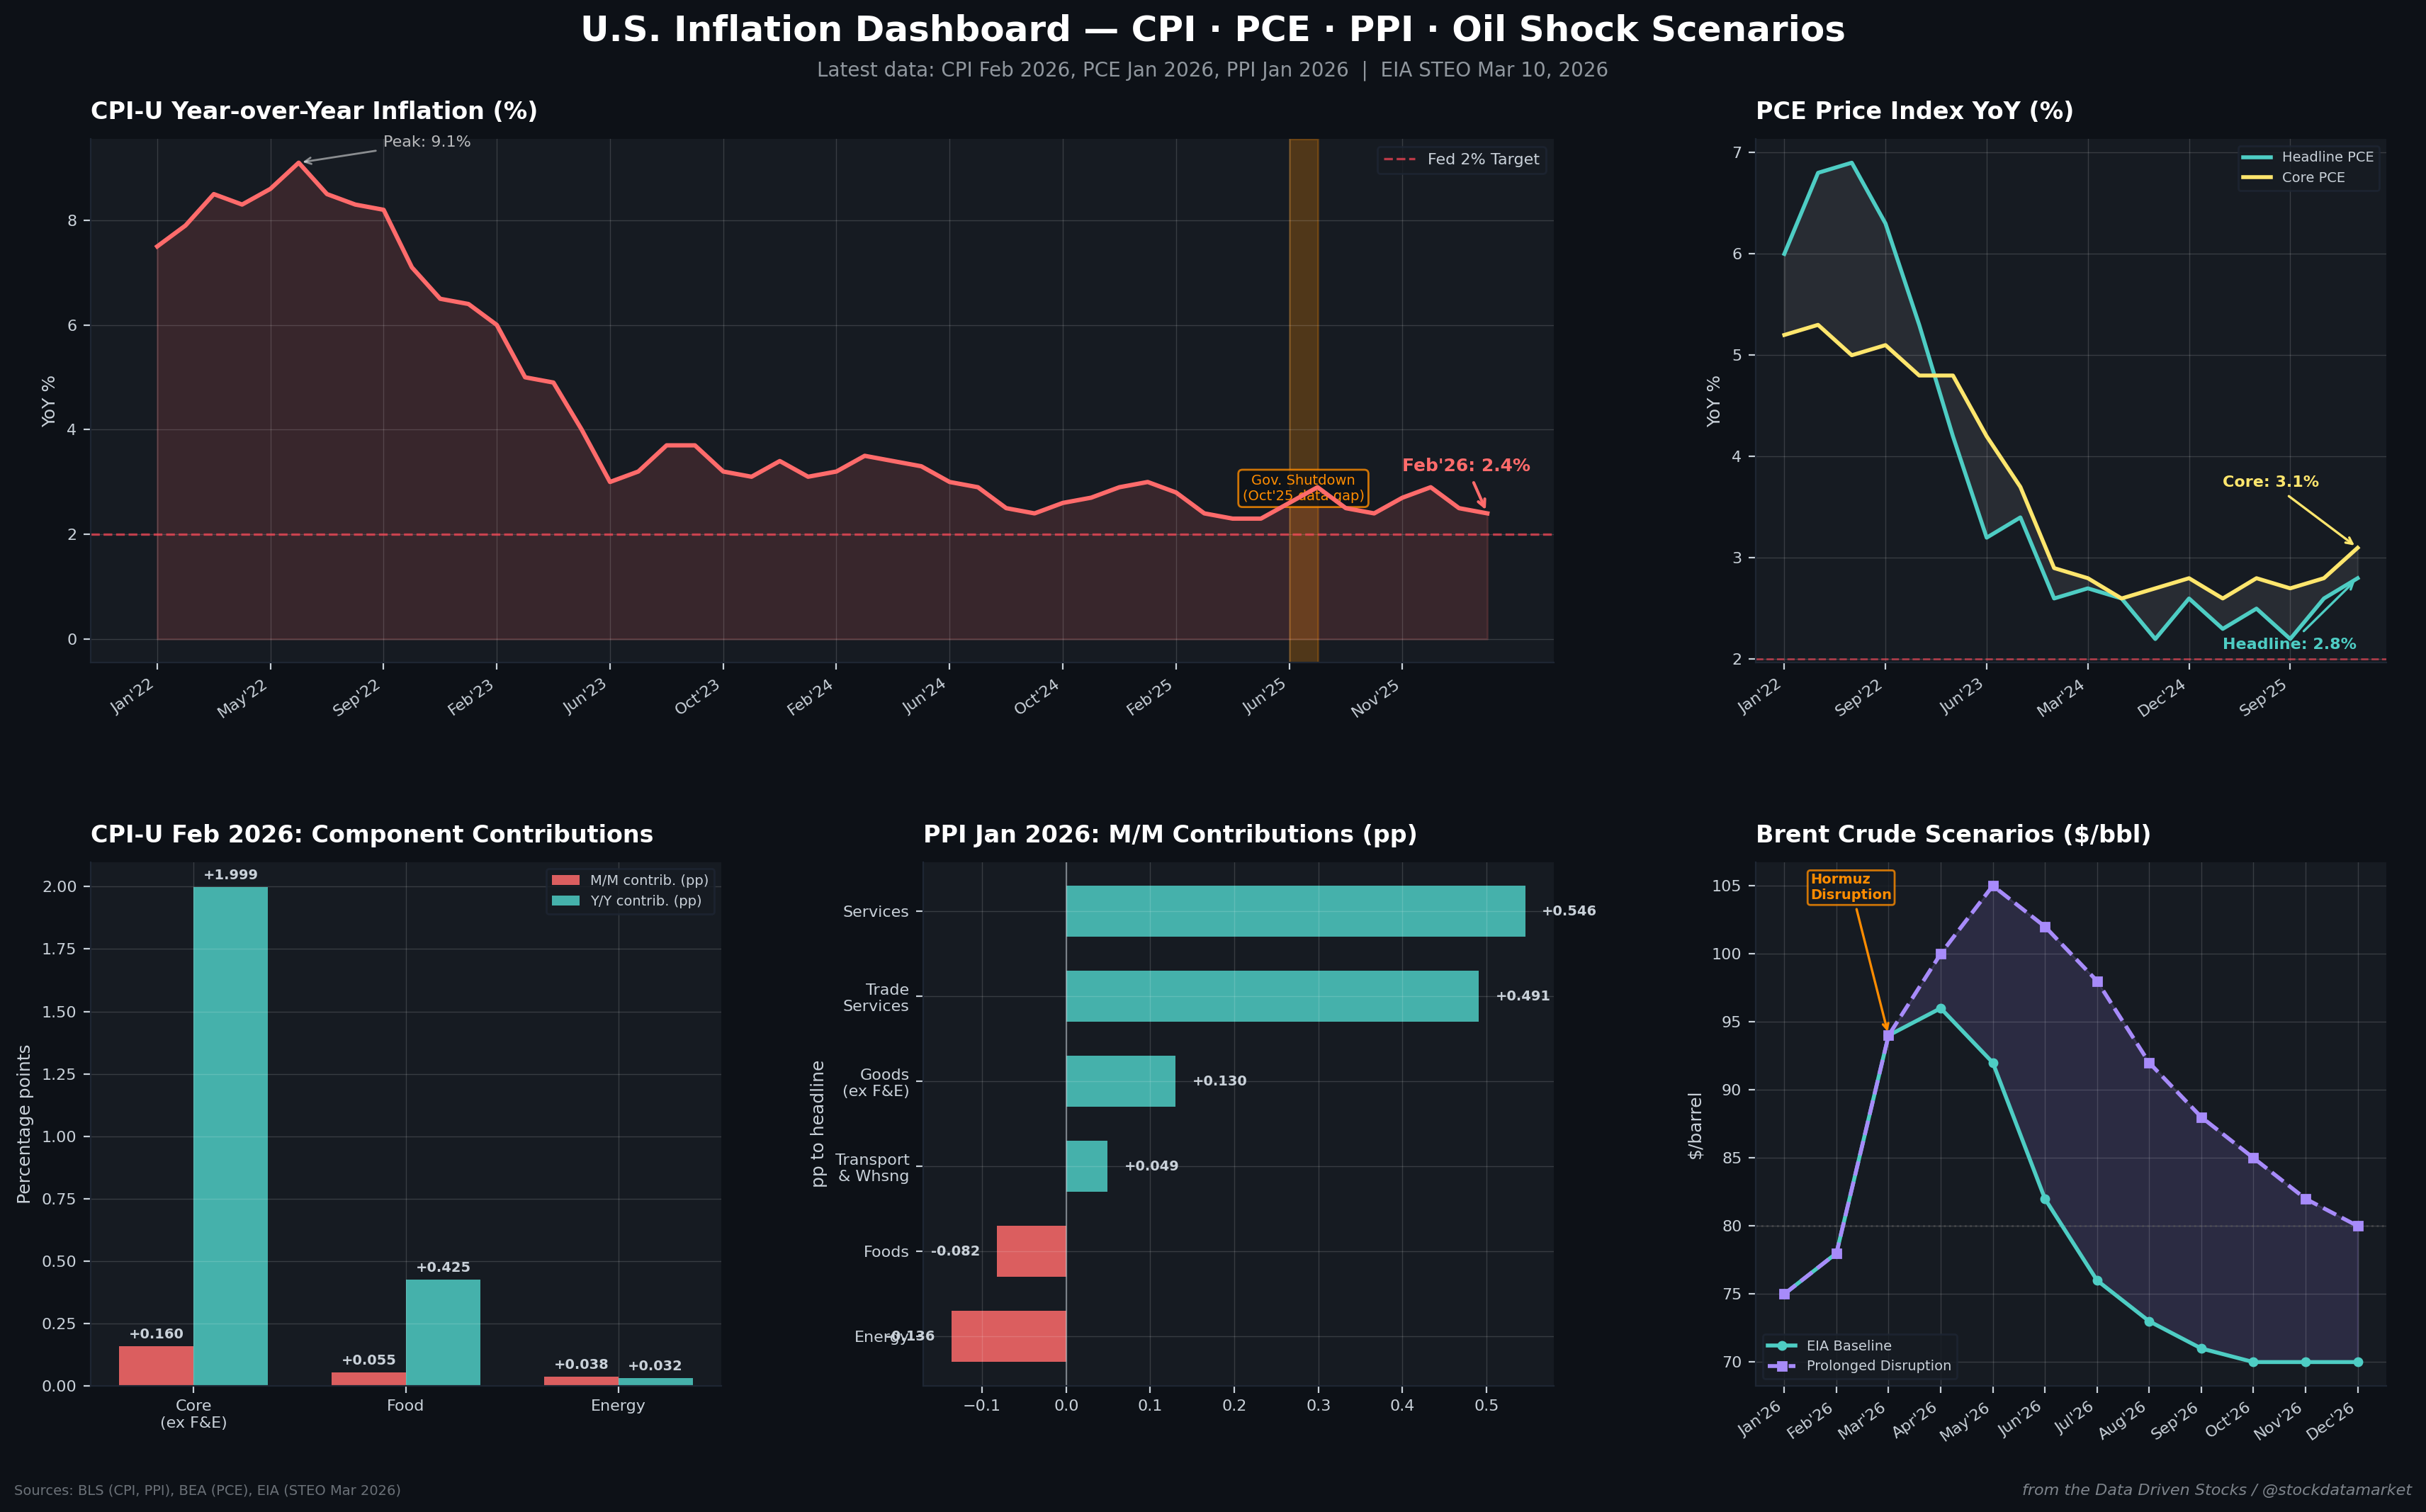
2026 — Is U.S. Inflation Shrinking or Growing? Rather Accelerating!
Analysis of the latest CPI, PCE, and PPI releases — plus what the Iran-oil shock means for the next twelve months.

You know that feeling when you think a fever is breaking, and then the thermometer ticks back up? That is exactly where U.S. inflation stands in March 2026. For months, the narrative was “mission almost accomplished.” CPI was trending toward 2%. Core PCE was flirting with levels the Fed could live with. And then — almost overnight — the numbers started moving in the wrong direction.
The headline CPI reading for February 2026 came in at 2.4% year-over-year, which sounds tame enough on its own. But if you zoom into the monthly mechanics, the picture gets uncomfortable fast. Core PCE for January 2026 printed at 3.1% year-over-year — the highest level in a year and a full percentage point above the Fed’s target. PPI final demand is running at 2.9% year-over-year, with services margins swelling. And now, a military escalation in the Middle East has sent Brent crude above $94 a barrel, injecting a brand-new energy price shock into an economy whose underlying inflation was already proving stubbornly sticky.
This isn’t the 9.1% CPI world of June 2022. But it isn’t the smooth glide-path to 2% that markets priced in either. Let’s dig into the data.
The Numbers on the Table
As of the March 13, 2026 cutoff, here’s what we’re working with. The Bureau of Labor Statistics released February 2026 CPI data on March 11, showing headline CPI-U at +0.3% month-over-month (seasonally adjusted) and +2.4% year-over-year. “All items less food and energy” — the so-called core — printed +0.2% month-over-month and +2.5% year-over-year. Food rose 0.4% on the month and is running at 3.1% annually, a pace that has been quietly accelerating for most of 2025. Energy popped 0.6% month-over-month but remains modest at just 0.5% year-over-year, reflecting last year’s soft base.
On the producer side, the January 2026 PPI final demand release (published February 27) showed +0.5% month-over-month and +2.9% year-over-year. That monthly gain was overwhelmingly a services story: final demand services surged 0.8% on the month while goods actually fell 0.3%.
And the Fed’s preferred gauge — the PCE price index, released by the Bureau of Economic Analysis on March 13 — showed headline inflation at +0.3% month-over-month and +2.8% year-over-year for January 2026. Core PCE, which strips out food and energy, rose a hot +0.4% month-over-month and +3.1% year-over-year. That 0.4% monthly core print, annualized, translates to a nearly 4.8% pace — and that is alarming.
Before we go further, one critical data caveat: the October–November 2025 federal government shutdown created a genuine black hole in the statistics. BLS did not issue an October 2025 CPI or PPI news release. The data simply does not exist. BEA rescheduled its PCE releases. This means any “month-by-month trend” analysis across late 2025 has a gap in it that makes smooth comparisons difficult and creates base-effect distortions that ripple into 2026 readings.
CPI: Shelter and Services Keep the Floor Firm

The February 2026 CPI release told a now-familiar story: services are the engine of underlying inflation, and shelter is the single largest contributor. Shelter carries a weight of about 35.6% in the CPI basket, and even at a “modest” +0.2% month-over-month reading, it contributed roughly 0.071 percentage points to the headline monthly gain. On a year-over-year basis, shelter at 3.0% contributed about 1.07 percentage points to the 2.4% headline — meaning shelter alone accounts for nearly half of total inflation.
Core services excluding energy services — the category that reflects labor-intensive, demand-sensitive pricing — came in at +0.3% month-over-month and 2.9% year-over-year, with a weight of about 60.8%. That one component contributed roughly 1.76 percentage points to the 2.4% annual headline. In plain English: if you subtract services inflation, there is barely any inflation left.
But here’s the shift that many commentators are missing. Core goods — commodities less food and energy — are no longer a disinflationary drag. Through most of 2024, core goods ran negative year-over-year, acting as a relief valve that helped pull headline CPI down even as services remained elevated. That relief valve has shut. Core goods are now printing +1.0% year-over-year and +0.1% month-over-month in February 2026. The weight is about 19.2%, so the contribution is still small in absolute terms (roughly +0.19 pp to headline annual CPI), but the direction matters. Going from a drag of negative 0.5–1.0% to a positive 1.0% in the span of a year removes a significant source of disinflationary offset.
Food inflation deserves a mention as well. At 3.1% year-over-year and with a 13.7% weight, food is contributing roughly 0.42 percentage points to headline CPI — more than energy. Grocery prices, in particular, have been grinding higher throughout 2025, and the acceleration into early 2026 is being felt by consumers in a way that shapes sentiment well beyond what the headline number suggests.
PCE: The Fed’s Preferred Measure Is Flashing Red

If CPI is the number that grabs newspaper headlines, PCE is the number that keeps Fed governors awake at night. And the January 2026 PCE release is a wake-up call.
The headline PCE price index rose 0.3% month-over-month, which sounds benign. But the expenditure-share decomposition reveals what drove that number. Core PCE (excluding food and energy) — with a spending share of roughly 89% — rose 0.364% on the month, contributing about +0.324 percentage points to the headline. Food contributed a modest +0.017 pp. And energy actually subtracted about 0.064 pp as energy prices fell in January. So the headline 0.3% gain was entirely about underlying services and goods-ex-energy inflation running hot, partially masked by an energy decline that has since reversed.
The year-over-year picture is even more telling. Core PCE printed 3.1% — up from 2.8% in Q4 2025, which was itself up from the 2.6% trough in mid-2025. That January 2026 reading is the highest core PCE annual rate since early 2024. It represents a clear break above the 2.6–2.8% range that core PCE had been oscillating in for nearly two years.
The 3-month annualized momentum tells the same story with more urgency. Core PCE on a 3-month annualized basis surged to approximately 4.8% in January 2026, up from a sub-2.5% pace in mid-2025. Headline PCE momentum similarly re-accelerated to about 3.6% annualized. This is not a statistical quirk or a base-effect story. This is genuine re-acceleration in the underlying price level.
Why does this matter so much? Because the Fed has repeatedly emphasized that it watches core PCE as its primary inflation gauge for policy decisions. A move from 2.8% to 3.1% year-over-year — with monthly momentum running at nearly 5% annualized — fundamentally changes the calculus for rate cuts. The market had been pricing multiple cuts in 2026; the January PCE data suggests the Fed will have to wait considerably longer, and may even need to reconsider its stance entirely if the trend persists.
The goods-versus-services breakdown in PCE mirrors what we see in CPI. Services — about $14,964 billion of the $21,537 billion total PCE (roughly 69.5%) — showed meaningful month-over-month price gains, while goods were essentially flat. The services-driven nature of this inflation cycle has not changed; if anything, it has intensified.
PPI: The Pipeline Is Not Clearing

Producer prices are often treated as a leading indicator for consumer inflation, though the relationship is noisy and the pass-through varies by sector. That said, the January 2026 PPI data paints a picture that is broadly consistent with the CPI and PCE stories.
PPI final demand rose 0.5% month-over-month, a pace that was entirely driven by services. Final demand services surged 0.8% on the month — contributing about +0.546 percentage points — while final demand goods declined 0.3%, subtracting about 0.087 pp. When you decompose the services side further, the picture becomes even more striking. Trade services (essentially wholesale and retail margins) jumped 2.5% on the month, contributing +0.491 pp all by themselves. That single sub-component — trade margins — accounted for nearly the entire headline PPI increase.
On a year-over-year basis, PPI headline stands at 2.9%. Services contribute about 2.32 pp of that, goods contribute 0.47 pp. The “core-like” PPI measure excluding foods, energy, and trade services is running at 3.4% year-over-year — a pace that is well above anything consistent with downstream consumer price stability at 2%.
What does this mean for the inflation outlook? PPI services inflation at 3.4% year-over-year reflects margin pressure and cost conditions that will eventually flow into consumer prices. When trade margins are widening at the producer level, that means retailers and wholesalers are passing costs along — and possibly then some. When non-trade, non-transport services PPI is running at 3.2% year-over-year, that reflects underlying cost pressures in healthcare, financial services, and other categories that feed directly into PCE.
The pipeline is not clearing. If PPI services were decelerating rapidly, we could expect consumer services inflation to eventually follow. Instead, PPI services have re-accelerated from a 2.6% year-over-year trough in Q3 2025 to 3.4% in January 2026. That is a pipeline that is building pressure, not releasing it.
The Iran War Wild Card: Oil, Energy, and the Inflation Forecast

And then there is the elephant in the room. The EIA’s Short-Term Energy Outlook, released March 10, 2026, explicitly attributes the recent surge in Brent crude to military action in the Middle East, reduced shipments through the Strait of Hormuz, and shut-in production in the region. Brent settled at $94 per barrel on March 9 — roughly 50% above where it started the year.
EIA’s baseline scenario assumes Brent remains above $95/barrel for approximately two months, then falls below $80 in Q3 2026 and toward $70 by year-end, as transit through Hormuz gradually resumes and shut-in production comes back. But this baseline is heavily assumption-dependent. If the Strait of Hormuz disruption persists longer than EIA models, or if production outages deepen, Brent could stay above $90 well into the second half of 2026.
The mechanical arithmetic is straightforward. One barrel equals 42 gallons, so a +$30/barrel shock translates to about +71.4 cents per gallon in crude-equivalent terms. Empirical evidence from Borenstein and Cameron’s classic research shows that U.S. retail gasoline prices adjust to upward crude shocks within approximately four weeks — the “fast-up” side of the well-documented asymmetric pass-through (downward shocks take roughly eight weeks to fully pass through). The IMF’s cross-country evidence concentrates the oil-to-retail-fuel effect in the same month and the following month, diminishing within about two months.
For CPI, the energy components (gasoline, utility gas, fuel oil) will pick up this shock first, moving headline CPI higher even if core remains unchanged. With energy carrying a weight of about 6.3% in CPI, a sustained $30/barrel shock could add approximately 0.3–0.5 percentage points to headline CPI year-over-year at peak, depending on the price path and duration.
Critically, the February 2026 CPI and January 2026 PCE data — the numbers we’ve been analyzing above — largely predate the strongest phase of the oil spike described in EIA’s March 2026 narrative. The Iran-war-driven energy inflation impulse will show up primarily in the March, April, and May 2026 releases. That means the current readings, which already show re-acceleration, do not yet include the oil shock. The worst is ahead, not behind.
Modeling the Near-Term Outlook: Two Scenarios

Based on the data in hand and the EIA’s oil price paths, we can construct two inflation scenarios for the remainder of 2026.
Scenario 1: EIA Baseline. This assumes Brent follows the EIA’s central path — above $95 for roughly two months, falling below $80 by Q3 and toward $70 by year-end. Under this scenario, headline CPI year-over-year likely rises from the current 2.4% to approximately 2.8–3.1% by mid-2026 as the energy impulse works through the system, then falls back toward 2.3% by December as oil prices retreat and base effects normalize. Core PCE would likely remain in the 2.8–3.0% range through mid-year, potentially easing toward 2.7% by Q4 if services inflation moderates. This is the “optimistic” scenario, and even it involves headline CPI touching 3% again.
Scenario 2: Prolonged Hormuz Disruption. If the Strait of Hormuz remains effectively closed longer than EIA assumes — say, through most of Q3 2026 — and Brent stays above $90 for four to five months, the inflation arithmetic changes significantly. Headline CPI could peak near 3.7–3.9% year-over-year by June 2026 and remain above 3% through Q3. More importantly, a prolonged energy shock increases the risk of second-round effects — where higher transportation, shipping, and energy input costs begin leaking into core services pricing and freight-sensitive goods categories. Under this scenario, core PCE might push toward 3.3–3.5% by mid-year, effectively reversing two years of disinflation progress and putting the Fed in an extremely uncomfortable position.
The bottom panel of the forecast chart illustrates why energy is the swing factor. Core and food contributions are roughly similar across both scenarios — running at about 0.15–0.18 pp and 0.05 pp per month respectively. The entire difference between a “manageable” 2026 inflation path and a “problematic” one comes from the energy component, which ranges from a small positive contribution in the baseline to a 0.4–0.5 pp monthly contribution at peak in the shock scenario.
Short-Term vs Long-Term: What the Data Actually Says
Let me give you the honest answer to the question in the title.
In the short term — the next three to six months — U.S. inflation is re-accelerating, not shrinking. The January 2026 core PCE reading of 3.1% year-over-year is not noise. The 3-month annualized pace of nearly 4.8% is not noise. Services inflation remains structurally elevated. Core goods have stopped helping. Food is getting worse. And a major energy supply shock is just beginning to hit the data. The March and April CPI prints will almost certainly be higher than February’s 2.4%, potentially significantly so.
In the medium term — six to twelve months — the outcome depends almost entirely on two things: how long the Hormuz disruption lasts, and whether the Fed responds by delaying or reversing rate cuts. If oil prices retreat per EIA’s baseline and the Fed holds rates steady, inflation likely settles back into the 2.3–2.5% range by late 2026. If oil stays elevated and the Fed is perceived as behind the curve, there is a meaningful risk that inflation expectations de-anchor and core measures push further above 3%.
In the long term, the structural story hasn’t changed. Shelter inflation is decelerating, slowly but consistently, from its 2023 peaks. The labor market, while still tight, is not generating the kind of wage-spiral dynamics that would embed permanently higher inflation into the system. The deflationary impulses from goods — driven by global supply chains, technology, and competitive pressure — are likely to reassert themselves once the current trade-margin squeeze passes.
But here is what the data says today: inflation is not done. The last mile to 2% was always going to be the hardest, and we’re not walking it anymore — we’re going backwards. The February 2026 CPI of 2.4% looks deceptively calm. Underneath it, core is running hot, services are sticky, the producer pipeline is building pressure, and an oil shock is about to land on top of all of it.
Rather accelerating, indeed.
Citations
Bureau of Labor Statistics, “Consumer Price Index — February 2026,” News Release USDL-26-0411, March 11, 2026. Available at: https://www.bls.gov/news.release/archives/cpi_03112026.htm
Bureau of Labor Statistics, CPI News Release Table 2, “Consumer Price Index for All Urban Consumers (CPI-U): U.S. city average, by expenditure category.” Available at: https://www.bls.gov/news.release/cpi.t02.htm
Bureau of Labor Statistics, “Producer Price Index — January 2026,” News Release USDL-26-0307, February 27, 2026. Available at: https://www.bls.gov/news.release/archives/ppi_02272026.htm
Bureau of Labor Statistics, PPI News Release Table 1, “Producer price index for final demand.” Available at: https://www.bls.gov/news.release/ppi.t01.htm
Bureau of Economic Analysis, “Personal Income and Outlays, January 2026,” March 13, 2026. Available at: https://www.bea.gov/news/2026/personal-income-and-outlays-january-2026
Federal Reserve Bank of St. Louis (FRED), PCE Price Index (PCEPI). Available at: https://fred.stlouisfed.org/series/PCEPI
Federal Reserve Bank of St. Louis (FRED), PCE Price Index Excluding Food and Energy (PCEPILFE). Available at: https://fred.stlouisfed.org/series/PCEPILFE
U.S. Energy Information Administration, “Short-Term Energy Outlook,” March 10, 2026. Available at: https://www.eia.gov/outlooks/steo/
Bureau of Labor Statistics, “2025 Federal Government Shutdown: Impact on CPI.” Available at: https://www.bls.gov/cpi/additional-resources/2025-federal-government-shutdown-impact-cpi.htm
Bureau of Labor Statistics, “PPI Archived News Releases.” Available at: https://www.bls.gov/bls/news-release/ppi.htm
Borenstein, S. and Cameron, A., “Do Gasoline Prices Respond Asymmetrically to Crude Oil Price Changes?” Quarterly Journal of Economics, 1997. (Empirical finding: U.S. upward pass-through completes within ~4 weeks; downward pass-through ~8 weeks.)
International Monetary Fund, research on fuel excise taxes and oil-price pass-through to retail fuel prices. (Finding: oil-price effect on retail fuel concentrated in same month and next month, diminishes within ~2 months; smaller responses in high-fuel-tax countries.)
EIA, “Gasoline and Diesel Fuel Update” and pump-price component methodology. Available at: https://www.eia.gov/petroleum/gasdiesel/
Banque de France, research using daily station-level observations (2007–2018) on wholesale-to-retail gasoline pass-through in France. (Finding: ~0.8% retail response per 1% wholesale change; full pass-through ~3 weeks.)

