2008 vs 2026: Is the U.S. Housing Market Heading for a Repeat — Or Is This Something Else Entirely?
Mortgage delinquencies, homeowner equity, subprime exposure, and metro-level divergence — the data tells a story most headlines are missing.
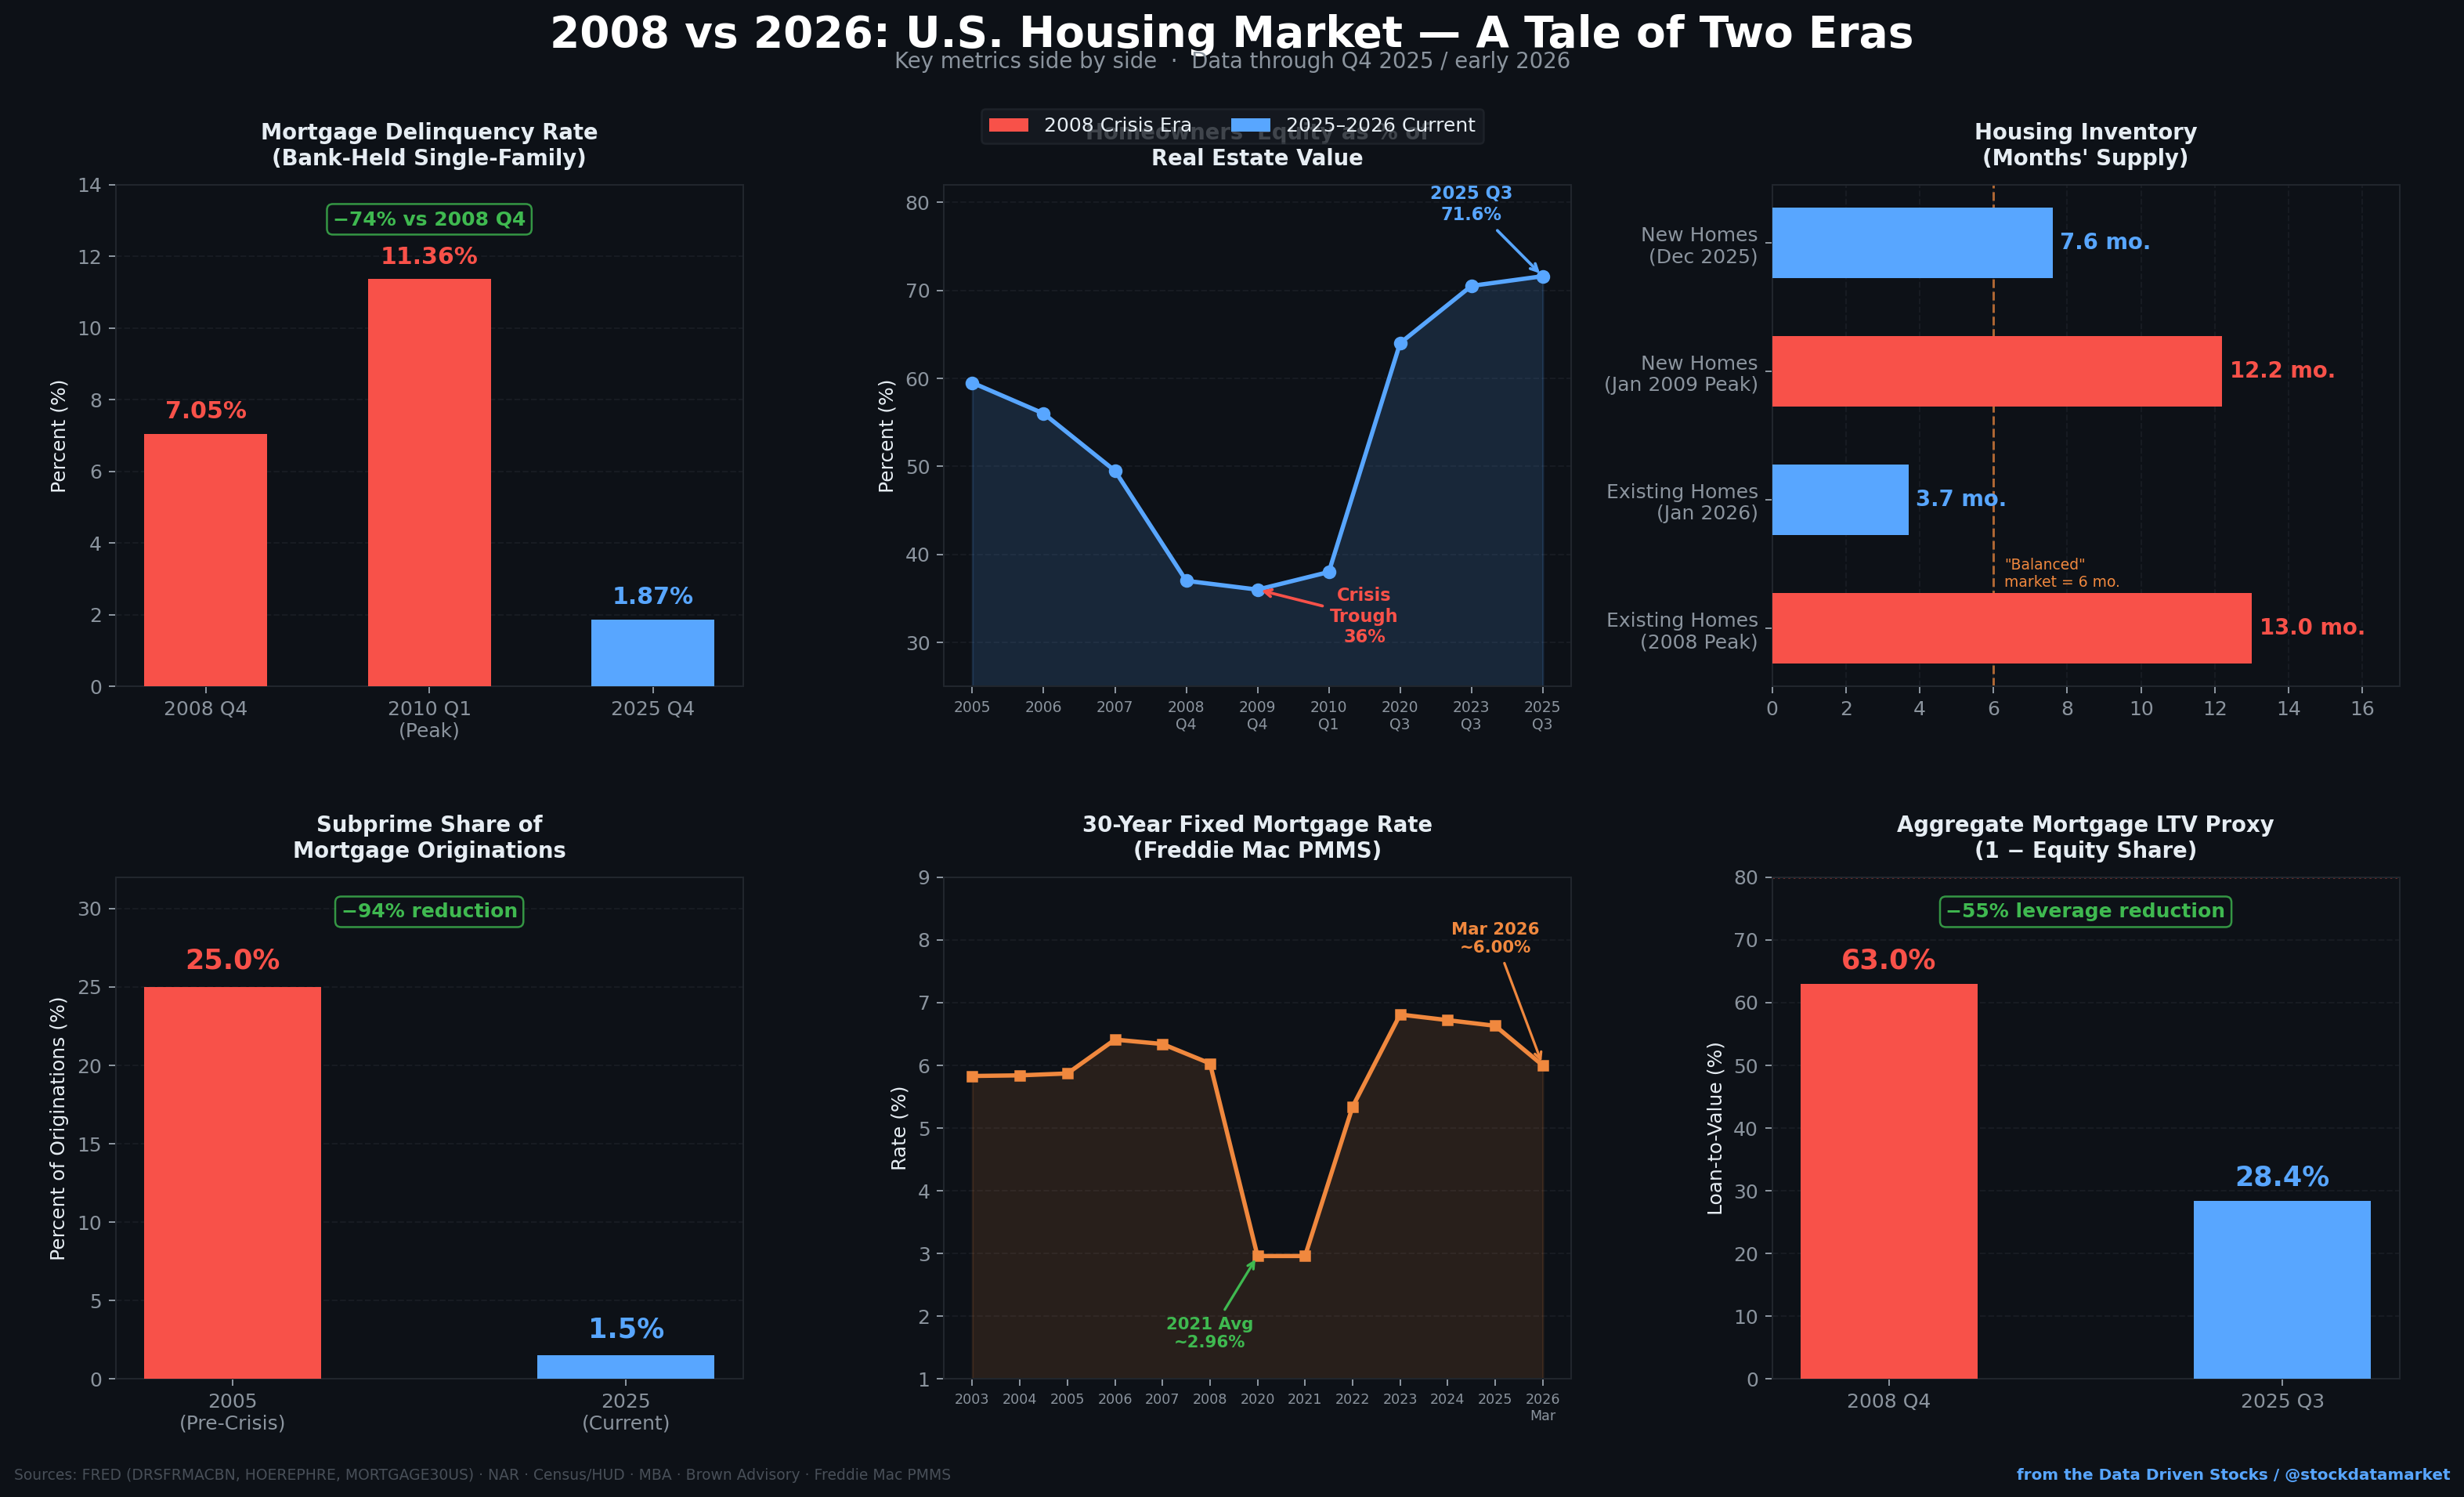
Every time the housing market sneezes, someone on FinTwit shouts “2008 all over again.” And honestly, it’s not hard to see why. Home prices are stretched, affordability is brutal, mortgage rates have been punishing for years, and now you’ve got geopolitical chaos in the Middle East pushing yields around. It feels uncomfortable.
But feelings and data are two very different animals. So we pulled the actual numbers — the same FRED series, the same MBA reports, the same Case-Shiller data that economists use — and stacked 2026 against 2008 across every metric that matters. The result? This is not your father’s housing crisis. Not even close. But that doesn’t mean there’s nothing to worry about.
Let’s walk through it.
The Headline Number: Mortgage Delinquencies Aren’t Even in the Same Zip Code
Start with the number that matters most when people ask “is it 2008 again?” — mortgage delinquency rates. The Federal Reserve tracks a series called DRSFRMACBN, which measures the delinquency rate on single-family residential mortgages held by commercial banks. It’s been running since the 1990s, it’s publicly available on FRED, and it’s the cleanest apples-to-apples comparison we’ve got.
In Q4 2008, that rate sat at 7.05%. It then kept climbing — reaching a staggering 11.36% by Q1 2010, which was the actual peak of the crisis (a nuance most people miss: the delinquency peak came two years after the Lehman collapse). Fast-forward to the latest reading we have, Q4 2025, and the rate is 1.87%. That’s roughly 74% below 2008 Q4 and about 84% below the post-crisis peak. We’re not approaching 2008 territory — we’re in a completely different dimension.

Now, does 1.87% mean everything is perfect? No. It’s worth noting that the MBA’s broader delinquency survey (which covers all servicers, not just banks) pegged the overall delinquency rate at 4.26% in Q4 2025 — higher, but still leagues below crisis territory. What’s more interesting is where the stress is concentrated.
FHA Borrowers Are Carrying the Weight
The MBA’s Q4 2025 data revealed that FHA delinquencies hit 11.52% — nearly 2.7 times the overall average of 4.26%. That’s a meaningful signal. FHA loans are designed for lower-income and lower-credit-score borrowers, and this cohort is clearly feeling the squeeze from years of elevated prices and rates. Meanwhile, conventional mortgage delinquencies remain well-behaved, and foreclosure starts held flat at just 0.20% in Q4 2025 — a rate that barely registers compared to the crisis era’s peak of around 1.42%.
So the stress is real, but it’s concentrated and segmented — a distributional problem, not a systemic one. In 2008, the rot was everywhere because the entire credit structure was poisoned. Today, the cracks are visible but contained.
The Equity Buffer: Why 2026 Homeowners Can Take a Punch
Here’s the single biggest structural difference between now and 2008, and it’s one that doesn’t get nearly enough attention: homeowner equity.
The Fed tracks a series called HOEREPHRE — homeowners’ equity as a percentage of household real estate value. In Q4 2008, when the crisis was raging, that number had cratered to roughly 37%. That meant the average American homeowner had only 37 cents of equity for every dollar of home value. Negative equity was rampant. Millions of people owed more than their homes were worth, which is exactly the condition that turns a price decline into a foreclosure cascade.

Today? That figure stands at 71.6% as of Q3 2025. Homeowners have nearly double the equity cushion they had during the crisis. The aggregate mortgage loan-to-value proxy (simply 1 minus the equity share) sits at just 28.4%, compared to 63% in 2008. This is the single most powerful stabilizer in the current market. Even if home prices dropped 10–15%, most homeowners would still have substantial equity, making strategic defaults and foreclosure spirals far less likely.
And this isn’t just about aggregate numbers. The FHFA’s National Mortgage Database shows that current loan-to-value ratios across active mortgages are around 44.2%, with down payment percentages at 21st-century highs. During the 2008 buildup, LTV ratios had crept as high as 85%, with down payments shrinking toward zero thanks to liar loans, stated-income products, and 100%-financing deals. That entire playbook has been eliminated by post-crisis regulations.
The Subprime Ghost Is Gone
Let’s talk about the elephant that isn’t in the room anymore: subprime lending. In 2005, roughly 25% of non-agency mortgage originations went to borrowers with credit scores below 640. These were the infamous “NINJA loans” — no income, no job, no assets. Lenders were packaging them into mortgage-backed securities, rating agencies were stamping them AAA, and the entire financial system was building a tower of leveraged bets on these garbage loans.
By October 2007, 16% of subprime adjustable-rate mortgages were either 90 days delinquent or in foreclosure. By May 2008, that figure hit 25%. The resulting wave of defaults didn’t just crush housing — it detonated the entire global financial system, toppling Lehman Brothers, freezing credit markets, and triggering the worst recession since the 1930s.
Today, subprime originations make up less than 1.5% of total mortgage originations. Government-backed loans (Fannie, Freddie, FHA, VA) dominate the market, and underwriting standards remain strict by historical measures. The Fed’s Senior Loan Officer Opinion Survey (SLOOS) from January 2026, covering Q4 2025 lending conditions, showed that banks reported basically unchanged residential real estate lending standards alongside weaker demand. That’s the opposite of what happened pre-2008, when standards were collapsing while demand was euphoric.
“We’re not heading toward a housing crash; we’re in a market correction defined by stability, not volatility. Today’s housing environment is fundamentally different from 2008.” — Hoby Hanna, CEO of Howard Hanna Real Estate Services
So What Does the Data Actually Show? Side by Side.
Let’s lay it all out in one place. Here’s the 2008 vs 2026 comparison across every key structural metric, using the same primary sources that economists and analysts rely on.

Metric 2008 Crisis Era 2025–2026 Verdict Bank mortgage delinquency (DRSFRMACBN) 7.05% (Q4 2008) → 11.36% peak 1.87% (Q4 2025) Far healthier Homeowner equity share ~37% (Q4 2008) 71.6% (Q3 2025) Massive buffer Aggregate mortgage LTV proxy ~63% ~28.4% 55% less leveraged Subprime share of originations ~25% (2005) <1.5% Eliminated Foreclosure start rate ~1.42% peak 0.20% (Q4 2025) 86% lower Existing-home months’ supply 13 months (peak) 3.7 months (Jan 2026) Tight, not oversupplied Case-Shiller National YoY −18.2% (Q4 2008) +1.3% (Dec 2025) Cooling, not crashing Household debt / GDP 73% (2008) 93.4% (Q3 2025) Higher — watch this 30Y mortgage rate ~6.0% (2008) ~6.0% (Mar 2026) Similar, but context differs Lending standards Collapsing (stated income, NINJA) Basically unchanged (SLOOS Q4 2025) Night and day
The one yellow flag? Household debt as a share of GDP is actually higher today (93.4%) than it was during the 2008 crisis (73%). But context matters enormously here. That 2008 figure was built on garbage credit — liar loans, no-doc loans, subprime ARMs, and leveraged CDO bets. Today’s debt is overwhelmingly fixed-rate, well-underwritten, and sitting behind a massive equity cushion. The debt is bigger, but the quality is incomparably better.
The Metro Story: Bubbles Can Burst Locally
Here’s where things get interesting — and where the “everything is fine” narrative needs some nuance. While national numbers look stable, the metro-level picture reveals a dramatic divergence that tells you a lot about where the stress really lives.

The Sun Belt metros that surged during the pandemic-era migration wave — Austin, Tampa, Dallas, Miami — are now giving back those gains. Austin is down 5.9% year-over-year as of January 2026, making it one of the clearest metro-level deflation signals in the country. Tampa is down 4.8%, Miami 4.3%, and Dallas 3.9%. These were the markets where speculative buying, investor activity, and rapid new construction created a classic mini-bubble during 2020–2022.
Meanwhile, Midwest and Northeast metros that were “boring” during the pandemic boom are outperforming. Chicago is up 4.0% YoY, New York 3.9%, and Cleveland 4.0% (per the Case-Shiller 20-City index). These markets had less speculative froth to unwind, tighter inventory to begin with, and better relative affordability.
This pattern matters because bubbles can burst locally while national indices look flat. The S&P Case-Shiller National Index showed just +1.3% YoY in December 2025, which looks like gentle cooling — but that national average is masking a 10+ percentage point spread between the best and worst performing metros. If you own a home in Austin, the bubble already burst. If you own in Chicago, you’re doing just fine.
The Wild Card: War, Yields, and What It Means for Mortgages
And then there’s the geopolitical curveball nobody had on their 2026 bingo card. On February 28, 2026, U.S. and Israeli forces launched a wave of strikes against Iran, marking the onset of a military conflict that immediately rippled through global financial markets. In the weeks since, Treasury yields have risen sharply, pulling mortgage rates up with them.

The U.S. 10-year Treasury yield moved from 3.97% on February 27 (the day before the strikes) to 4.26% by March 19. The 30-year fixed mortgage rate followed, climbing from about 5.98% pre-onset to 6.22% by mid-March. That’s a meaningful move for anyone trying to buy a home or refinance — and it came just when rates had been gradually improving.
But here’s the critical detail that gets lost in the panic: the mortgage-to-Treasury spread stayed roughly stable at about 1.96 percentage points throughout the episode. That means the rate increase was driven by higher benchmark yields (a duration and inflation repricing), not by a widening of mortgage-specific risk spreads. In 2008, by contrast, mortgage spreads blew out catastrophically as investors fled mortgage-backed securities — the spread itself was the crisis transmission mechanism. Nothing like that is happening now.
The war introduces a genuine risk to the housing outlook through an oil-price-driven inflation channel. If the conflict remains contained, rates will likely stabilize. If it escalates to sustained disruption of major shipping routes like the Strait of Hormuz, you could see a longer period of elevated rates and compressed affordability — not a credit crisis, but a demand headwind that extends the current market stall.
The Bottom Line: Different Disease, Different Symptoms
So is 2026 like 2008? The data is unambiguous: no — not on delinquencies, not on equity, not on credit quality, not on inventory, and not on the structure of mortgage lending. The 2008 crisis was a systemic credit meltdown built on fraudulent lending, excessive leverage, and a financial system that had turned housing into a derivatives casino. None of those conditions exist today.
The key structural differences in one sentence: In 2008, homeowners had 37% equity, 25% of loans were subprime, and delinquencies hit 11.36%. In 2026, homeowners have 71.6% equity, subprime is under 1.5%, and delinquencies are 1.87%. That’s not a comparison — that’s a different universe.
What 2026 does have is a different kind of problem: a grinding affordability squeeze, concentrated stress in lower-income borrower segments (particularly FHA), localized price corrections in pandemic-boom metros, and now an unexpected geopolitical shock pushing rates higher. It’s uncomfortable and it’s real — but it’s a slow deflation, not a systemic detonation.
The NAR Housing Affordability Index improved from 102.0 in January 2025 to 116.5 in January 2026, driven by wage growth and marginally lower rates. That improvement is the mechanism that prevents “slow deflation” from becoming “crash.” As long as incomes keep growing, rates don’t spike dramatically, and the labor market holds, the housing market can work through its current imbalances without the kind of catastrophic unwind we saw in 2008–2010.
The thing to watch? Jobs. If unemployment surges — due to recession, trade disruptions, or war-related economic fallout — then the concentrated stress in FHA borrowers and rate-sensitive metros could broaden. But that’s a contingent risk, not a current reality. And even in that scenario, the equity buffer and post-crisis underwriting standards provide a level of shock absorption that simply didn’t exist in 2008.
What to keep on your radar: FHA delinquencies at 11.52% are a canary in the coal mine. The Iran conflict and its impact on oil prices and yields could tighten the affordability screw further. Household debt at 93.4% of GDP is elevated even if the quality is better. And Sun Belt metro corrections may have further to run. This isn’t 2008, but it’s not a time to be complacent either.
Sources & Data
Federal Reserve Board / FRED — DRSFRMACBN (Delinquency Rate on Single-Family Residential Mortgages, All Commercial Banks): fred.stlouisfed.org/series/DRSFRMACBN
Federal Reserve Board / FRED — HOEREPHRE (Households; Owners’ Equity in Real Estate as % of Household Real Estate): fred.stlouisfed.org/series/HOEREPHRE
Freddie Mac — Primary Mortgage Market Survey (PMMS), 30-Year Fixed Rate: fred.stlouisfed.org/series/MORTGAGE30US
S&P Cotality — Case-Shiller U.S. National Home Price Index (CSUSHPINSA): fred.stlouisfed.org/series/CSUSHPINSA
National Association of REALTORS® (NAR) — Existing Home Sales, Months’ Supply, Housing Affordability Index, January 2026 release.
U.S. Census Bureau / HUD — New Residential Sales, December 2025 release.
Mortgage Bankers Association (MBA) — National Delinquency Survey, Q4 2025 (delinquency rate 4.26%, foreclosure starts 0.20%, FHA delinquency 11.52%).
Federal Reserve Board — Senior Loan Officer Opinion Survey on Bank Lending Practices (SLOOS), January 2026 (covering Q4 2025).
Zillow Research — Zillow Home Value Index (ZHVI), January 2026 market report.
Banque de France — “Debt Ratios of Institutional Sectors — International Comparisons, 2025 Q3”: banque-france.fr
FRED — DGS10 (10-Year Treasury Constant Maturity Rate, Daily): fred.stlouisfed.org/series/DGS10
Investing.com — Germany 10-Year Bond Yield Historical Data; Japan 10-Year Bond Yield Historical Data.
YCharts — UK Gilt 10-Year Yield.
AP News — “Average rate on a 30-year mortgage rises to 6.22%,” March 19, 2026: apnews.com
Investopedia — “How Much Mortgage Rates Have Climbed Since the Iran Conflict Began,” March 2026: investopedia.com
The Guardian — Live coverage: “Israel attacks Iran as blasts heard in Tehran,” February 28, 2026: theguardian.com
Brown Advisory — “The Mortgage Market: Ten Years Later”: brownadvisory.com (subprime share data).
Federal Reserve History — “Subprime Mortgage Crisis”: federalreservehistory.org
HousingWire — “How homeowners benefit from massive equity and lower fixed rates,” September 2025: housingwire.com
BIS — Selected Property Prices, Q3 2025 (global real house prices −0.7% YoY, nominal +2%).
Disclaimer: This article is for educational and informational purposes only. It does not constitute financial advice. Past performance is not indicative of future results. The author and Data Driven Stocks / @stockdatamarket are not financial advisors. Always conduct your own research and consult with a licensed financial professional before making investment decisions.

