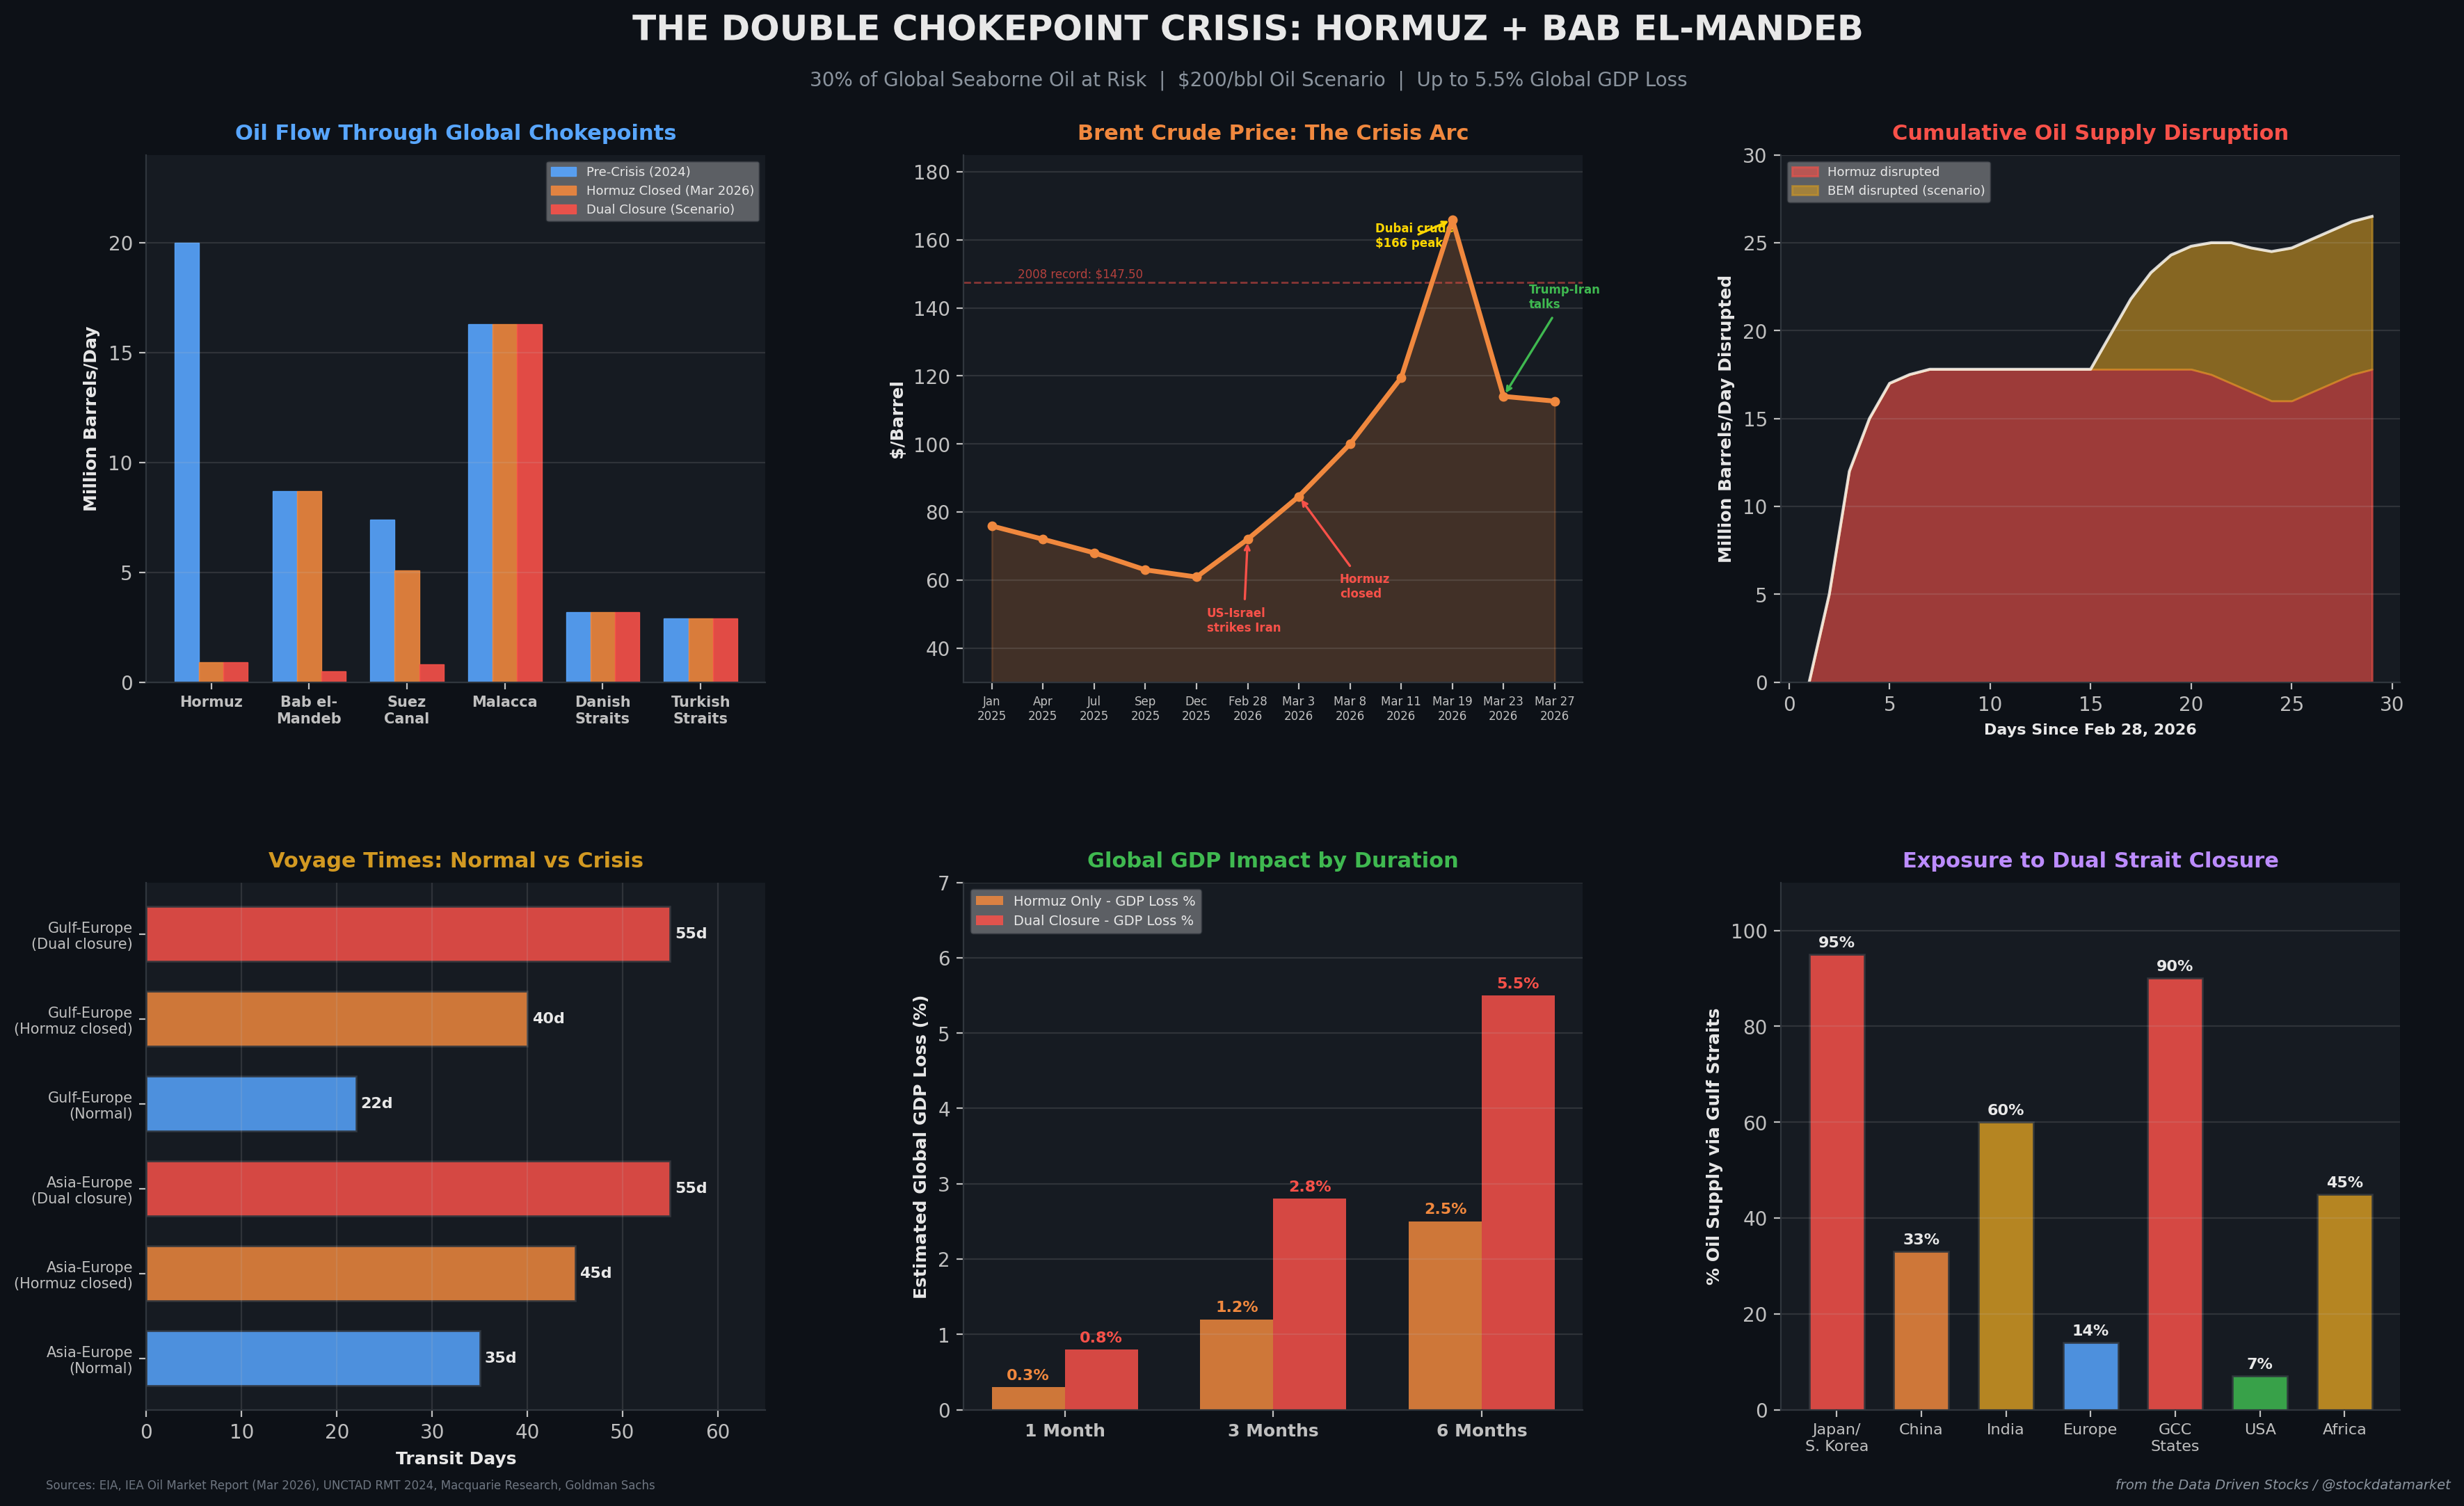
$200 Oil Is Not a Fantasy: What Happens When Both Hormuz and Bab el-Mandeb Close at the Same Time
Iran controls Hormuz. Its proxies control Bab el-Mandeb. Together, that's 30% of the world's seaborne oil - and the global economy has no backup plan.

For the first time in modern history, the Strait of Hormuz is effectively closed. Nearly 20 million barrels of oil per day - roughly 20% of global petroleum consumption - has been choked off since Iranian forces declared the strait shut on March 4, 2026. Brent crude has already spiked to $166 at its peak. The IEA has called it the largest supply disruption in the history of the global oil market.
But there is a second shoe waiting to drop. And it involves a narrow waterway 1,500 miles to the south that most people have never heard of.
The Bab el-Mandeb Strait - a 20-kilometer-wide chokepoint between Yemen and Djibouti - carries another 8.7 million barrels per day of oil and roughly 30% of all global container traffic. It is controlled, in practice, by Iran’s most capable proxy: Yemen’s Houthi rebels. If Tehran gives the order and the Houthis shut this strait too, the world faces a dual-chokepoint crisis that would sever the Gulf’s energy exports end to end. No oil out via Hormuz. No oil out via the Red Sea. Total energy lockout.
Macquarie Group warned on March 27 that oil could hit $200 per barrel if the conflict drags through June - assigning a 40% probability to that scenario. Goldman Sachs says the global system has shifted from “buffered to fragile.” And the IEA’s head, Fatih Birol, has said this is worse than the 1970s oil shocks and the Russia-Ukraine energy war combined.
This is the data-driven breakdown of what a dual closure actually looks like.
The Iran Connection: Why These Two Straits Are Linked
To understand why the Bab el-Mandeb is inseparable from the Hormuz crisis, you have to understand Iran’s strategic architecture in the region. Tehran does not need to physically control both straits. It just needs to project enough threat to make commercial transit unviable.

At Hormuz, Iran’s Islamic Revolutionary Guard Corps (IRGC) Navy operates directly. It controls the northern Iranian coastline, has deployed mines, anti-ship missiles, and fast attack boats, and has now established what analysts call a “toll booth” around Larak Island - a few miles off Iran’s coast - where ships reportedly paid up to $2 million each for “safe passage” in the second half of March. Lloyd’s List tracked 33 vessel transits via this Larak route, but zero through the normal southern channel.
At Bab el-Mandeb, the instrument is the Houthis. Since 2014, this Iran-backed group has controlled large portions of Yemen’s territory along the Red Sea coastline. Between 2023 and 2025, the Houthis demonstrated exactly what they could do: using drones, cruise missiles, and explosive boats, they attacked dozens of commercial vessels, sank multiple ships, and made the Red Sea commercially unattractive for major carriers. Maersk, Hapag-Lloyd, and CMA CGM all paused Red Sea sailings at various points during that period. Insurance premiums surged from around 0.07% of vessel value to 0.7% during the Red Sea crisis - a tenfold increase. Transit times lengthened by 10-15 days as ships rerouted around Africa’s Cape of Good Hope.
The Houthis have not yet entered the current 2026 war. But their leadership has publicly declared that their “fingers are on the trigger” and that closing Bab el-Mandeb is a “primary option” to support Tehran. Houthi leader Abdul-Malik al-Houthi has confirmed coordination with Iran. A senior Houthi official told Reuters that the group “remains fully militarily ready with all options.” The Times reported on March 16 that the Houthis are awaiting an Iranian signal to resume attacks if U.S. military actions weaken Iran’s control of Hormuz.
Here is the critical link that makes this a cascading crisis: when Hormuz closed, Saudi Arabia scrambled to reroute its oil exports via the East-West Pipeline to the Red Sea port of Yanbu. Right now, roughly 30 tankers loaded with Saudi crude are sitting near Yanbu - within Houthi strike range. If the Houthis close Bab el-Mandeb, that backup route is also severed. The kingdom’s last viable maritime export corridor goes dark.
An Iranian military source told the state-run Tasnim News Agency this week: “The Bab al-Mandab Strait is one of the strategic straits in the world, and Iran has both the will and the possibility to produce a completely credible threat against it.”
The Numbers: How Much Oil Flows Through These Two Straits
Let’s get specific about the volumes at stake.

The Strait of Hormuz averaged 20 million barrels per day of crude oil and petroleum products in 2024, according to the U.S. Energy Information Administration. That represented approximately 27% of all global maritime oil trade and about 20% of world petroleum consumption. Saudi Arabia alone moved 5.5 million barrels per day of crude through Hormuz in 2024 - 38% of all strait flows. China, India, Japan, and South Korea received 69% of all crude transiting Hormuz. Additionally, about 20% of global liquefied natural gas trade - primarily from Qatar - transits the same waterway.
Bab el-Mandeb handled approximately 8.7 million barrels per day by 2023, according to the EIA, up from 6.2 million barrels per day in 2018. UNCTAD’s 2024 Review of Maritime Transport estimates that BEM carried roughly 8.7% of global seaborne trade by weight, including 13% of global crude oil and 15% of oil products trade. The strait also serves as the gateway for approximately 30% of global container traffic heading to or from the Suez Canal. Between 60 and 70 vessels transit BEM daily under normal conditions, or roughly 1,100-1,300 per month.
Add the two together, and a dual closure would halt roughly 28-29 million barrels per day of oil flow - approximately 30% of all seaborne oil trade on the planet.
There Is No Plan B: The Pipeline Problem
When Hormuz closed, the world’s immediate response was to look at pipeline bypass alternatives. Three major pipelines can theoretically reroute some oil around the Strait of Hormuz. But the math does not add up.

Saudi Aramco’s East-West Pipeline has a maximum capacity of about 7 million barrels per day and runs from the eastern oil fields to the Red Sea port of Yanbu. Before the crisis, it was pushing roughly 770,000 barrels per day. By late March 2026, Saudi Arabia had ramped that up to about 2.9 million barrels per day, according to Kpler data. The UAE’s Abu Dhabi Crude Oil Pipeline links onshore fields to the port of Fujairah on the Gulf of Oman, with a capacity of about 1.5 million barrels per day. The Iraq-Turkey Kirkuk-Ceyhan Pipeline reaches the Mediterranean coast of Turkey with a capacity of 1.6 million barrels per day, though it currently carries only around 200,000 barrels per day.
Combined maximum bypass capacity: roughly 9 million barrels per day. That covers less than half of the 20 million barrels per day that normally transits Hormuz. Five countries - Iraq, Kuwait, Qatar, Bahrain, and Iran itself - have zero bypass infrastructure whatsoever. An estimated 14 million barrels per day are physically locked to passage through Hormuz.
And here is where the dual closure scenario becomes truly catastrophic: even the bypass oil that reaches Yanbu still needs to transit through the Red Sea and past the Bab el-Mandeb Strait to reach global markets. If the Houthis close BEM, the East-West Pipeline’s entire output is effectively stranded at Yanbu. Saudi Arabia’s last escape valve gets shut off.
The Congressional Research Service put it plainly in its March 2026 report: the Red Sea route is “vulnerable to potential attacks by the Houthis,” and the combined capacity of bypass pipelines “is unable to match the amount of oil shipped through the strait.”
Oil Prices: From $61 to $166 - and the $200 Scenario
The price action since February 28 has been historic by any measure.

Brent crude ended 2025 at approximately $60.92 per barrel. When U.S. and Israeli strikes hit Iran on February 28, 2026, prices immediately began climbing. By March 3, Brent had hit $84.57 - a 19-month high. On March 5, it reached $82.31. Then the acceleration began. On March 8, Brent surged past $100 for the first time in four years. By March 9, it touched $119.50 intraday. On March 11, the IEA’s 32 member states unanimously agreed to release a record 400 million barrels from strategic reserves - roughly four days of global consumption.
The peak came on March 19 when Dubai crude prices hit $166 per barrel - their highest on record. Brent came back down after President Trump signaled U.S.-Iran negotiations on March 23, falling from $114 to $102 in a single session. As of March 27, Brent closed at $112.57, with WTI at $99.64 - both their highest since July 2022.
Goldman Sachs has warned that if Hormuz flows remain at 5% of normal for 10 weeks, daily Brent prices will likely exceed their 2008 record of $147.50. Macquarie’s March 27 research note outlines a 40% probability scenario where the conflict persists through Q2 2026, pushing oil to $200 per barrel - a price never seen in history. At that level, energy expenditures would approach 5-6% of global GDP, which Macquarie describes as “particularly harmful” territory.
For context, options contracts betting on $150 oil by late April have increased tenfold in value. The market is actively pricing in a scenario that would break every record in the history of crude oil.
Shipping Costs: The 3.4x Multiplier
Oil is the headline, but the broader shipping cost explosion affects everything that moves by sea - which is roughly 80% of global trade by volume.

Under normal conditions, shipping a 40-foot container on major Asia-Europe routes costs roughly $1,800-$2,150. War-risk surcharges imposed by carriers like MSC during Red Sea disruptions added $2,000-$3,000 per container. The Cape of Good Hope reroute adds approximately $1,200 in additional fuel costs per container. Insurance premiums rose from 0.7% to 1.0% of ship value during the initial Hormuz closure - for a $100 million vessel, that is an extra $300,000 per voyage.
Under a dual closure scenario, total container shipping costs could reach $7,000-$7,500 per box - a 3.4x increase from pre-crisis levels. BCG estimated during the Red Sea disruptions that spot freight rates on affected lanes tripled. The Coface credit insurance group has emphasized the “domino effect”: 12-15 extra days of sailing per voyage, war-risk insurance premiums, and port congestion downstream that compounds delays.
Transit times from Asia to Europe would stretch from approximately 35 days via Suez to 45-55 days via the Cape of Good Hope - an addition of 10-20 days per voyage. A European Parliament study confirmed that the Cape detour adds 10-14 days. For just-in-time supply chains - which have become the backbone of modern manufacturing and retail - this is devastating. Every extra day on route for a VLCC tanker costs an estimated $30,000-$60,000 in fuel alone.
Iran itself has created an extraordinary additional cost: the Larak Island toll. Ships seeking to transit Hormuz via Iran’s northern channel have been charged up to $2 million per vessel, effectively turning the strait into a revenue extraction point for a sanctioned state.
Modeling the GDP Impact: How Bad Could It Get?
This is where the scenarios get genuinely alarming. There is no direct historical precedent for a simultaneous closure of both Hormuz and Bab el-Mandeb, so we have to model the impact by scaling from existing research and data.

A Nature Communications study by Verschuur et al. (2025) estimated that chokepoint disruptions cause approximately $10.7 billion per year in trade delays and $3.4 billion per year in extra freight costs under normal disruption patterns. The same study found an annual expected trade loss of approximately $192 billion from rare but high-impact chokepoint events - driven largely by potential Red Sea and Suez crises. That was before anyone modeled a dual closure.
BCG estimated in early 2024 that Red Sea disruptions alone - affecting only the Bab el-Mandeb corridor - shaved approximately 1.3% off global seaborne trade volume in just half a month. A protracted dual closure would be an order of magnitude worse.
The IEA’s March 2026 Oil Market Report states that global oil supply plunged by 8 million barrels per day in March, with Gulf countries cutting total production by at least 10 million barrels per day since storage was filling up and there was nowhere to ship. Under a dual closure, those figures could climb to 15-20 million barrels per day of effective disruption.
For a 1-month Hormuz-only closure, the GDP impact is manageable - perhaps 0.1-0.3% of global GDP - because strategic reserves provide a buffer. The IEA’s 400-million-barrel release covers roughly four weeks. But strategic reserves are a one-time intervention. Once they are depleted, there is no second buffer.
For a 3-month dual closure, the damage escalates dramatically. Oil at sustained $130-$150 levels would act as a massive tax on every importing economy. Japan and South Korea, which source approximately 95% of their oil through Gulf straits, face GDP contractions in the range of 3-4%. GCC states themselves - which depend on the straits for over 80% of food imports - face a humanitarian crisis on top of the economic one: by mid-March 2026, 70% of the region’s food imports had already been disrupted. India, which sources roughly 60% of its oil from the Gulf, could see 2-3% GDP contraction.
For a 6-month dual closure - the true worst case - the global economy enters recession territory. Macquarie’s framework implies that at $200 oil, energy expenditures reach 5-6% of global GDP. Goldman Sachs notes that the system has “shifted from buffered to fragile” with nearly 500 million barrels of total liquids already lost. The global average GDP impact could reach -2.5% to -5.5%, with energy-dependent regions far worse.
Andrew Harbourne of Wood Mackenzie noted that the IEA’s 400-million-barrel release covers only about four weeks of Gulf disruption and “cannot cover a sustained shortfall.” If oil reaches $150-$200 per barrel, diesel and jet fuel could effectively price at $200-$250 per barrel, according to WoodMac.
Who Gets Hit Hardest - and Who Survives
The impact is deeply asymmetric. Some economies face existential risk while others absorb the shock.
Japan and South Korea are the most exposed. Japanese refiners obtain about 95% of their crude from Saudi Arabia, Kuwait, the UAE, and Qatar - virtually all of it delivered via Hormuz. They have already asked the government to release stockpiled oil. South Korea faces a nearly identical dependency profile.
China receives about a third of its oil via Hormuz and maintains approximately a billion barrels in strategic reserves - a few months of supply. Beijing has been negotiating directly with Tehran for passage rights: on March 26, Iran announced that Chinese, Russian, Indian, Iraqi, and Pakistani ships would be allowed to transit Hormuz. But this selective access creates a two-tier global energy system where Western-aligned economies are shut out while Chinese-aligned ones receive preferential treatment.
The GCC states face a paradox: they produce the oil but cannot export it, and they import 80% of their food through the same straits. The maritime blockade triggered what has been described as a “grocery supply emergency” across the Gulf, with retailers like Lulu Retail airlifting staples and consumer prices spiking 40-120%. Iranian strikes on desalination plants have raised fears of a humanitarian crisis.
Europe depends on the region for 12-14% of its LNG, primarily from Qatar. The EU would face both energy price inflation and a supply chain disruption for goods normally transiting Suez. The European Parliament has warned that longer Cape routes would raise prices for fuel, food, and commodities across the continent.
The United States is the most insulated major economy. U.S. imports from Gulf countries through Hormuz amounted to only about 500,000 barrels per day in 2024 - roughly 7% of total U.S. crude imports and just 2% of U.S. petroleum consumption. But the U.S. is not immune to global price contagion. California gasoline prices already exceeded $5 per gallon during the second week of March. Nationally, average gas prices approached $4 per gallon.
Brazil faces a unique vulnerability: it is almost entirely dependent on imported fertilizers, with nearly half transiting Hormuz. As the source of 60% of global soybean exports and a major exporter of corn and sugar, a sustained fertilizer shortage would have cascading effects on global food security.
The Clock Is Ticking
As of March 27, 2026, the situation remains in flux. President Trump has signaled negotiations with Iran, and oil prices have retreated from their peaks. But the strait remains effectively closed. Tanker traffic is at 5% of normal. The 400-million-barrel IEA strategic reserve release is being drawn down. And the Houthis continue to signal readiness.
Neil Atkinson, former head of oil at the IEA, put it most directly in a CNBC interview: “If this closure of the Strait persists, those oil stocks, if they are deployed, will be depleted, and we are going to be in a situation where we are going to be in a crisis the likes of which we have never seen before.”
Asked what that could mean for prices, Atkinson replied: “We are getting into the realms of educated guesswork here. There is no precedent for this. The sky is the limit.”
The dual-chokepoint scenario is not a hypothetical. It is one Iranian phone call away.
This analysis is for informational purposes only and does not constitute financial advice. Markets are highly volatile and unpredictable during geopolitical crises.
Sources:
U.S. Energy Information Administration, “Amid regional conflict, the Strait of Hormuz remains critical oil chokepoint,” June 2025
U.S. Energy Information Administration, “The Strait of Hormuz is the world’s most important oil transit chokepoint,” November 2023
International Energy Agency, Oil Market Report, March 2026
UNCTAD, Review of Maritime Transport, 2024
UNCTAD, “Navigating Troubled Waters” Rapid Assessment, February 2024
Verschuur et al., “Quantifying the economic impact of chokepoint disruptions,” Nature Communications, 2025
Congressional Research Service, “Iran Conflict and the Strait of Hormuz: Impacts on Oil, Gas, and Other Commodities,” March 2026
Macquarie Group Research Note, March 27, 2026 (via Bloomberg)
Goldman Sachs Global Commodities Research, March 2026
BCG, “Red Sea Disruptions: Impact Scenarios,” early 2024
Wood Mackenzie, Oil Markets Analysis, March 2026
Coface, “Red Sea Crisis: Economic Impact Assessment,” 2024
European Parliament, “Red Sea Disruptions and EU Trade,” 2024
CNBC, “Brent oil tops $110 again after Chinese ships are turned away from Strait of Hormuz,” March 27, 2026
CNBC, “Oil prices: Analysts raise the alarm as crude soars over Iran war,” March 9, 2026
CNBC, “Oil prices slide as Trump’s Hormuz ultimatum keeps markets on edge,” March 23, 2026
Al Jazeera, “Can three pipelines help oil escape Strait of Hormuz?” March 27, 2026
The National, “Bab Al Mandeb: How Iran could bend a second strait to its will,” March 26, 2026
Atlantic Council, “Will the Houthis join the Iran war?” March 2026
CBS News, “As Iran keeps Strait of Hormuz closed, it’s also threatening to target another vital Mideast shipping lane,” March 27, 2026
CGTN/RIA Novosti, “Yemen’s Houthis weigh Bab al-Mandab blockade to back Iran,” March 20, 2026
Lloyd’s List, Red Sea and Hormuz shipping tracking data, March 2026
Kpler, Saudi Arabia pipeline flow data, March 2026
Rystad Energy, oil supply disruption estimates, March 2026

