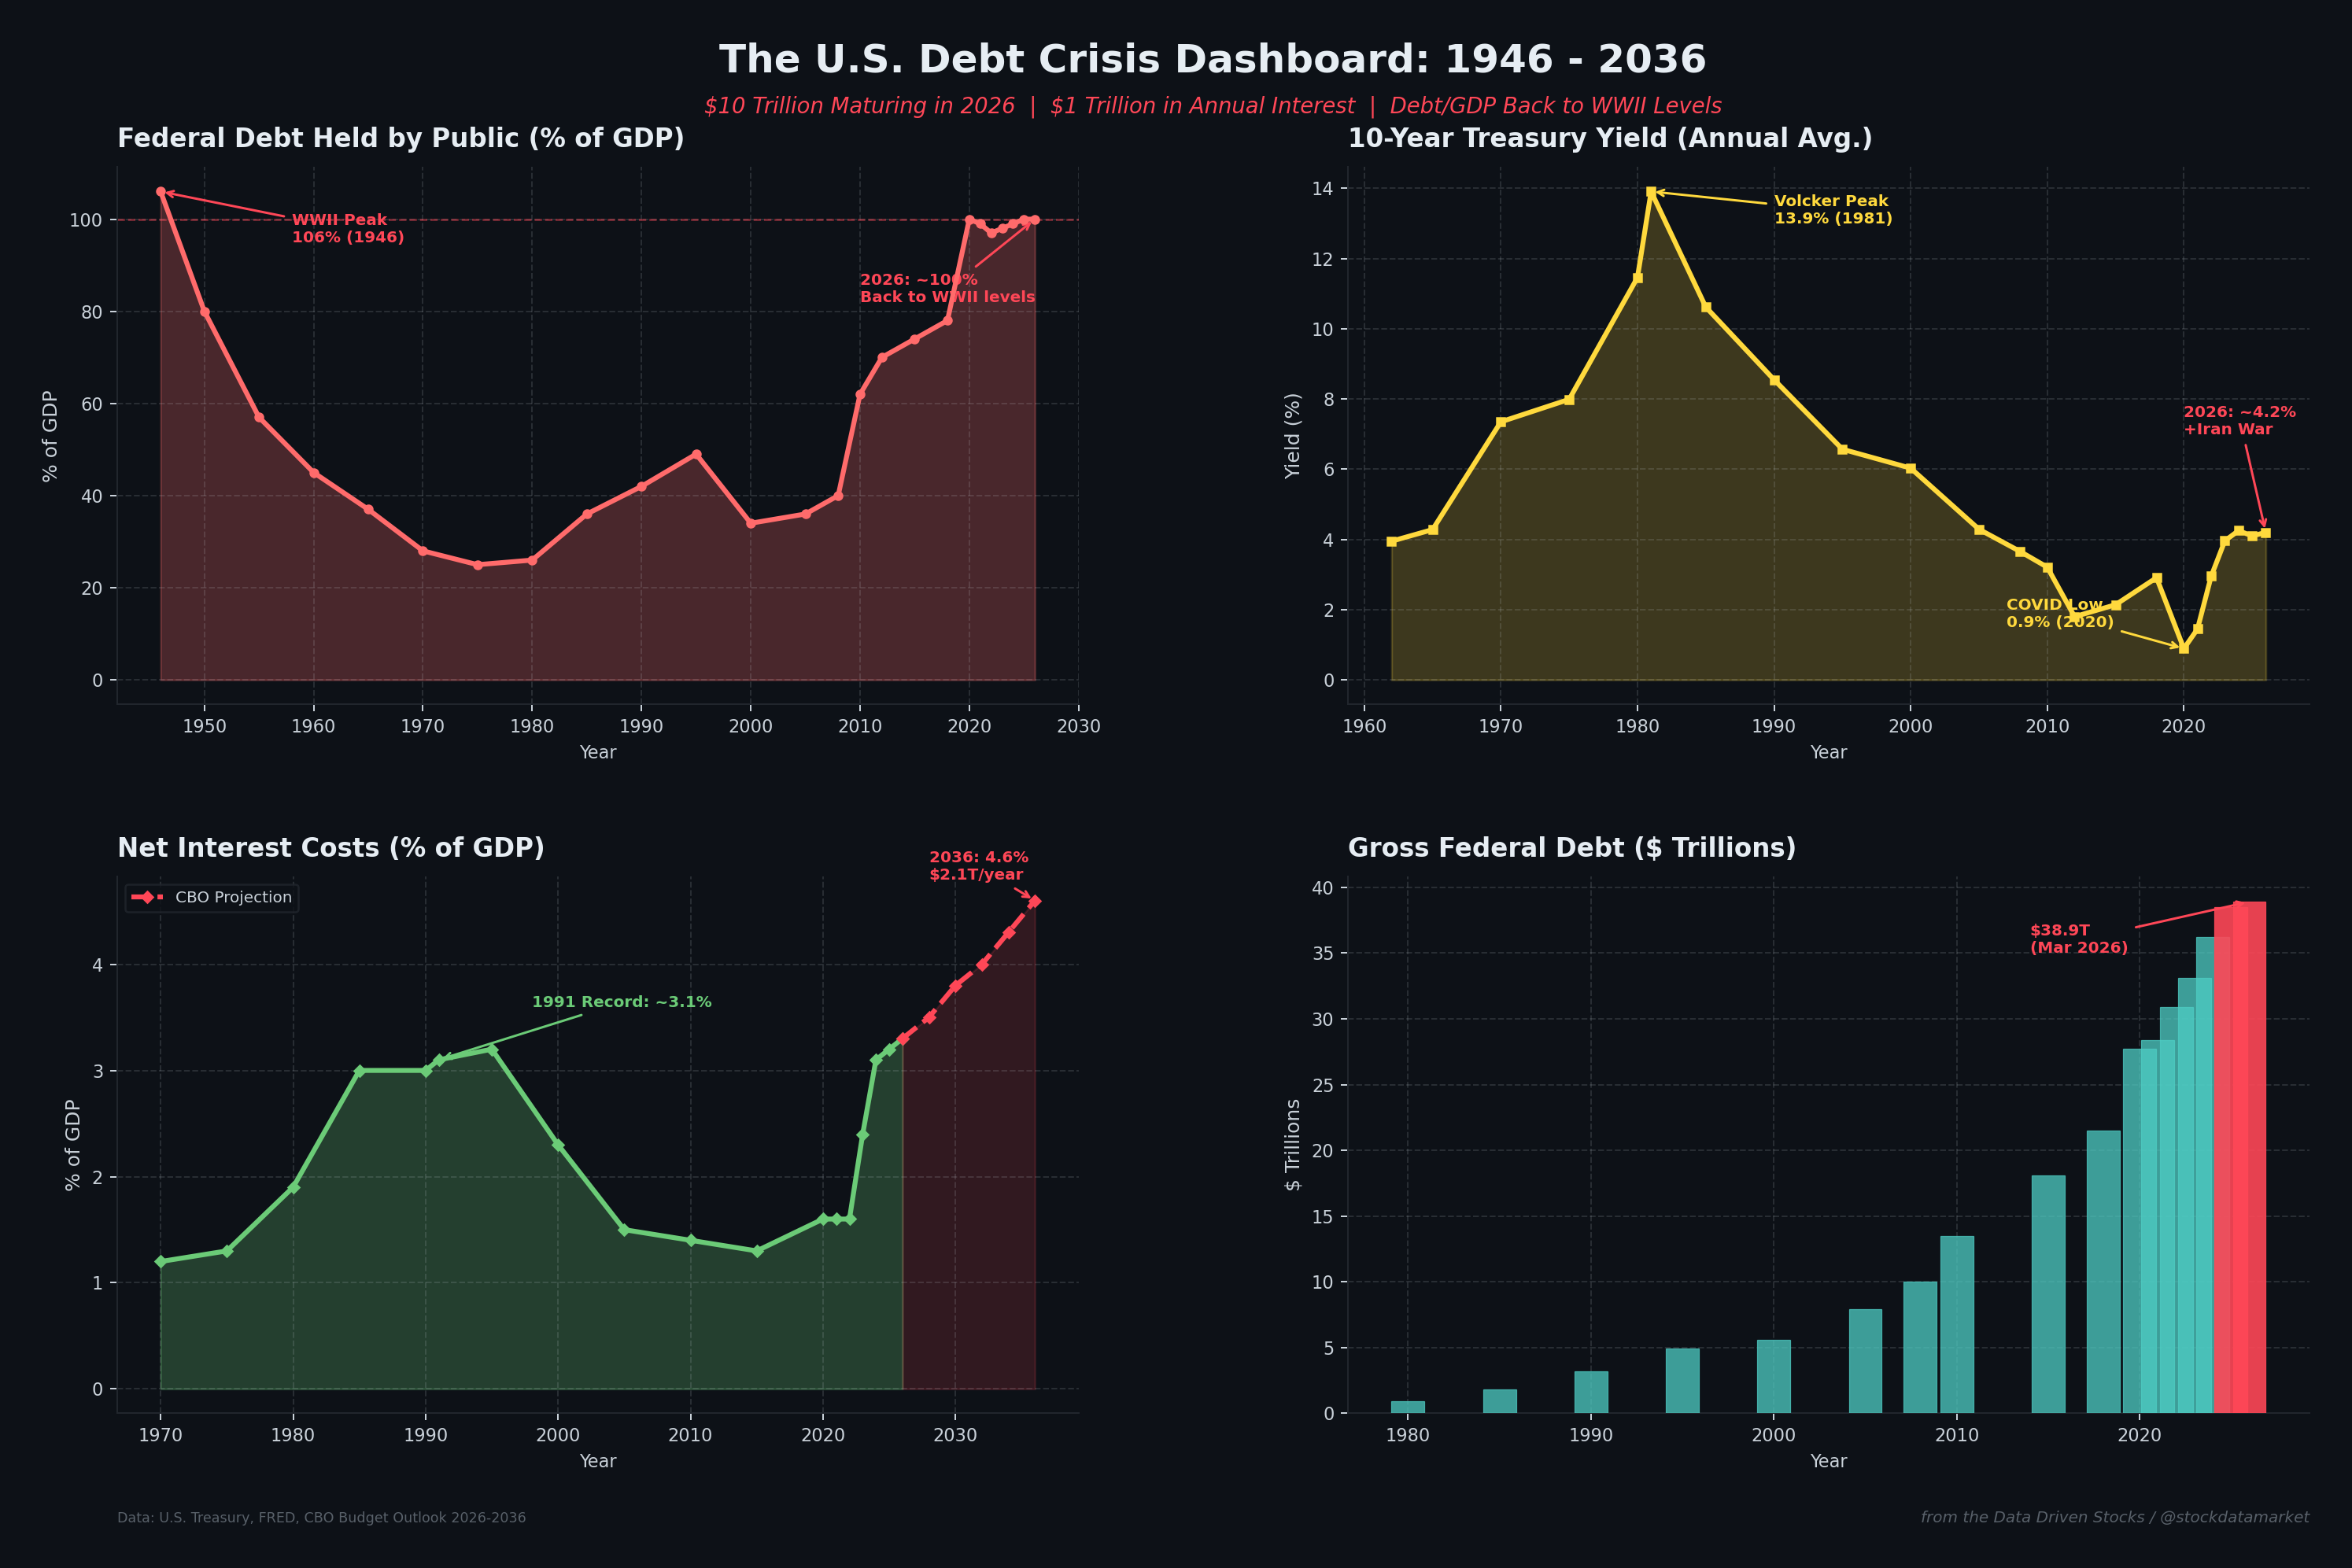
$10 Trillion in U.S. Debt Matures in 2026 - And Nobody’s Talking About It
The largest refinancing event in American history is happening right now. War with Iran is making it worse. Here’s why the numbers should terrify you.

There’s a number floating around Washington right now that should be on the front page of every financial publication in the country, but somehow isn’t getting the attention it deserves. That number is $10 trillion. That’s the approximate amount of U.S. Treasury debt that will mature in 2026 - roughly one-third of all outstanding marketable government debt, rolling over in a single calendar year. It is, by any historical measure, unprecedented.
And it’s arriving at the worst possible time.
The United States is simultaneously waging a costly war in Iran that has sent oil prices surging above $113 a barrel and pushed Treasury yields to their highest levels of the year. The federal government is running a $1.9 trillion annual deficit. Interest on the national debt is on pace to exceed $1 trillion for the first time in history this fiscal year. And the Federal Reserve, which would normally step in to ease financial conditions during a crisis, is frozen in place - paralyzed by the inflationary shock of war-driven energy prices.
This is the story of how America’s debt maturation schedule became a ticking time bomb, why 2026 is unlike any refinancing challenge the U.S. has ever faced, and what it means for your money.
The Maturity Wall: What $10 Trillion in Rollovers Actually Looks Like
To understand why 2026 is so dangerous, you need to understand what happens when Treasury debt “matures.” When the U.S. government borrows money by issuing bonds, notes, and bills, those securities come with an expiration date. When that date arrives, the Treasury has to pay investors back. But because the government is running massive deficits, it can’t actually pay the money back - it has to issue new debt to replace the old debt. This process is called “rolling over” the debt.
In normal times, this is routine. The Treasury holds regular auctions, investors show up to buy, and the machine keeps turning. But 2026 is not normal times. The sheer volume of debt maturing this year dwarfs anything the Treasury has ever had to refinance.

According to analysis from RIA Advisors, approximately $10 trillion in Treasury securities will mature in 2026 - about one-third of the roughly $31 trillion in marketable debt held by the public. That comes on top of $9.2 trillion that already matured in 2025. So across just two calendar years, the federal government needs to refinance roughly $19 trillion in debt. To put that in perspective, the entire U.S. GDP is roughly $32 trillion.
The reason so much debt is concentrated in this window goes back to the pandemic. When COVID-19 hit in 2020, the Treasury leaned heavily on short-term bills (with maturities of 4 to 52 weeks) because they were cheap and easy to sell when the Fed had pinned interest rates near zero. That strategy made sense at the time - the average interest rate on all outstanding U.S. debt fell to just 1.5% by early 2021, the lowest in over two decades. But it created a problem: all that short-term borrowing has been rolling over and stacking up, and the bill is coming due right now, at much higher interest rates.
The Peterson Foundation noted that about one-third of all existing debt held by the public - roughly $9.3 trillion - was scheduled to mature between April 2025 and March 2026. More than $3.1 trillion of that debt was originally issued two or more years ago, meaning it will need to be reissued at significantly higher rates than when it was first sold. The Congressional Budget Office expects interest rates on longer-term securities to remain elevated compared to the previous decade.
Now, some analysts will tell you not to panic. RIA Advisors pointed out that the investors who currently own that $10 trillion - money market funds, insurance companies, foreign central banks, pension funds - are largely required by law or operational mandate to reinvest their proceeds in Treasuries. So the demand will likely be there. That’s true. But it misses the bigger picture: even if every dollar of maturing debt gets rolled over, the government is refinancing at rates that are two to three times higher than when much of this debt was originally issued. That’s the real problem.
The Cost of Rolling Over: Why Higher Rates Are a Slow-Motion Crisis
The average interest rate on the total marketable national debt stood at 3.355% as of February 2026, according to the Joint Economic Committee of the U.S. Senate. That might not sound terrifying, but consider that just five years ago, in early 2021, that same average was only 1.512%. The rate has more than doubled in five years. And because the debt itself has grown so much larger in that time - gross federal debt has ballooned from about $28.4 trillion in 2021 to over $39 trillion today, while debt held by the public surged from $22.3 trillion to $31.4 trillion - the compound effect on interest payments is staggering.

The math is brutal and simple. At roughly $31 trillion in debt held by the public and a 3.355% average rate, the federal government is paying about $1.04 trillion per year in net interest. Each additional percentage point (100 basis points) on that average rate translates to approximately $310 billion in additional annual interest payments. So if the average rate drifts up to, say, 4.35% - which is entirely plausible given where current market yields are - that’s an extra $310 billion per year in interest costs alone, without a single dollar being added to the national debt.
The CBO’s latest Budget and Economic Outlook, published in February 2026, projects that net interest payments will total $1.039 trillion in fiscal year 2026. That represents about 3.3% of GDP and 18.6% of all federal revenue. Every dollar in five that the government collects in taxes now goes straight to bondholders. The CBO projects this will only get worse: interest costs are expected to reach $2.14 trillion by 2036, consuming more than a quarter of all federal revenue and eclipsing the entire defense budget.
The American Action Forum put it another way: interest on the national debt will be the fastest-growing spending category in the federal budget over the next decade, increasing by 106% between 2026 and 2036. By 2048, interest payments are projected to become the single-largest federal expenditure - meaning the government will spend more servicing its past borrowing than investing in anything else.

The Peterson Foundation captured the absurdity of the current trajectory in a single statistic: in 2026, the U.S. Treasury is paying $2.8 billion per day in interest. By 2036, that figure rises to $5.9 billion per day. Over the next decade, cumulative interest payments will total $16.2 trillion - roughly three times what the government spent on interest during the entire 2006-2025 period.
The Iran War: Gasoline on a Fiscal Fire
As if the structural debt problem wasn’t enough, the U.S.-Iran war that began on February 28, 2026 has thrown a massive wrench into the Treasury market. The conflict has produced a phenomenon that confused even seasoned bond traders: instead of falling (as they normally do during geopolitical crises when investors flee to the safety of government bonds), Treasury yields surged.
The explanation is straightforward once you understand it. Yes, there was an initial safe-haven rush. The 10-year Treasury yield dropped to about 3.90% on March 2, the lowest level since mid-2025, as investors reflexively bought Treasuries. But that impulse lasted approximately 48 hours. As the scope of the conflict became clear - U.S. and Israeli strikes on Iranian military and nuclear infrastructure, Iran’s closure of the Strait of Hormuz, oil prices jumping from around $83 per barrel to above $113 within weeks - the market’s focus shifted from “safety” to “inflation.”

By March 10, the 10-year yield had jumped to approximately 4.26%, according to CNBC, with Morgan Stanley noting that both 2-year and 10-year yields were up roughly 20 basis points from pre-war levels. By March 27, the 10-year hit 4.46% - a year-to-date high - as Brent crude futures traded above $113 a barrel. Bloomberg reported that benchmark yields retreated somewhat on Friday March 27, with the 2-year yield falling as much as nine basis points to 3.90%, as some investors doubted the energy crisis would lead the Fed to actually raise rates. But the damage was done.
Charles Schwab’s analysis from mid-March attributed the yield spike directly to inflation expectations from the war. Former IMF economist Desmond Lachman, writing for the American Enterprise Institute, argued that anticipated defense spending would put sustained upward pressure on long-term rates, overriding any residual safe-haven effect. Morgan Stanley’s Chief Investment Officer warned that Treasuries were already flashing caution signals, with yields rising on a combination of inflation fears, heavy issuance, and weakening demand at auctions.
The war’s impact on yields matters enormously for the debt maturation story. Remember, the Treasury needs to refinance roughly $10 trillion this year. If yields are 50 basis points higher than they were before the war started, that alone translates to tens of billions of dollars in additional annual interest costs on the newly issued debt. The deVere Group’s Nigel Green summarized the dynamic: rising yields increase the cost of financing an already enormous debt burden and ripple through the entire economy via mortgages and corporate borrowing. With U.S. debt above $39 trillion, the sensitivity to higher yields is far greater than in previous cycles and the margin for error is much smaller.
The Fed, meanwhile, is stuck. Officials acknowledged the war’s uncertainty at the March 2026 policy meeting, and Governor Waller noted that persistent inflation risk from higher energy prices might delay rate cuts. The market responded by pricing in fewer cuts for 2026 - and some traders even began pricing in the possibility of a rate hike by year-end. That is exactly the opposite of what a government drowning in maturing debt needs.
2026 vs. History: A Crisis Unlike Any Before
One of the most important questions to ask about 2026’s debt maturation is: have we seen anything like this before? The answer is no - not at this scale, and not with this combination of compounding risk factors.

Let’s walk through the major episodes.
The WWII Peak (1946) is the most commonly cited comparison. Federal debt held by the public reached 106% of GDP - essentially the same as today’s approximately 100%. But the similarities end there. In 1946, the 10-year Treasury yield was just 2.2%, held artificially low by the Federal Reserve’s interest rate peg (a policy of financial repression that kept borrowing costs below market rates). Only about 25% of debt was maturing within 12 months. And critically, the U.S. ran primary budget surpluses for much of the postwar period, actively paying down the debt rather than adding to it. Research from the IMF has shown that contrary to popular belief, the U.S. didn’t simply “grow out” of its WWII debt - it was reduced through a combination of budget discipline, surprise inflation, and financial repression that would be politically impossible today.
The Volcker Shock (1981) brought the highest interest rates in American history - the 10-year yield averaged nearly 14%. But debt-to-GDP was only 26% at the time. The government could stomach high rates because the debt stock was relatively small. Today, debt is four times larger as a share of GDP, making the economy exponentially more sensitive to rate changes.
The S&L Crisis and Gulf War (1991) is perhaps the most instructive parallel. Net interest costs hit about 3.1% of GDP that year - a record at the time that stood until 2025. But debt-to-GDP was only 42%, and only about 22% of debt was maturing within 12 months. In other words, even when interest costs set what was then a historical record as a share of the economy, the underlying debt burden was less than half of what it is today, and the refinancing pressure was a fraction of what the Treasury faces now.
The Global Financial Crisis (2008-2010) saw debt-to-GDP jump from 40% to 62% as the government bailed out banks and stimulated the economy. But yields were falling, not rising - the 10-year dropped to around 3.2% as the Fed slashed rates to zero. The refinancing was relatively painless because rates were low and getting lower. The average maturity of outstanding securities did shorten to roughly four years at the end of 2008 as the Treasury leaned on short-term bills, according to a CBO primer on federal debt, but the low-rate environment meant that didn’t create the kind of interest-cost spiral we see today.
The COVID-19 response (2020-2021) pushed debt-to-GDP to 100% and about 30% of debt was maturing within 12 months. But once again, rates were near zero - the 10-year averaged just 0.9% in 2020. The government was borrowing massively, but at essentially free money rates. That era is over.
What makes 2026 uniquely dangerous is the simultaneous presence of all the worst elements from each of these episodes. You have WWII-level debt loads, interest costs that have eclipsed the 1991 record as a share of GDP, an unprecedented 33% of debt maturing within 12 months, rising yields driven by a war that shows no signs of ending, and a Federal Reserve that can’t cut rates because of oil-driven inflation. No single previous episode combined all these risk factors at once.
The Vicious Cycle: Debt Begets More Debt
The most insidious aspect of the current situation is the self-reinforcing feedback loop between debt, interest costs, and deficits. The CBO projects the federal deficit at roughly $1.9 trillion for fiscal year 2026 - about 5.8% of GDP after adjusting for timing shifts in certain payments. A significant and growing portion of that deficit is composed entirely of interest payments. In other words, the government is borrowing money to pay interest on money it already borrowed.
This is the vicious cycle the Peterson Foundation has been warning about for years: rising debt leads to higher interest costs, which widen the deficit, which requires more borrowing, which increases the debt, which raises interest costs further. Under current CBO projections, debt held by the public will grow from about $31 trillion today to over $56 trillion by 2036, pushing the debt-to-GDP ratio to 120% - surpassing the all-time record set after World War II.
The Committee for a Responsible Federal Budget noted that the recently passed “One Big Beautiful Bill” reconciliation act alone will add $4.7 trillion to deficits through 2035, including interest costs and macroeconomic effects. While tariff revenues are projected to offset about $3 trillion of that, the net result is still substantially more borrowing - at a time when the government can least afford it.
And there’s another wrinkle that doesn’t get enough attention. The Social Security retirement trust fund is now projected to be depleted by 2032 - just six years away. When that happens, benefits would be automatically cut by 28% under current law, or Congress would need to find additional funding, likely through more borrowing. The Highway Trust Fund will be depleted even sooner, by 2028. These approaching cliffs add further fiscal pressure on top of an already strained balance sheet.
What This Means for Markets and Your Money
The practical consequences of the maturity wall and rising interest costs are already rippling through the economy. The 30-year fixed mortgage rate climbed to 6.38% by late March 2026, up from 5.99% at the end of February. Corporate borrowing costs are rising. The S&P 500 fell for four consecutive weeks in March as the war and rising yields weighed on equity valuations.
The bond market, which has historically been the most reliable source of crisis signals, is sending a clear message: the assumption that demand for U.S. debt will always absorb whatever is issued is being tested. Treasury auctions during the war saw weaker demand, pushing yields higher still. The pattern has become almost mechanical: escalation drives oil higher, which drives inflation expectations higher, which drives yields higher, which drives funding costs higher.
For investors, the implications are significant. Higher long-term Treasury yields put downward pressure on equity valuations, especially for growth and technology stocks with long-duration cash flows. They also pressure bond portfolios - long-duration Treasury bonds lose value when yields rise. The traditional 60/40 portfolio, which relies on bonds to provide stability when stocks fall, hasn’t been working as expected because bonds and stocks have been declining together.
The Bottom Line
The United States is conducting the largest debt refinancing operation in the history of sovereign finance, in the middle of a war, with inflation rising, yields climbing, and a central bank that can’t intervene. The $10 trillion maturity wall of 2026 is not a theoretical risk - it’s happening right now, in real time, at every Treasury auction.
The government will almost certainly manage to roll over the debt. The Treasury market is deep, the dollar remains the world’s reserve currency, and major institutional investors have no choice but to reinvest. But “managing” this rollover and doing it painlessly are two very different things. Every basis point of additional yield on $10 trillion of new issuance costs taxpayers billions. And those costs compound, year after year, squeezing out spending on infrastructure, education, defense, and everything else the government does.
The maturity wall is less a crisis trigger than a permanent upward tilt to the U.S. rate structure. It’s a structural shift that will shape fiscal and monetary policy for years to come. And right now, with oil prices above $100, Brent futures trading above $113, the Strait of Hormuz disrupted, and the 10-year yield at its highest since mid-2025, the conditions for managing this refinancing could hardly be worse.
The clock is ticking. The auctions are happening. And $10 trillion is a lot of debt to roll over when the world is on fire.
Sources
U.S. Treasury Fiscal Service, “Debt to the Penny” and “Historical Debt Outstanding” datasets, via fiscaldata.treasury.gov (accessed March 2026).
Federal Reserve Bank of St. Louis (FRED), series GFDEBTN (Federal Debt: Total Public Debt) and FYGFDPUN (Debt Held by the Public), fred.stlouisfed.org.
U.S. Treasury, Daily Treasury Yield Curve Rates (Constant Maturity), home.treasury.gov/resource-center/data-chart-center/interest-rates.
Congressional Budget Office, “The Budget and Economic Outlook: 2026 to 2036,” published February 2026, cbo.gov/publication/61882.
Congressional Budget Office, Director’s Statement on the Budget and Economic Outlook for 2026 to 2036, cbo.gov/publication/62050.
Peter G. Peterson Foundation, “Interest Costs on the National Debt Are Reaching All-Time Highs,” February 12, 2026, pgpf.org.
Peter G. Peterson Foundation, “High Interest Rates Left Their Mark on the Budget,” April 23, 2025, pgpf.org.
American Action Forum, “Interest Payments on the National Debt: The Near- and Long-Term Outlook,” March 24, 2026, americanactionforum.org.
Committee for a Responsible Federal Budget, “CBO’s February 2026 Budget and Economic Outlook,” March 2026, crfb.org.
EPIC for America, “CBO Baseline for FY 2026 Projects Rising Spending, Higher Revenues, and Growing Debt,” March 2026, epicforamerica.org.
Joint Economic Committee, U.S. Senate, Monthly Debt Update (February 2026), jec.senate.gov.
RIA Advisors (Lance Roberts), “A Third Of US Debt Matures In 2026,” February 12, 2026, realinvestmentadvice.com.
First National Financial, “On the Radar: Will the $9 Trillion Maturity Wall in 2025 Force U.S. Treasury Yields Higher?”, firstnational.ca.
Seeking Alpha, “A Debt-Driven Credit Crisis May Be On The Horizon,” December 9, 2025, seekingalpha.com.
Fortune, “Two months into the new fiscal year, and the government is already spending $10 billion a week on servicing national debt,” December 4, 2025, fortune.com.
Fortune, “America’s national debt borrowing binge means interest payments will rocket to $2 trillion a year by 2036, CBO says,” February 11, 2026, fortune.com.
CNBC, “10-year Treasury yield tops 4.06% as surging oil prices from Iran conflict raise inflation angst,” March 3, 2026, cnbc.com.
CNBC, “Treasury yields rise with oil prices as traders assess Iran war’s impact on inflation,” March 11, 2026, cnbc.com.
CNBC, “As Iran war disrupts oil prices, consumers could be ‘hammered,’ economist says,” March 10, 2026, cnbc.com.
CNBC, “Iran war-hit oil prices will soon rise if Hormuz stays shut,” March 28, 2026, cnbc.com.
Bloomberg, “Treasury Yields Reach Year’s Highs as Iran Stalemate Lifts Oil,” March 27, 2026, bloomberg.com.
Morgan Stanley, “Iran Conflict: Oil Price Impacts and Inflation,” March 2026, morganstanley.com.
MCB Group, “Oil Shockwaves: How the US-Israel-Iran war would ripple through markets and economies,” March 2026, mcbgroup.com.
Center for American Progress, “The War in Iran Will Raise Fuel Prices and Costs Throughout the Economy,” March 27, 2026, americanprogress.org.
Investorideas.com (Nigel Green, deVere Group), “Oil, Wall Street, And Bond Markets Are Trump’s Only Guardrails on Iran,” March 27, 2026, investorideas.com.
Wikipedia, “Economic impact of the 2026 Iran war,” en.wikipedia.org (accessed March 28, 2026).
U.S. Department of the Treasury, “Treasury Announces Marketable Borrowing Estimates,” November 3, 2025, home.treasury.gov.
TreasuryDirect, “History of the Debt,” treasurydirect.gov.
Julien Acalin and Laurence Ball (IMF Working Paper), “Did the U.S. Really Grow Out of Its World War II Debt?”, 2024, imf.org.
CEPR (VoxEU), “Reassessing the Fall in US Public Debt after World War II,” cepr.org.
Citigroup, “Back to the Future: Lessons from U.S. Fiscal Deleveraging after World War II,” citigroup.com.
Congressional Budget Office, “Federal Debt: A Primer,” cbo.gov/publication/56309.

